Co-author: Eugen Nicolae Cojan
As the father of quality management W. Edwards Deming, put it:
“Without data, you are just another person with an opinion.”
This post combines real-world issues faced by our team and our approach to addressing them. It also shares the key metrics to start monitoring Kafka client implementations effectively.
Case studies
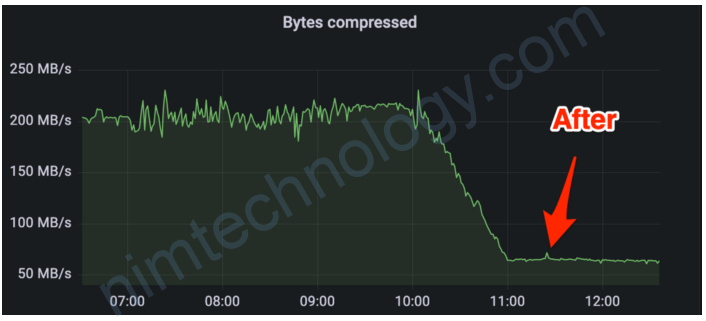
1. What could go wrong with the Producer while scaling the Consumer?
One day we increased the number of partitions for a topic used by our client by 2.5x. It is a high-traffic topic, with a 3:1 consume-to-produce ratio, replication factor 3, peaking at 250K msg/s, 400 MB/s IN, and 1.2 GB/s OUT at that time. Without changes in traffic patterns and settings of upstream service, we noticed that topic started growing in size, and the performance of upstream producers degraded on batch size and compression rate. Batches were triggered before linger.ms time expiration, but still at the lower size compared with batch.size setting.
The fix
The increased number of partitions resulted in a larger number of batches for each topic-partition pair kept in RecordAccumulator memory(see producer internals), which were not filled accordingly. To deal with that, we changed partitioner.class in the producer settings to the DefaultPartitioner, which tries to batch records with null keys into the same partition and moves to a new partition once the current one is full.
Impact
Batch size increased, resulting in better compression and less incoming network traffic. Overall savings: ~200 MB/s of incoming traffic, ~600 MB/s OUT, ~400 MB/s on inter-broker replication(topic has replication factor 3) and ~78T storage.
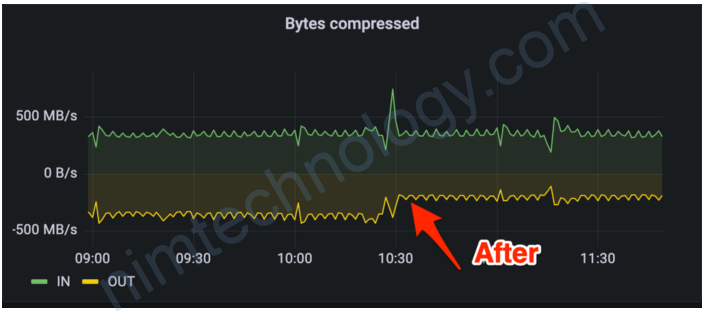
2. Strange upstream traffic
While checking metrics for one of the replication services, we observed that incoming traffic was significantly higher than outgoing traffic, a 2.6–3x difference. We plot the consumer incoming byte rate and producer outgoing byte rate on the same panel (listed below); that’s why we spot this unusual difference.
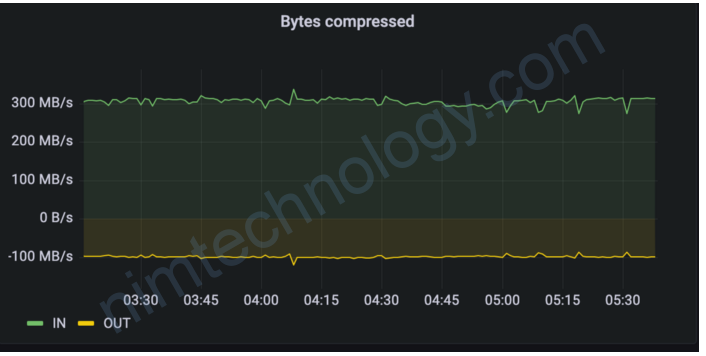
Since replication services are only moving traffic cross-region, this raised concerns about possible misconfigurations in upstream services.
The fix
We contacted upstream service, showed our metrics, and asked for a review of their producer settings. They missed a few settings on batching and compression, which were updated quickly.
Impact
Overall savings: ~130 MB/s of incoming and outgoing traffic, ~260 MB/s on inter-broker replication and ~41T storage. We also scaled down our Kafka cluster on edge by 50%, saving CPU and Memory costs.
3. My service not consuming, help!
One of our teams came to us asking for help troubleshooting why their service stopped consumption from the Kafka cluster. They didn’t have any errors in logs, and we didn’t observe any visible changes in traffic patterns on the topic.
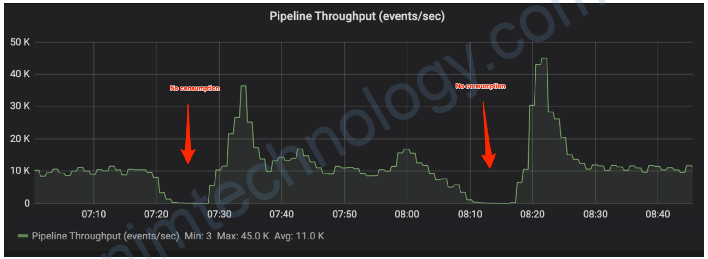
The fix
First, we asked the team to start collecting Kafka Consumer and Producer metrics and expose them to their Prometheus account. The team went with the approach of implementing a pluggable metrics reporter, as described below.
Using the consumer coordinator join-rate metric, we quickly identified that the consumer group was constantly rebalancing, resulting in stopped consumption. Next, we looked at last-poll-seconds-ago and saw that some of the members of the consumer group have a poll interval greater than their heartbeat.interval.ms, resulting in client-side failure detection and consumer leaving the group. This led us to investigations of downstream processing; the team noticed a significant increase in latencies, triggering backpressure and ultimately affecting the time between calling consumer poll.
At this point, we focused on minimizing the effect of downstream latencies and switched the consumer group assignor to CooperativeSticky based implementation. We also tuned max.poll.interval.ms and session.timeout.ms to accommodate changes in downstream processing times.
Impact
We stabilized the consumer group, which allowed continuous processing of the message without long interruptions. Meanwhile, the team got time to troubleshoot properly and fix downstream processing. Kafka Consumer and Producer metrics have been added to their dashboards and on-call run books.
Collecting metrics
Metrics represent raw measurements collected from Kafka client internals, providing useful insights into the operational aspects of the system. There are a couple of ways to collect Kafka client metrics:
- scraping JMX MBeans
- using pluggable metrics reporter
- using metrics() method on producer or consumer.
JMX MBeans
Kafka clients report metrics via JMX reporter, registered as MBeans. Producer MBeans have the prefix “kafka.producer:type=producer-metrics,” and consumer “kafka.consumer:type=consumer-metrics,”. If your team uses Prometheus for monitoring, there is a JMX Exporter project that can scrape and expose these metrics.
Pluggable Metrics Reporter
User can specify an implementation of org.apache.kafka.common.metrics.MetricsReporter interface via metric.reporters configuration parameter. Kafka client will accept multiple implementations, separated via comma. The interface requires the implementation of four methods:
// called when the reporter is registered for the first time
init(List<KafkaMetric> metrics)// called when a metric is added on updated
metricChange(KafkaMetric metric)// called when metric is removed
metricRemoval(KafkaMetric metric)// called when metrics are closed
close()
The reporter can access Producer and Consumer configuration parameters by overriding method configure(Map<String, ?> configs). This could be useful for passing additional parameters, like excluded or included metric names etc.
Another useful method to override is contextChange(MetricContext metricsContext). The MetricContext object can be populated with additional labels via config parameters in the form of metrics.context.<key>=<value> This method will be called before init(...)
If you are already using Dropwizard metrics, there is an implementation of reporter: SimpleFinance/kafka-dropwizard-reporter
Using metrics() method
Producer and Consumer expose a method for querying metrics, with the following signature: Map<MetricName, ? extends Metric> metrics() . Micrometer, for example, uses this approach. If you are already using Spring Boot— Micrometer is included via actuator dependency. There is a dependency for Quarkus as well, an example can be seen in the following guide. Both frameworks try to detect Kafka Producer or Consumer instantiations and bind metrics accordingly.
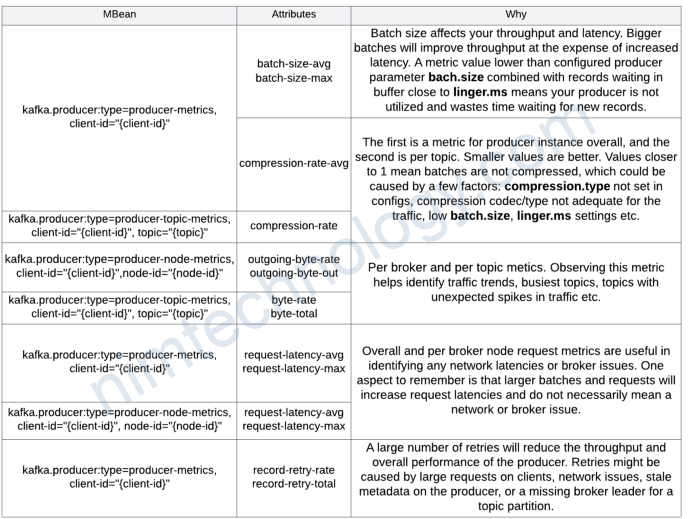
Monitoring Producer
Kafka Producer exposes a lot of metrics. Below are a couple of key metrics we recommend monitoring, covering Record Accumulator and Sender (see the previous post on Producer internals):
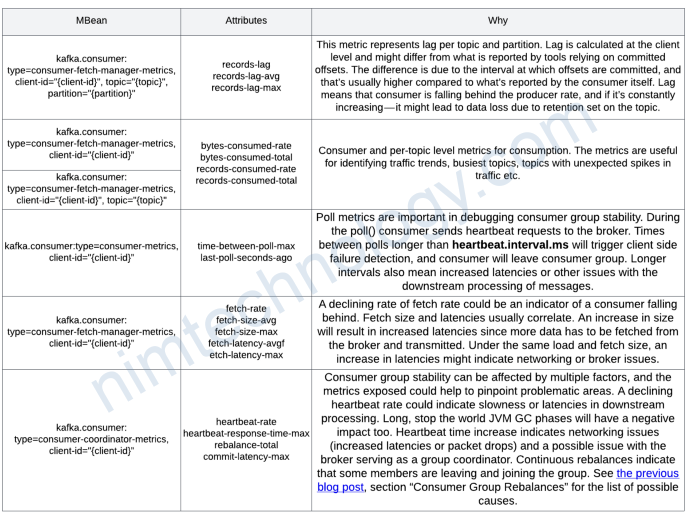
Monitoring Consumer
Kafka Consumer also offers many metrics, covering poll() loop, Group Coordinator, Fetcher, Network etc. We recommend starting with some of the key metrics below.
References
https://prometheus.io/
https://github.com/prometheus/jmx_exporter
https://kafka.apache.org/28/documentation.html#producer_monitoring
https://kafka.apache.org/28/documentation.html#consumer_monitoring