Logstash is a free and open server-side data processing pipeline that ingests data from a multitude of sources, transforms it, and then sends it to your favorite “stash.”
1) Install Logstash
https://www.elastic.co/downloads/logstash
https://github.com/deviantony/docker-elk
Ở link trên thì bạn sẽ thấy rất nhiều cách download cũng như cài đặt logstash.
Hiện tại mình run docker-compose cho nó nhanh và chúng ta cũng dễ dàng nâng version he!
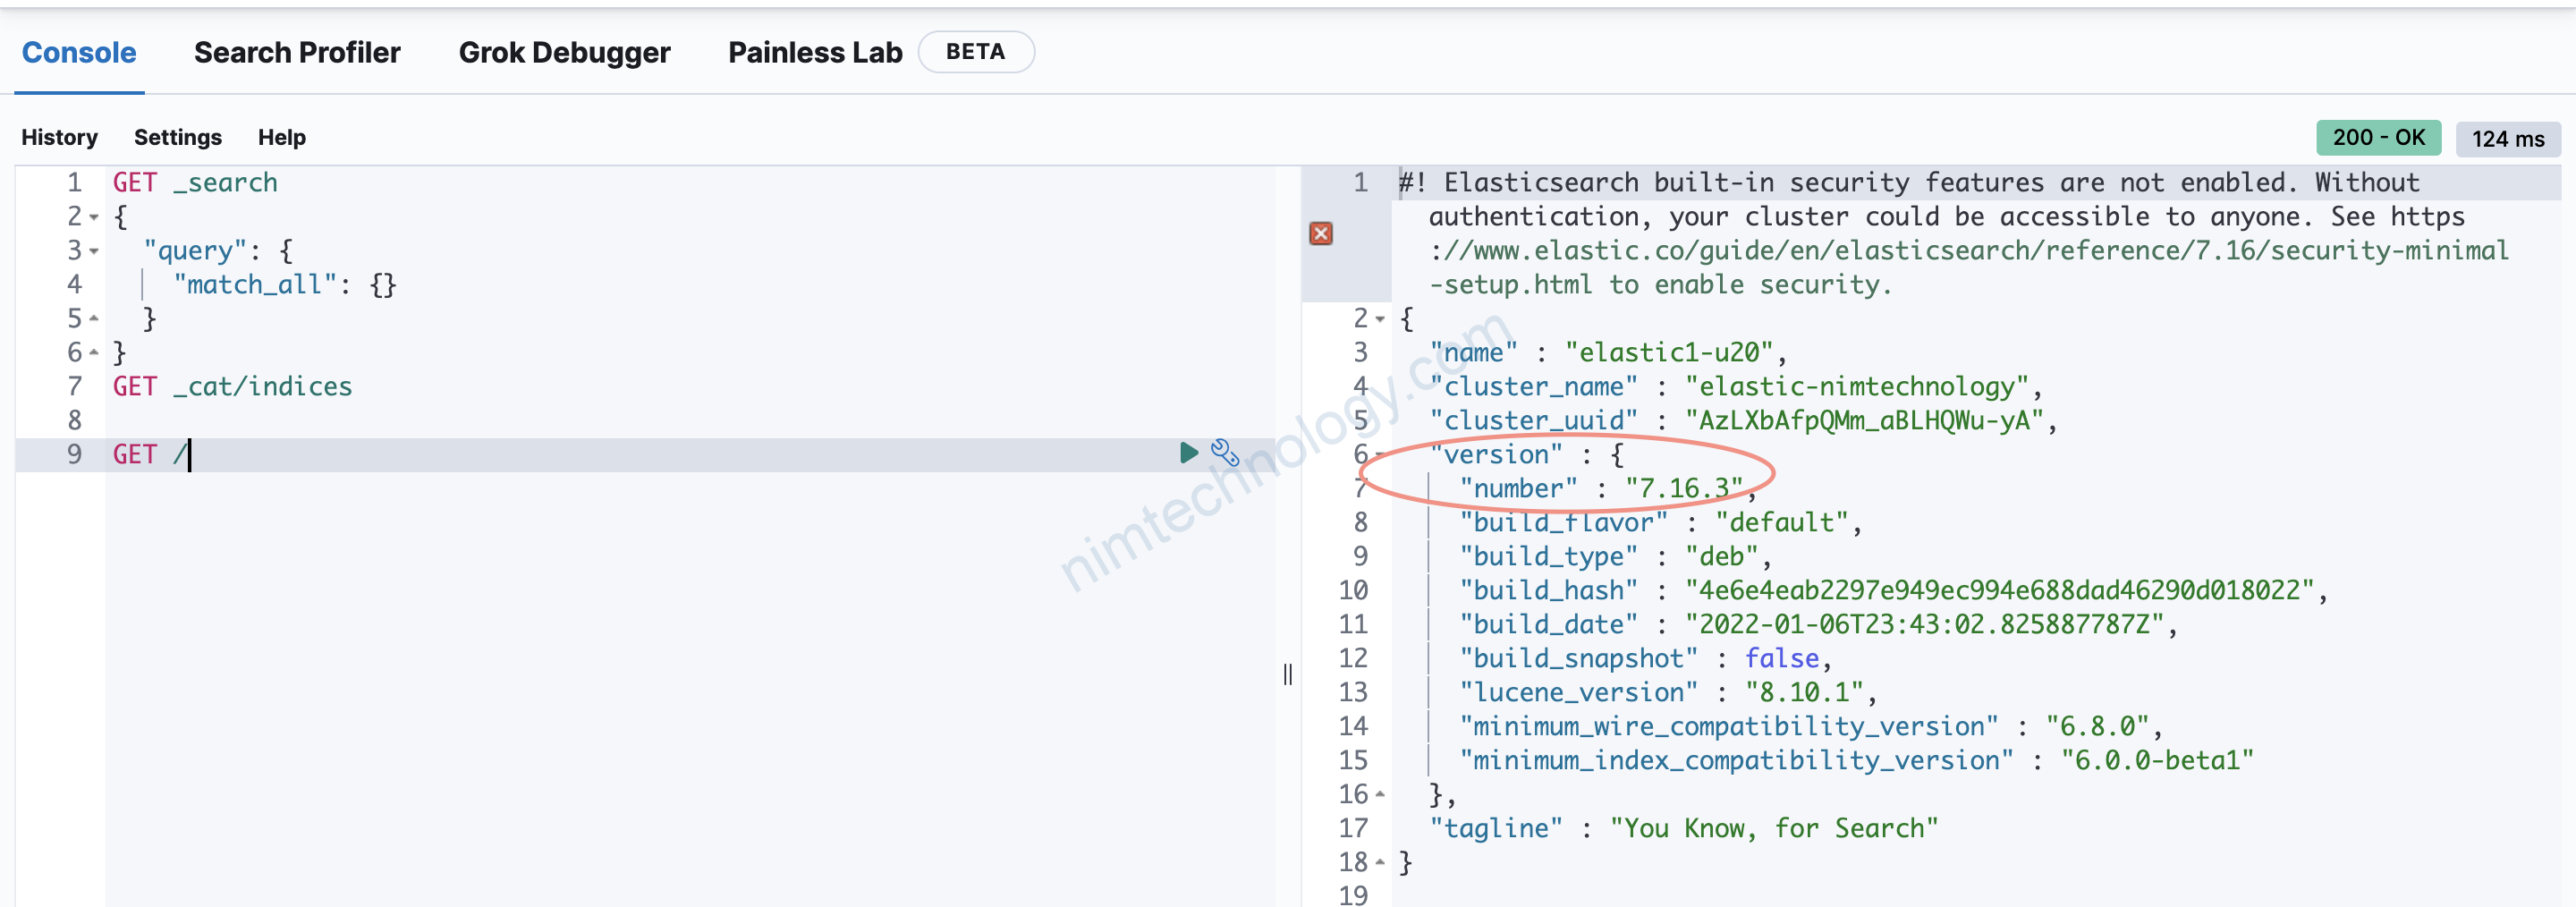
1.1) Check version Elastic
Đầu tiên kiểm tra phiên bạn elastic mà bạn đang chạy là bao nhiều:curl -XGET 'localhost:9200'
1.2) repair data before install
root@elastic1-u20:~/docker# ls
docker-compose.yml  kibana
root@elastic1-u20:~/docker# mkdir logstash
root@elastic1-u20:~/docker# ls
docker-compose.yml  kibana  logstash
root@elastic1-u20:~/docker# cd logstash/
root@elastic1-u20:~/docker/logstash# mkdir config
root@elastic1-u20:~/docker/logstash# mkdir pipeline
root@elastic1-u20:~/docker/logstash# ls
config  pipeline
Giờ tiến hành tạo các file config.
và để cấu hình ngon nghẻ ngày từ đầu thì anh em có thể tham khao bài biết sao:
[Logstash] Multi config, input, filter, output trong 1 logstash mà không gây ra sung đột cấu hình receive logs
file config/logstash.yml cấu hình logstash kết nối với elastic.
vi config/logstash.yml

---
## Default Logstash configuration from Logstash base image.
## https://github.com/elastic/logstash/blob/master/docker/data/logstash/config/logstash-full.yml
#
http.host: "0.0.0.0"
xpack.monitoring.elasticsearch.hosts: [ "http://<IP-Elastic>:9200" ]

## X-Pack security credentials
#
# xpack.monitoring.enabled: true
# xpack.monitoring.elasticsearch.username: elastic
# xpack.monitoring.elasticsearch.password: xxxxxxx
file config/pipelines.yml dùng để chúng ta phân chia pipeline ra.
Con logstash nhận được nhiều loại logs và từ nhiều server hay nhiều dịch vụ.
Ví dụ tạo riêng pipeline.id và port cho 1 service log nào đó.
ý tưởng là như thế.
vi config/pipelines.yml

# This file is where you define your pipelines. You can define multiple.
# For more information on multiple pipelines, see the documentation:
#   https://www.elastic.co/guide/en/logstash/current/multiple-pipelines.html

- pipeline.id: kong
  path.config: "/usr/share/logstash/pipeline/kong.conf"
Bài này mình sẽ cấu hình thực tế nhận log từ Kong
vi pipeline/kong.conf

# See https://www.elastic.co/guide/en/logstash/current/configuration-file-structure.html for detail

# Input is from UDP port 5000
input {
  udp {
    port => "5000"
  }
}

# Original Kong log is on JSON format and will be send to elasticsearch in field “message”.
# So we need to take the json from field “message”, and read the original format.
filter {
  json {
    source => "message"
    add_tag => ["kong"]
  }

#  mutate {
#     remove_field => [ "message" ]
#  }

  geoip {
    source => "client_ip"
  }
}

## Add your filters / logstash plugins configuration here

output {
        elasticsearch {
                hosts => "<IP-Elastic>:9200"
                ecs_compatibility => disabled
        }
}
Ở config trên:
Mình mở port 5000/UDP để Kong gửi vào.
Mình sử dụng filter JSON và có add thêm tag kong
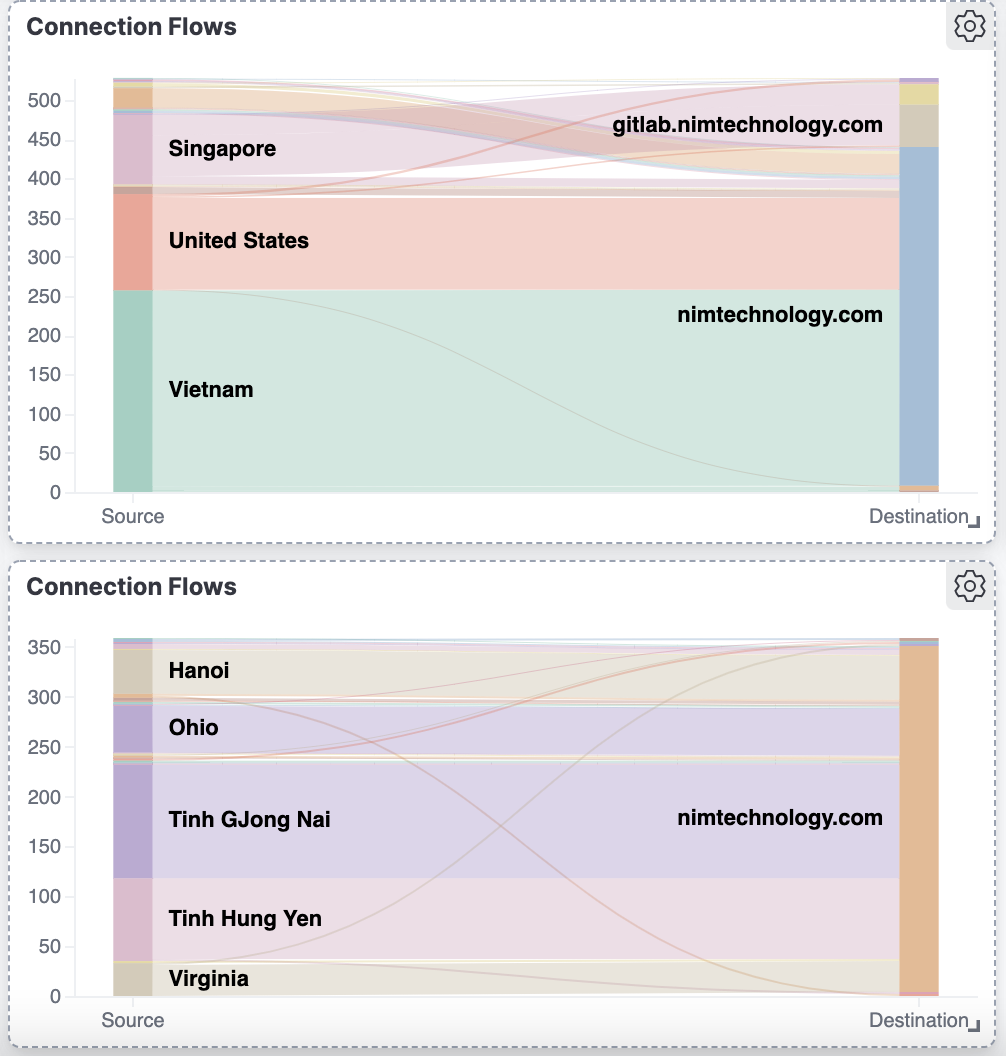
Mình có sử dụng geoip để đổi IP ra vị trí
Dưới này là docker-compose
version: '3.2'

services:
  logstash:
    image: docker.elastic.co/logstash/logstash:7.16.3
    volumes:
      - ./logstash/config/logstash.yml:/usr/share/logstash/config/logstash.yml:ro,z
      - ./logstash/pipeline:/usr/share/logstash/pipeline:ro,z
      - ./logstash/config/pipelines.yml:/usr/share/logstash/config/pipelines.yml:ro,z
    ports:
      - "5000:5000/udp"
    environment:
      LS_JAVA_OPTS: "-Xmx512m -Xms512m"
docker-compose up -d và chờ kết quả.
2) Practise
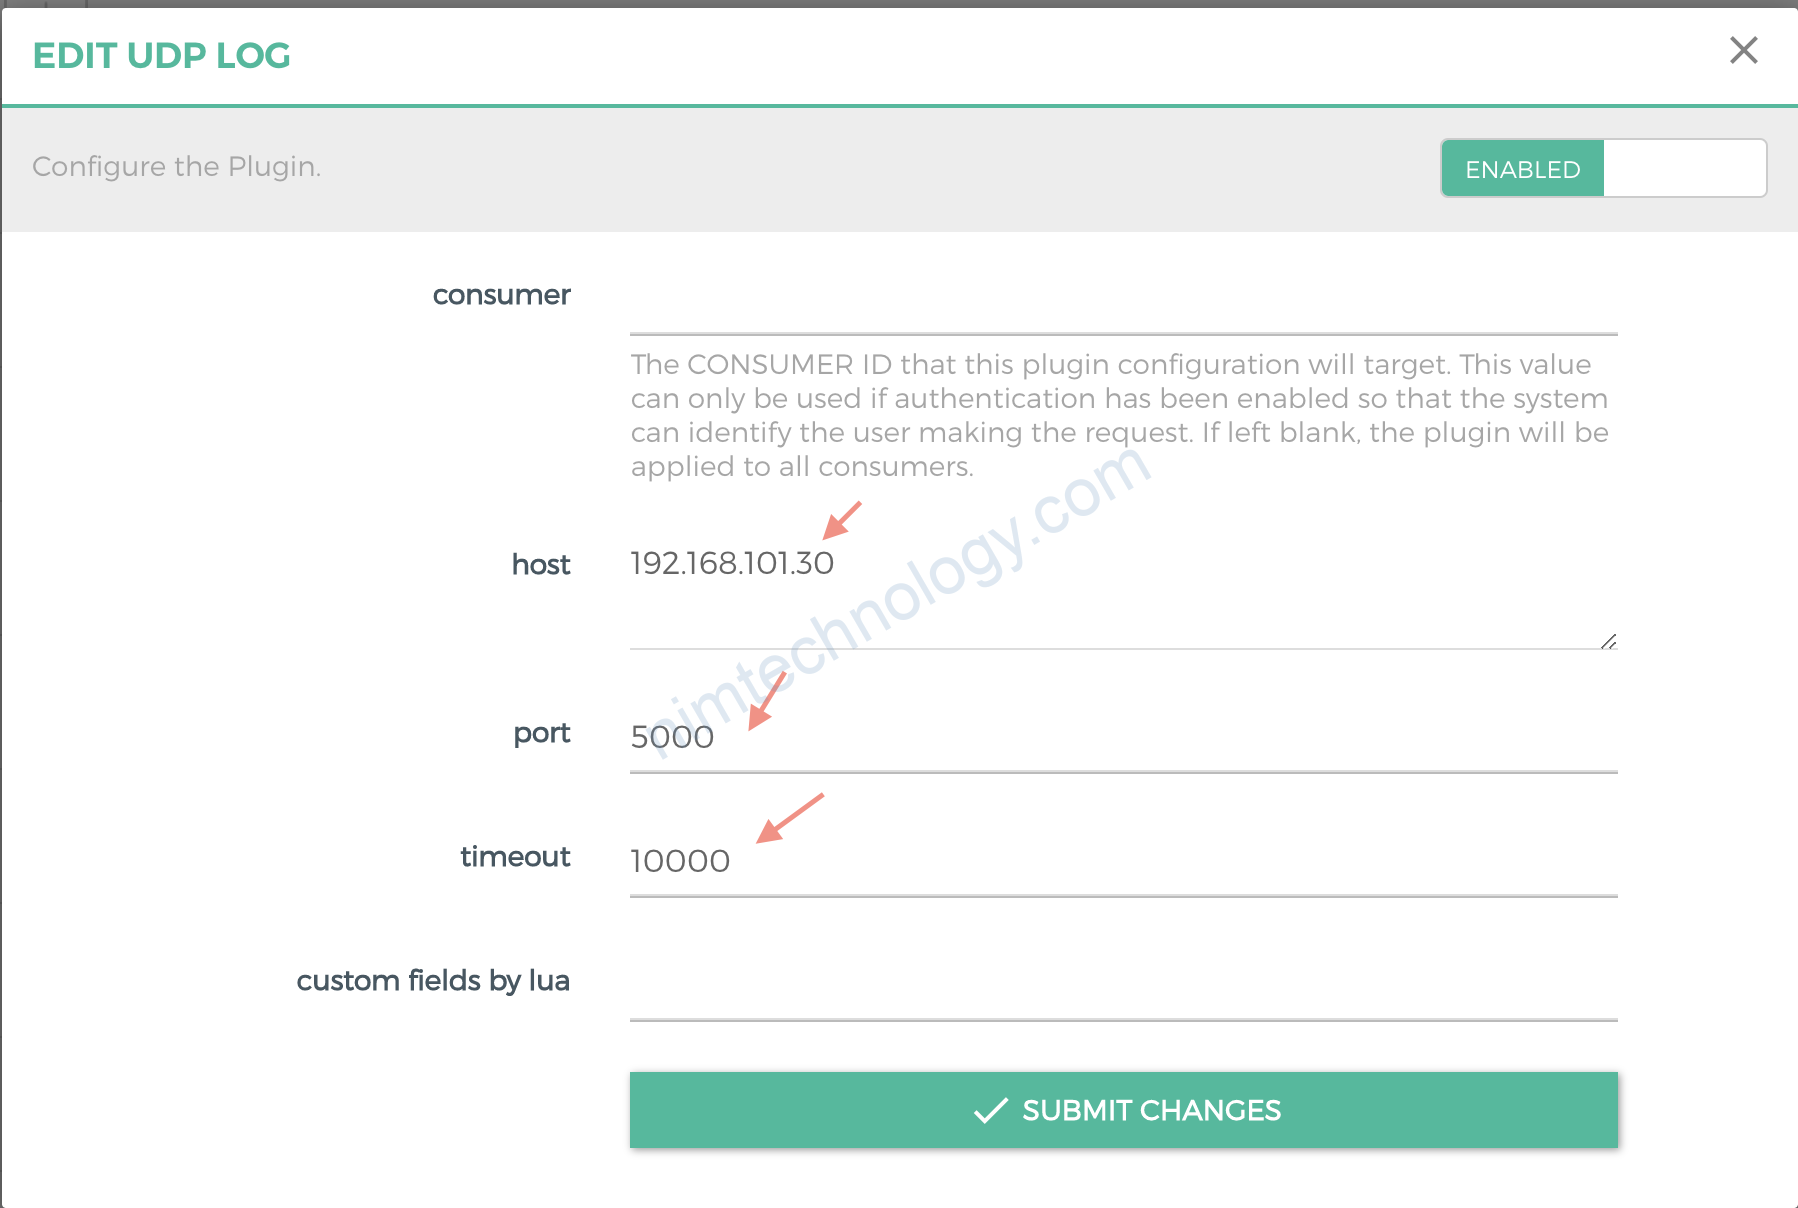
2.1) Config Kong to send UDP to Logstash

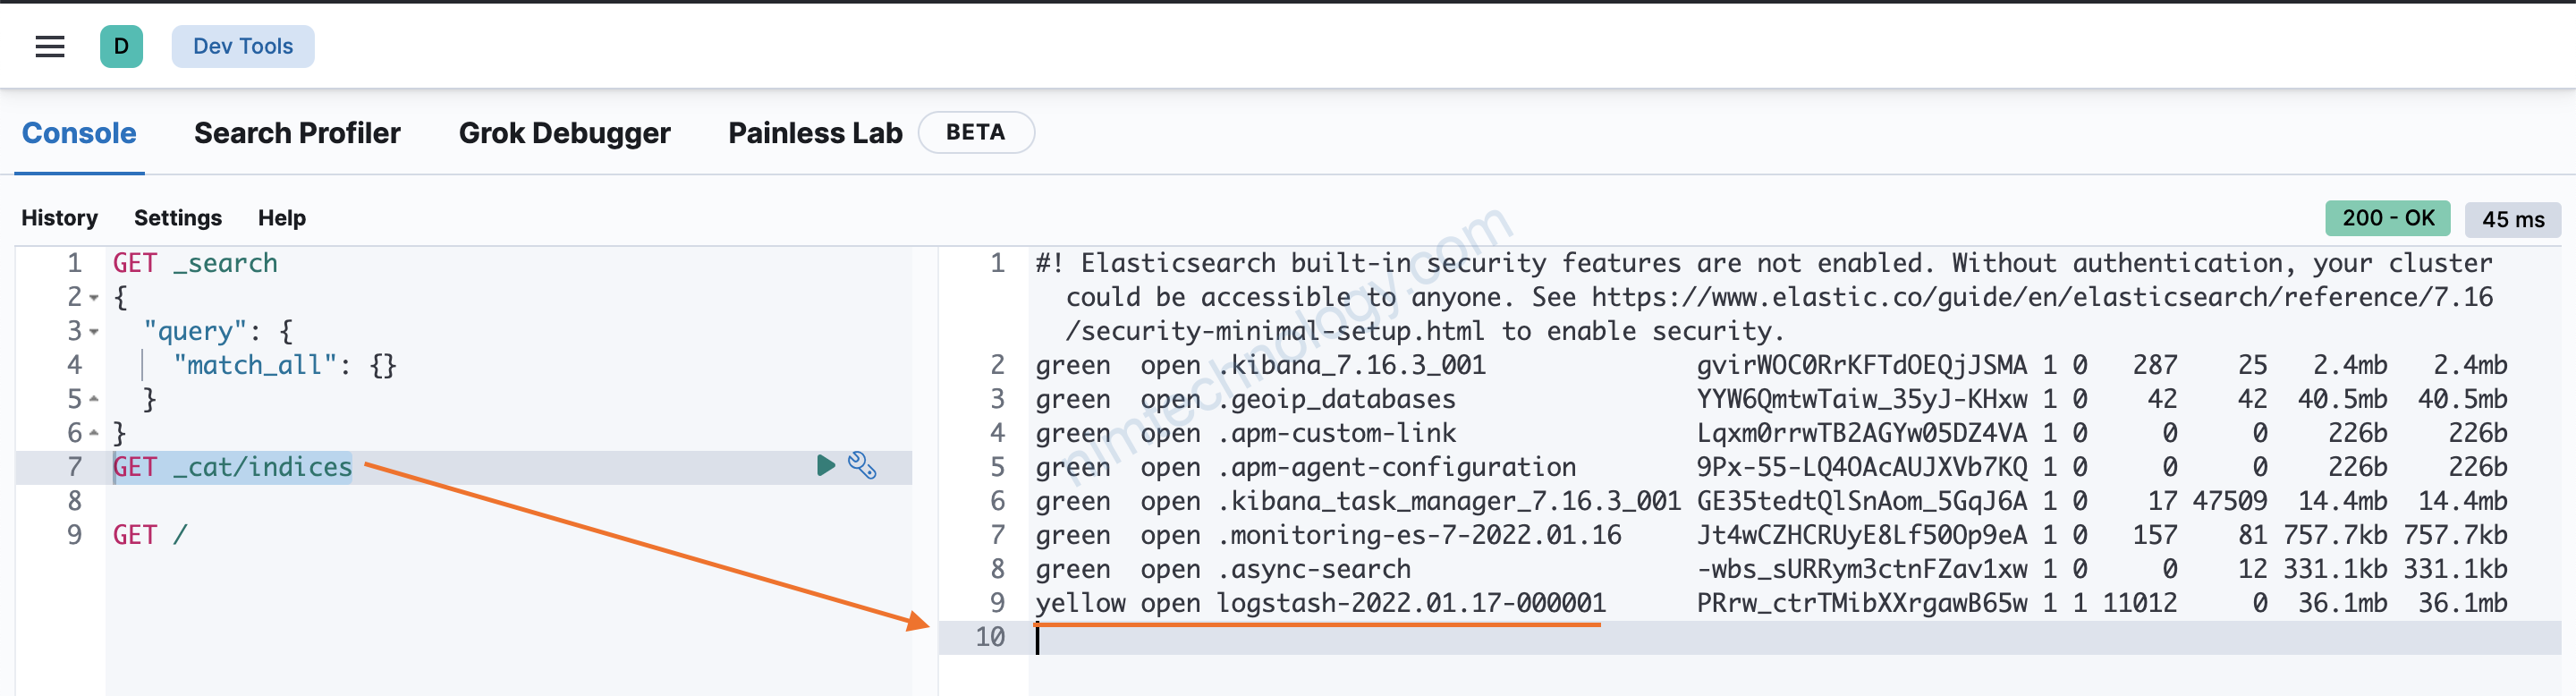
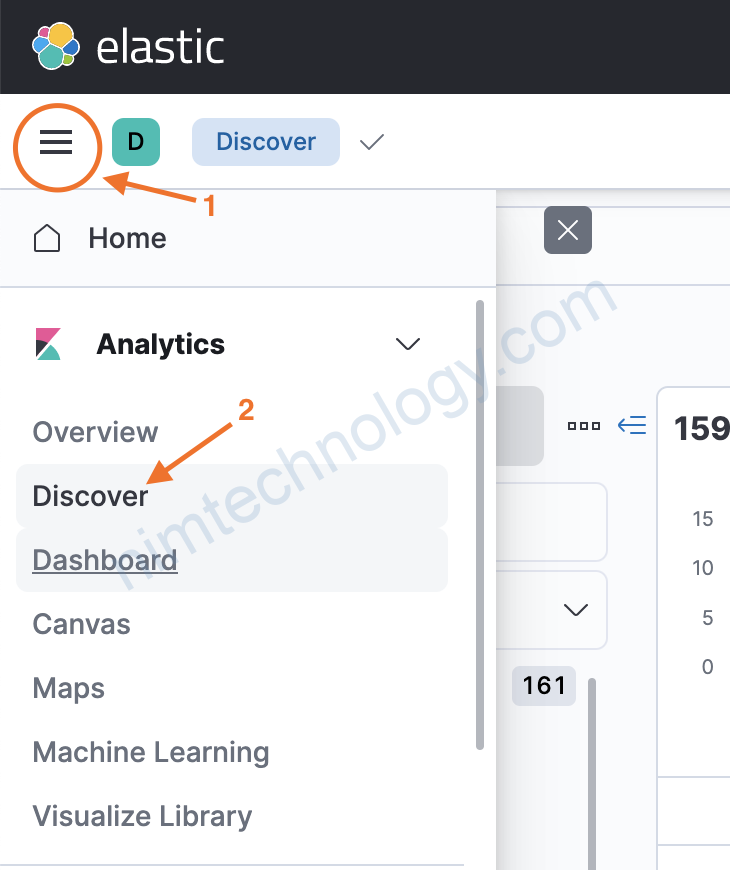
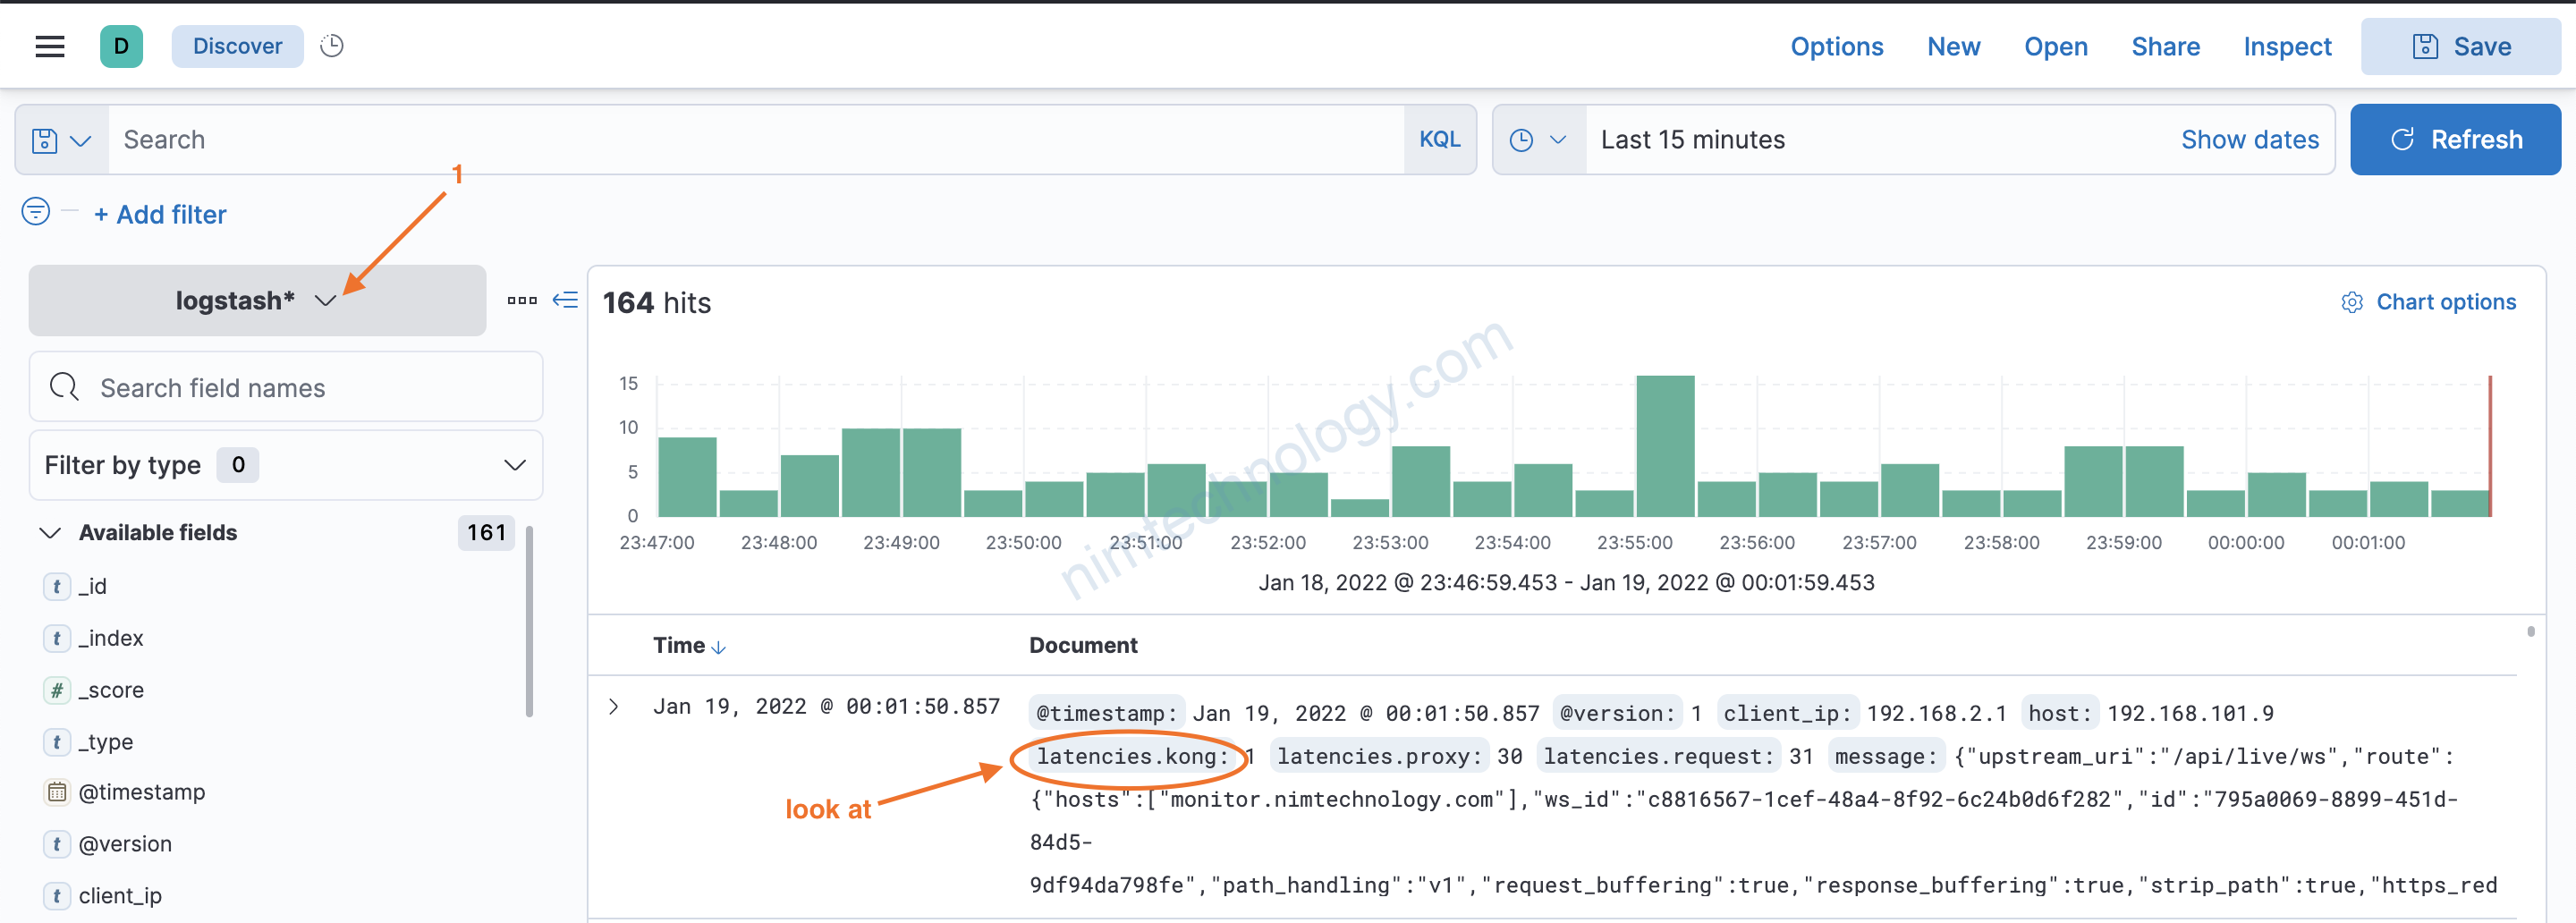
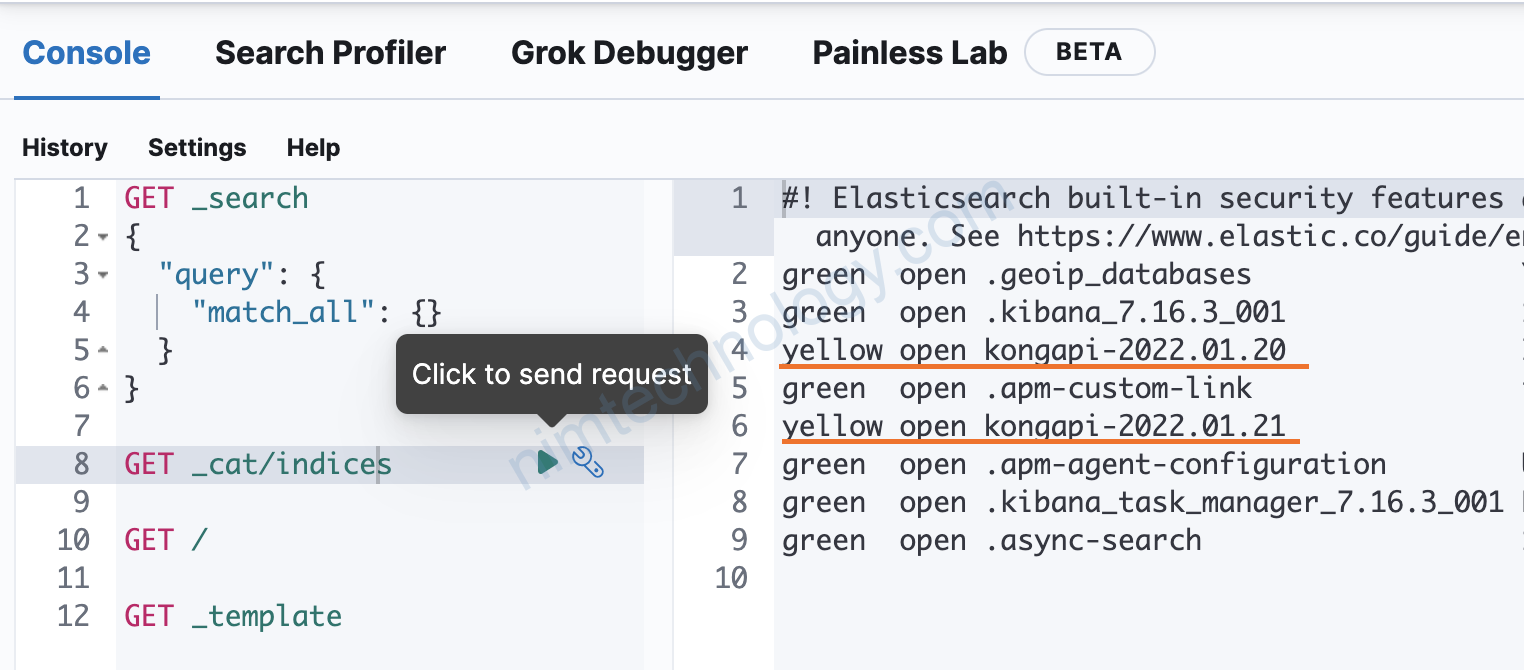
Giờ trờ lại giao diện của kibana kiểm tra
2.2) Recheck result
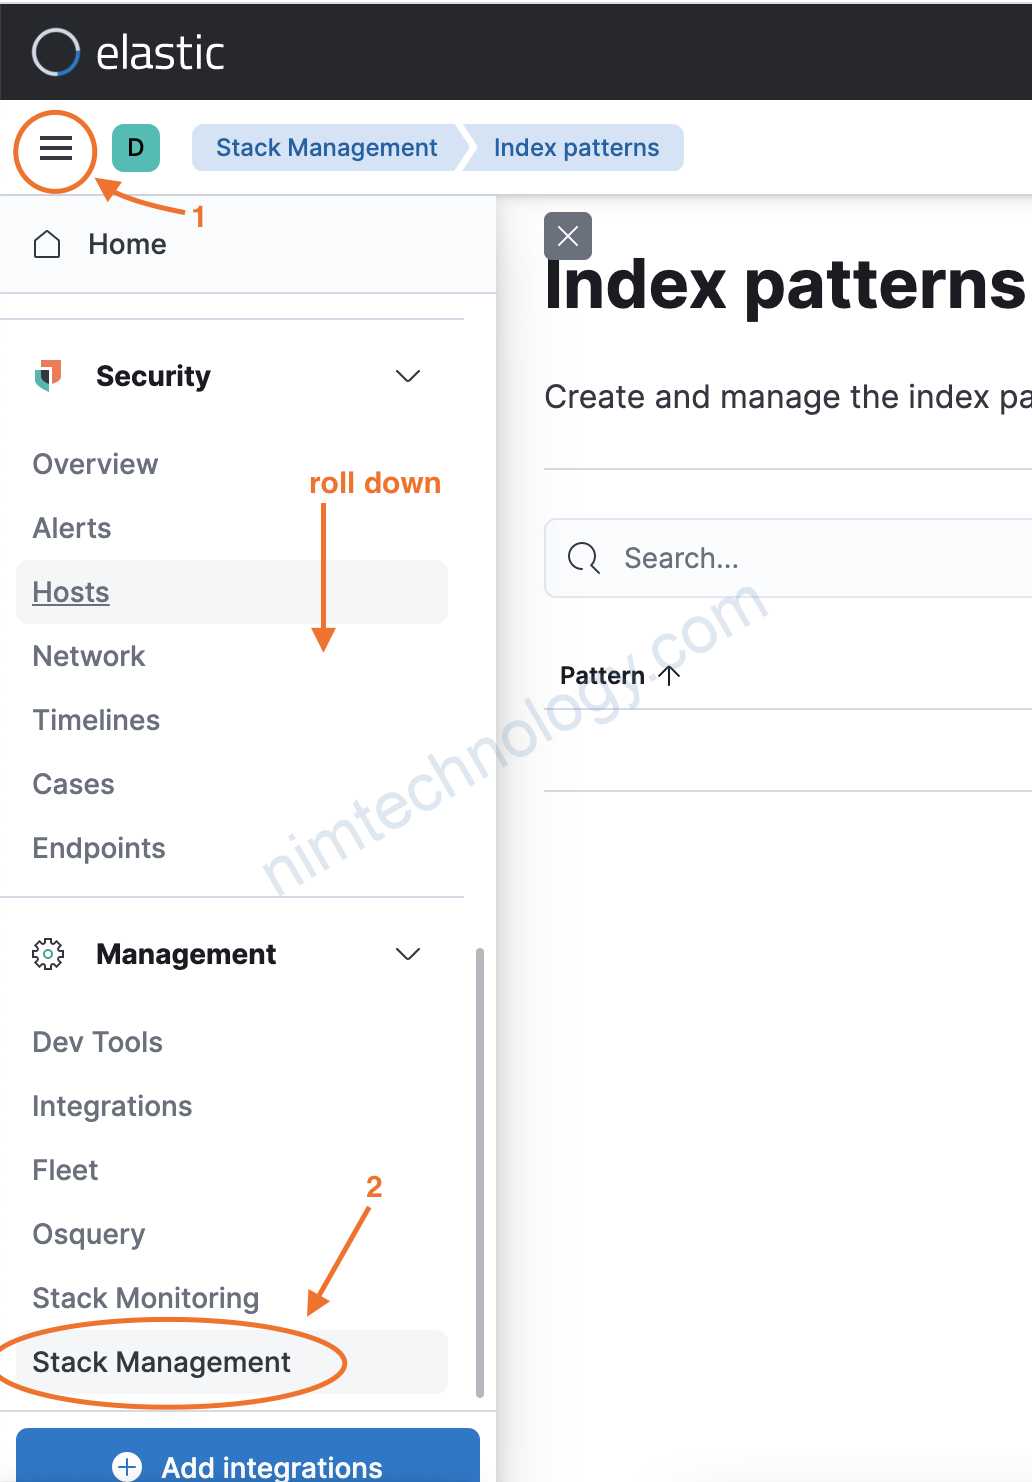
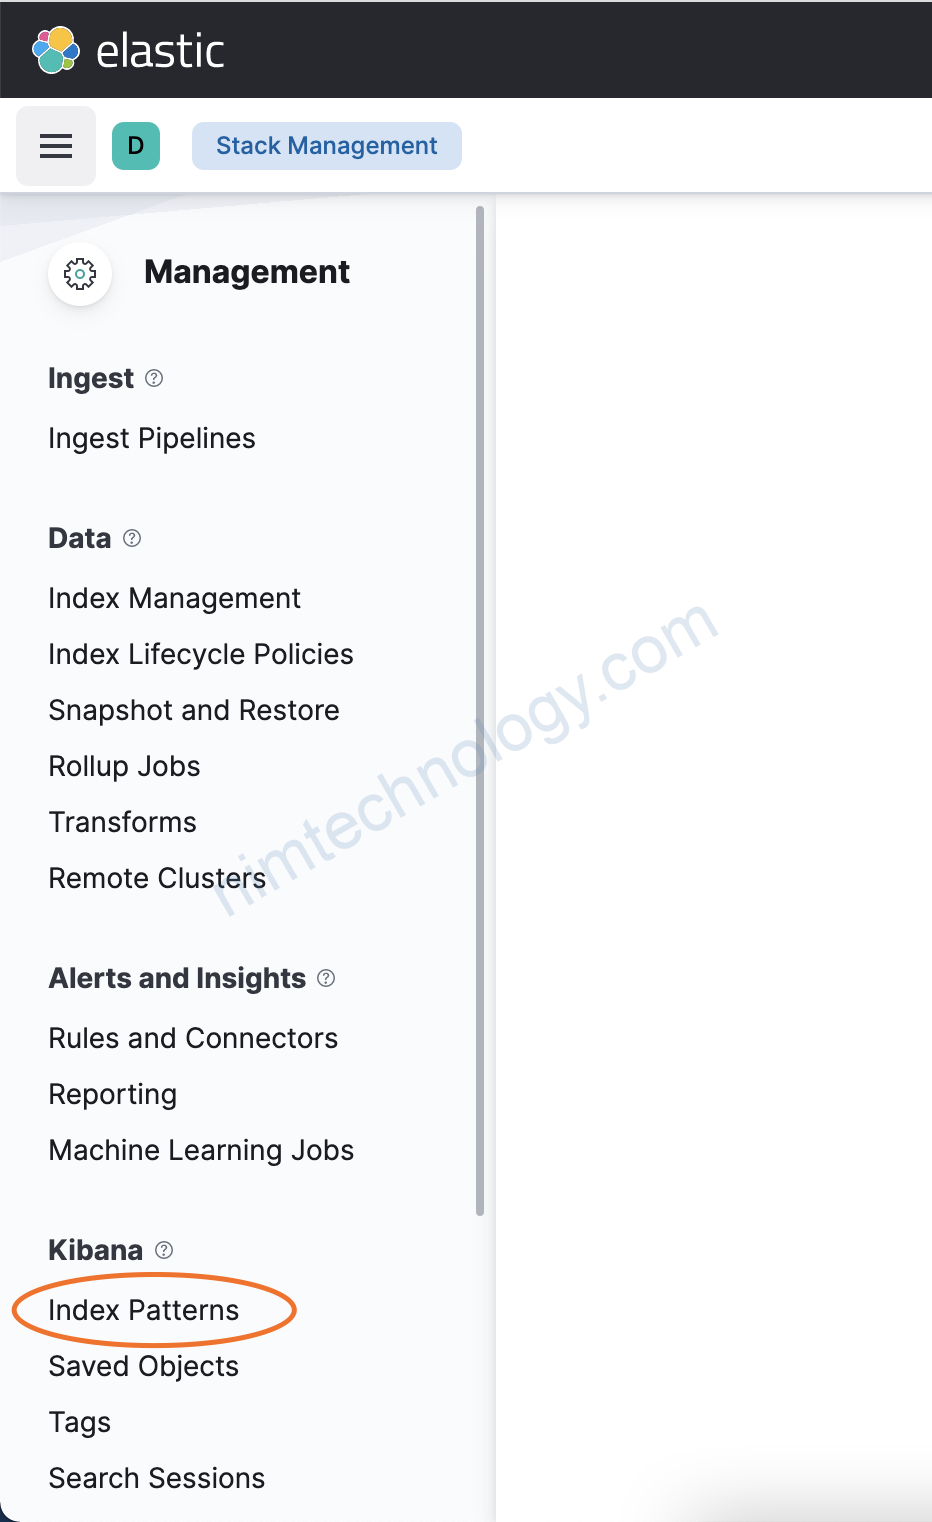
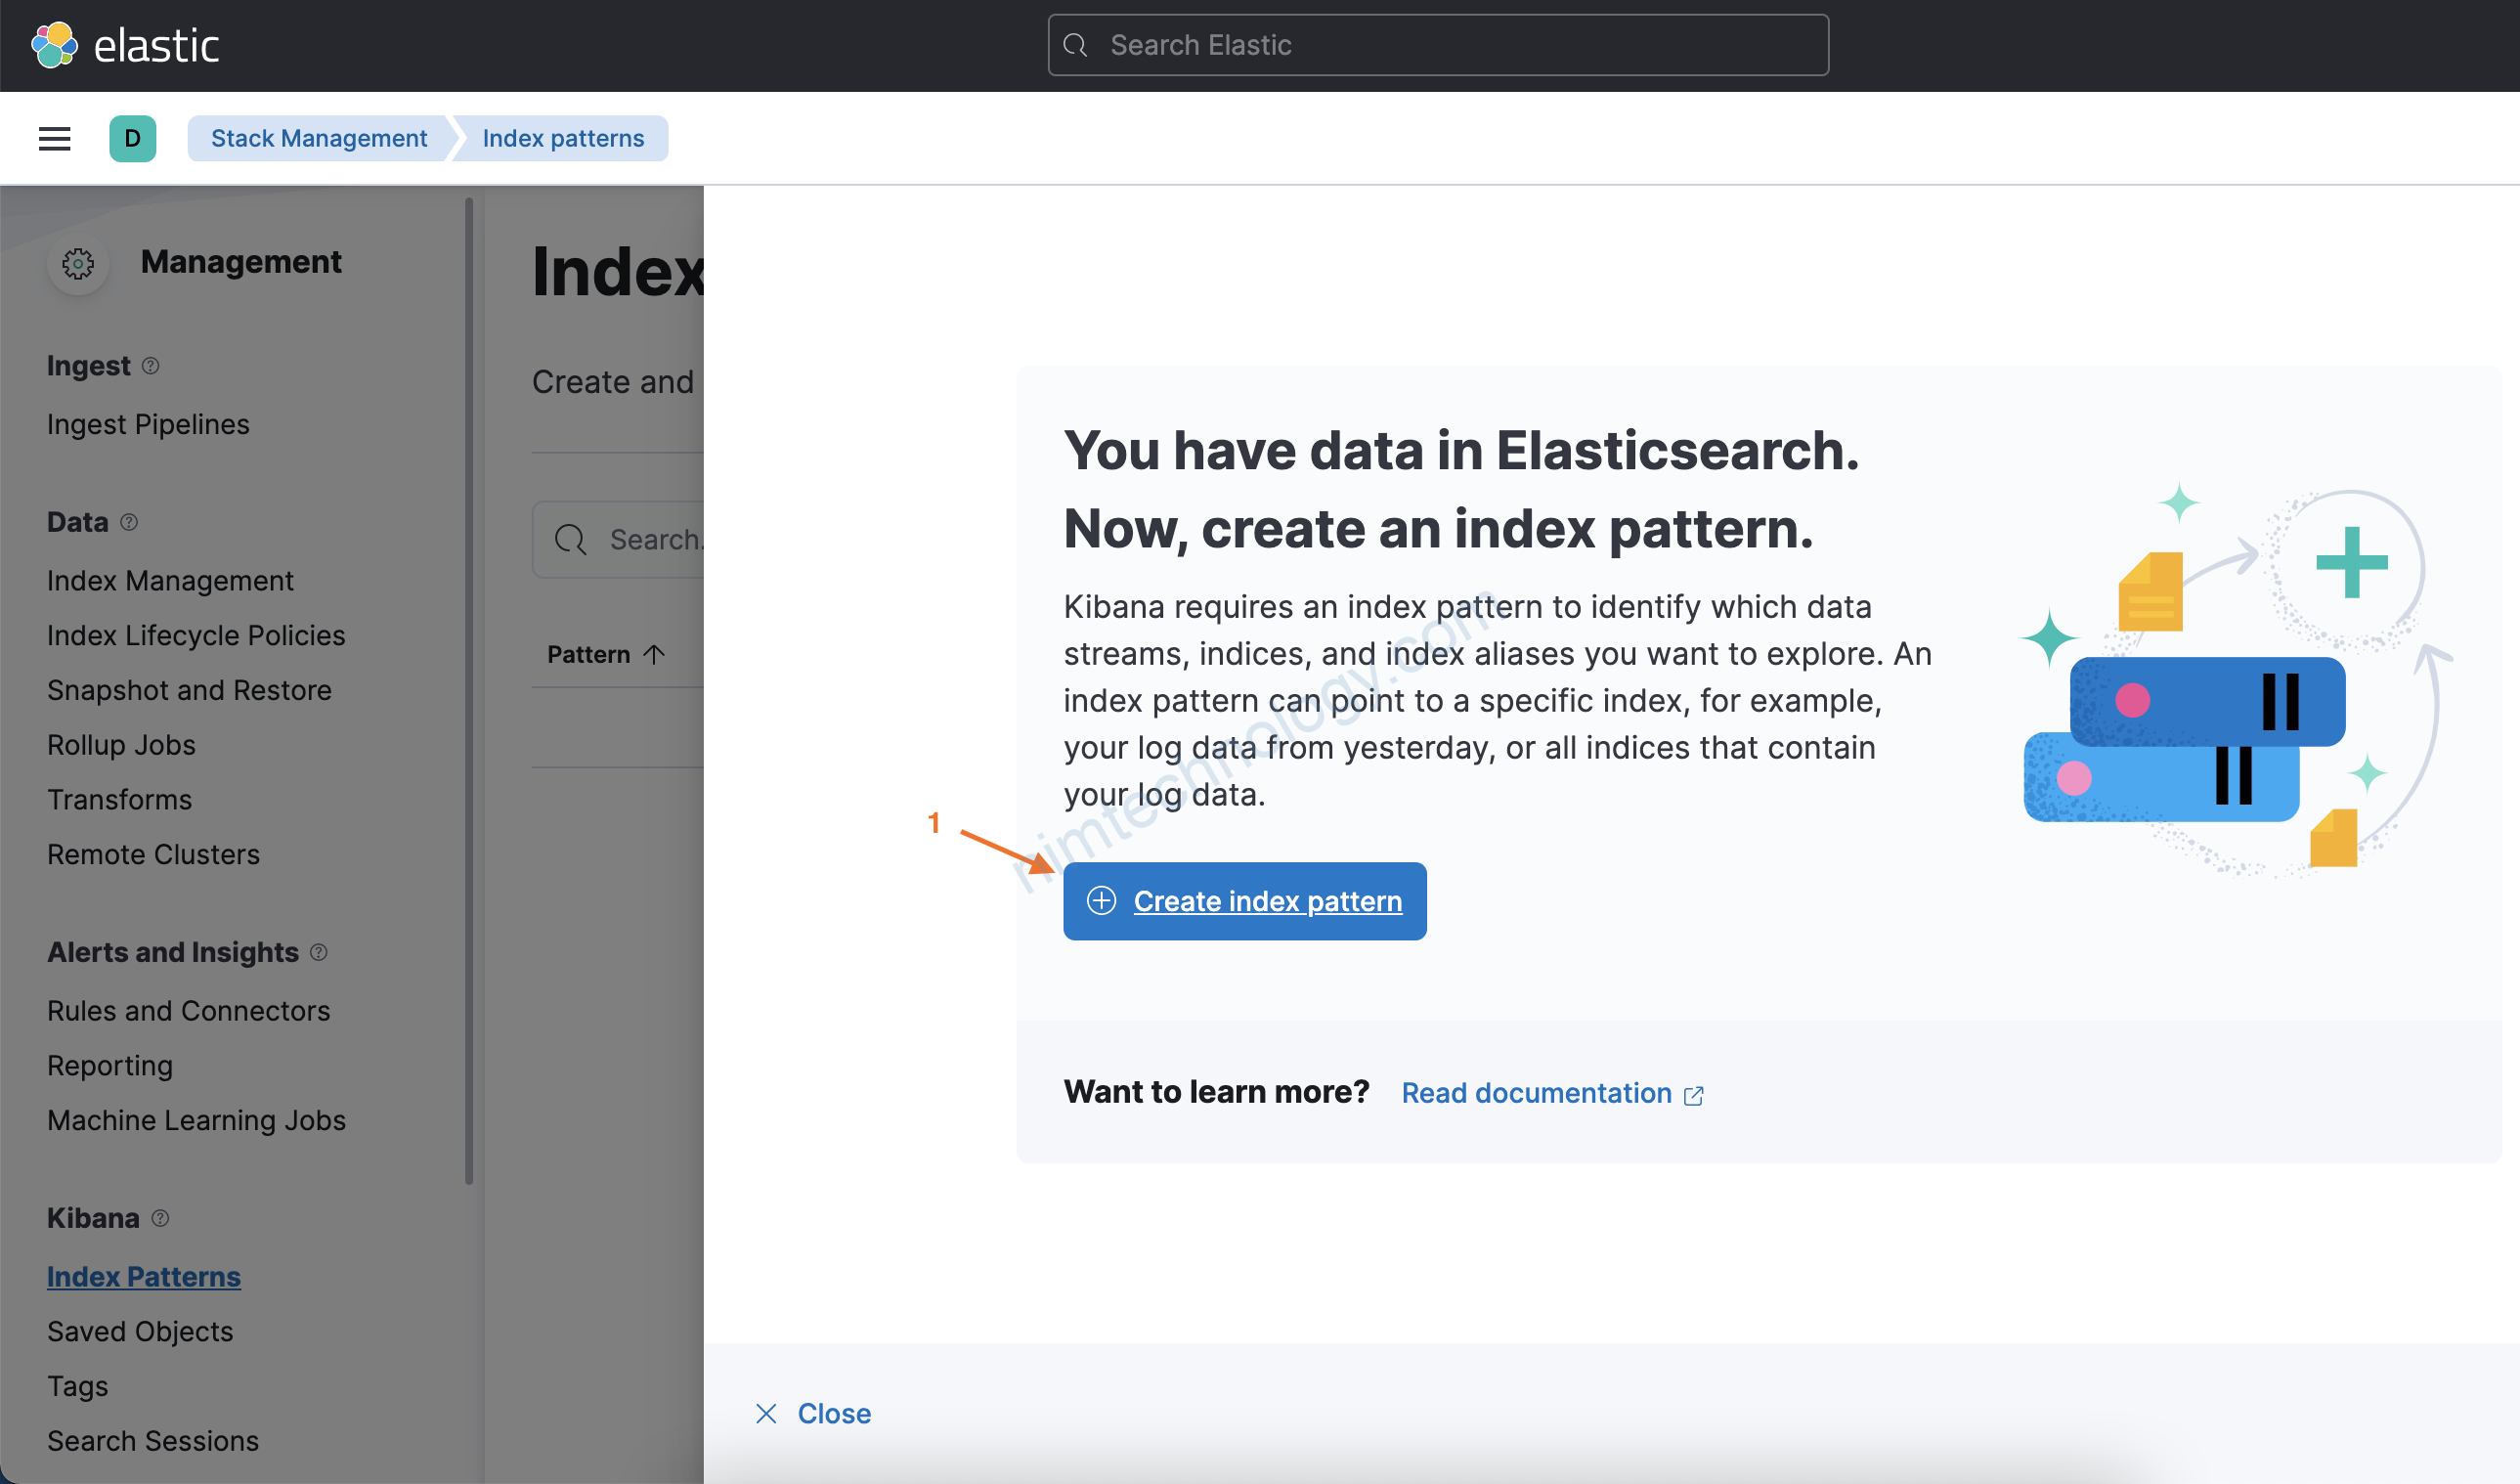
Để kiểm tra kĩ hơn chúng ta cần tạo Index patterns
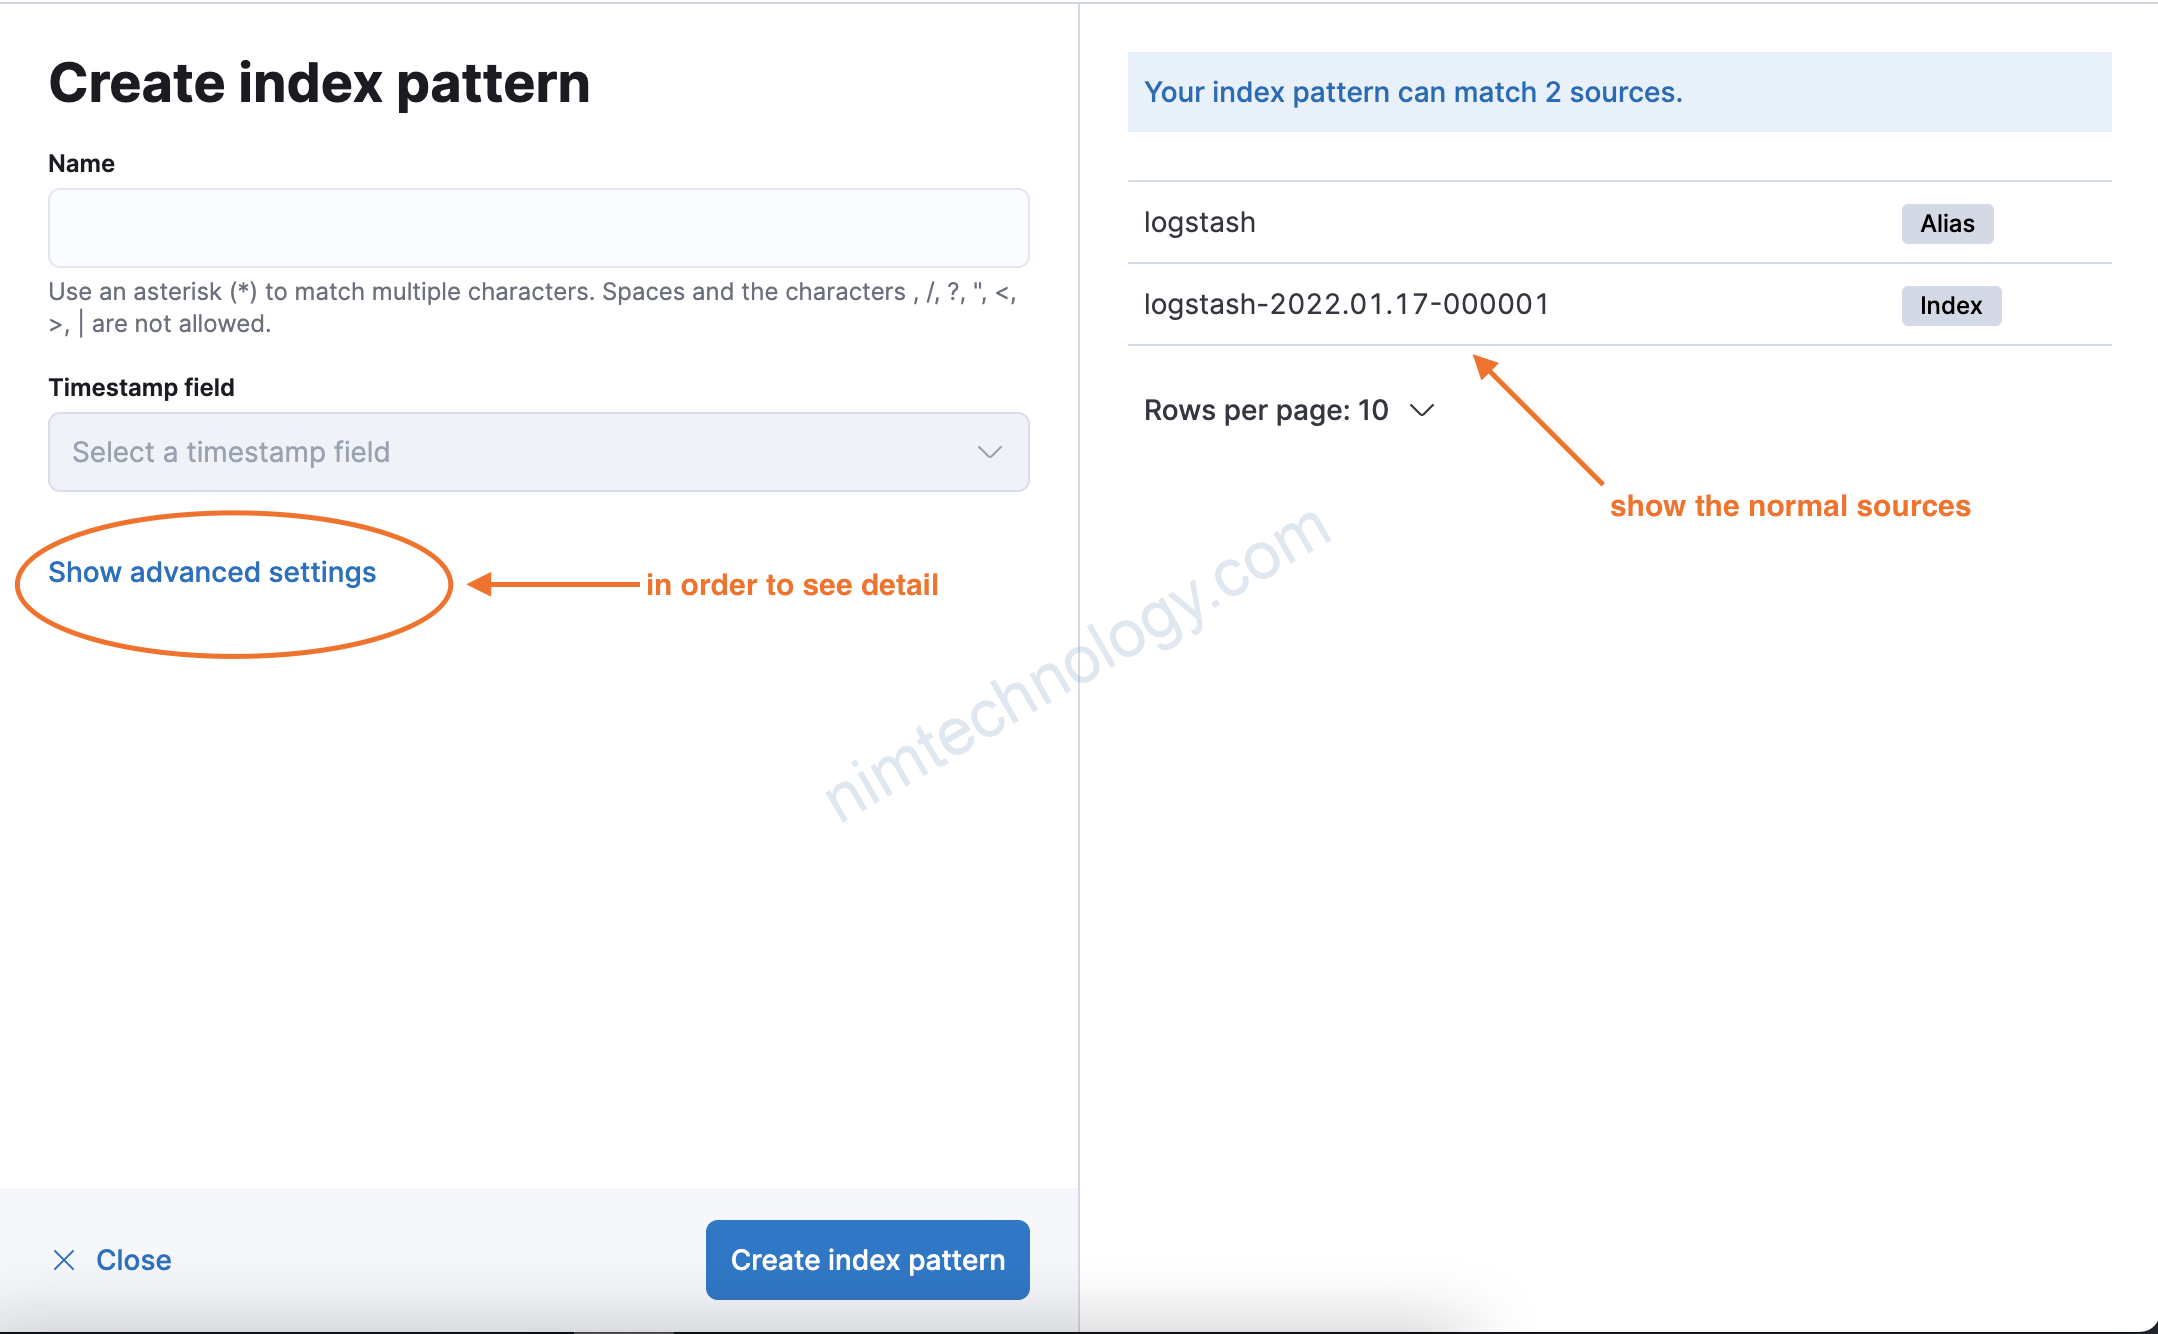
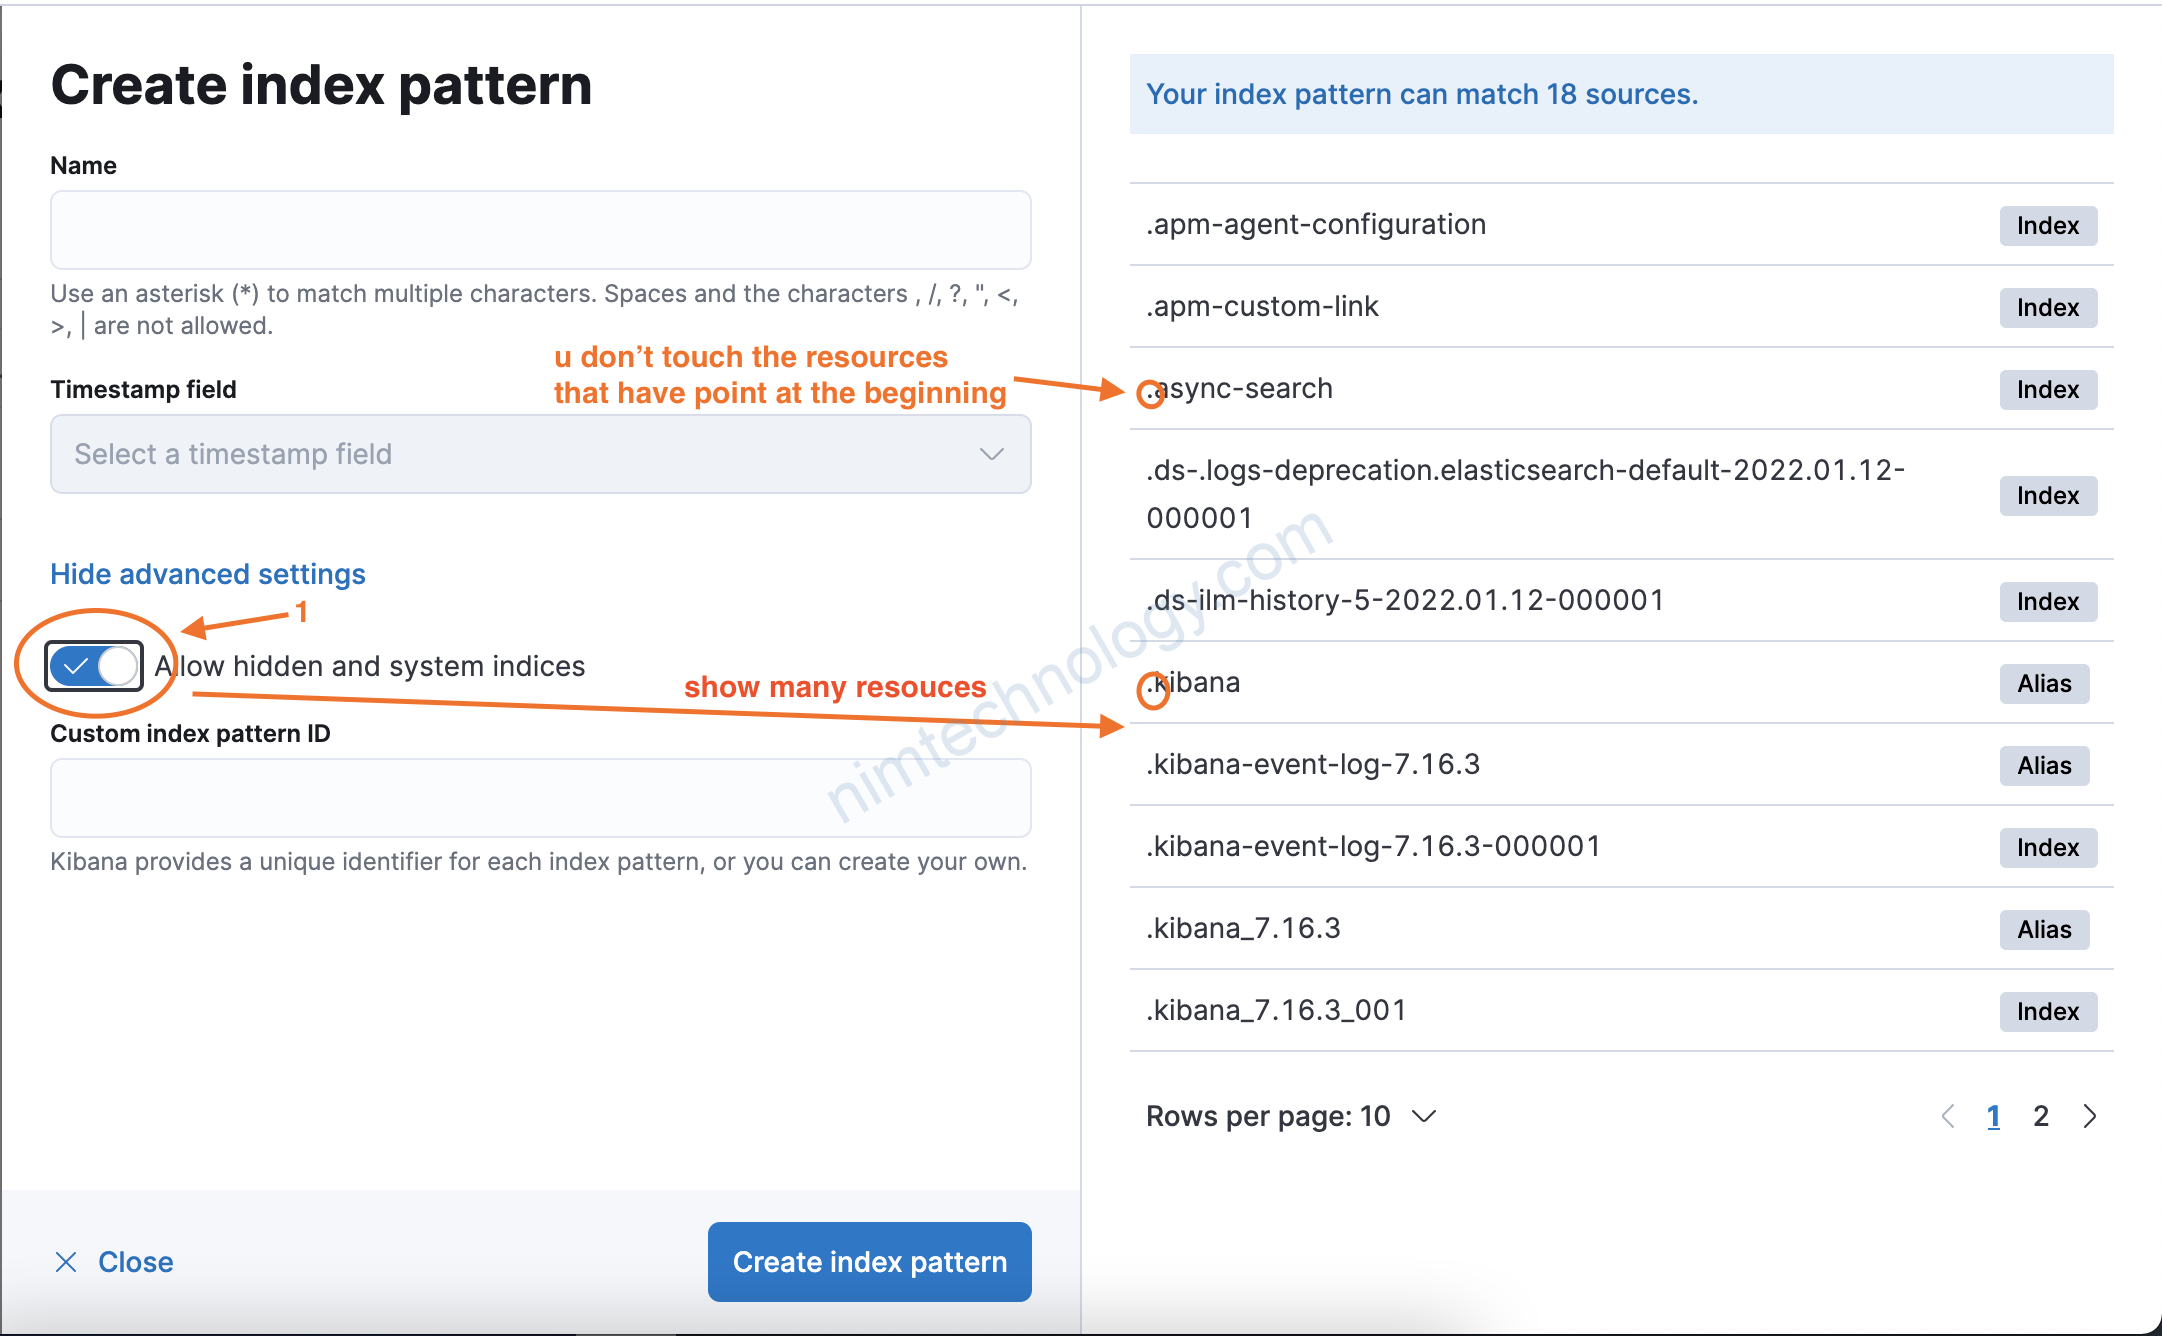
việc show advance chỉ để cho dui thôi.
chứ bạn ko nên đúng vào các resource có dấu chấm ở đầu nhé
Vì đó là các resources hệ thống
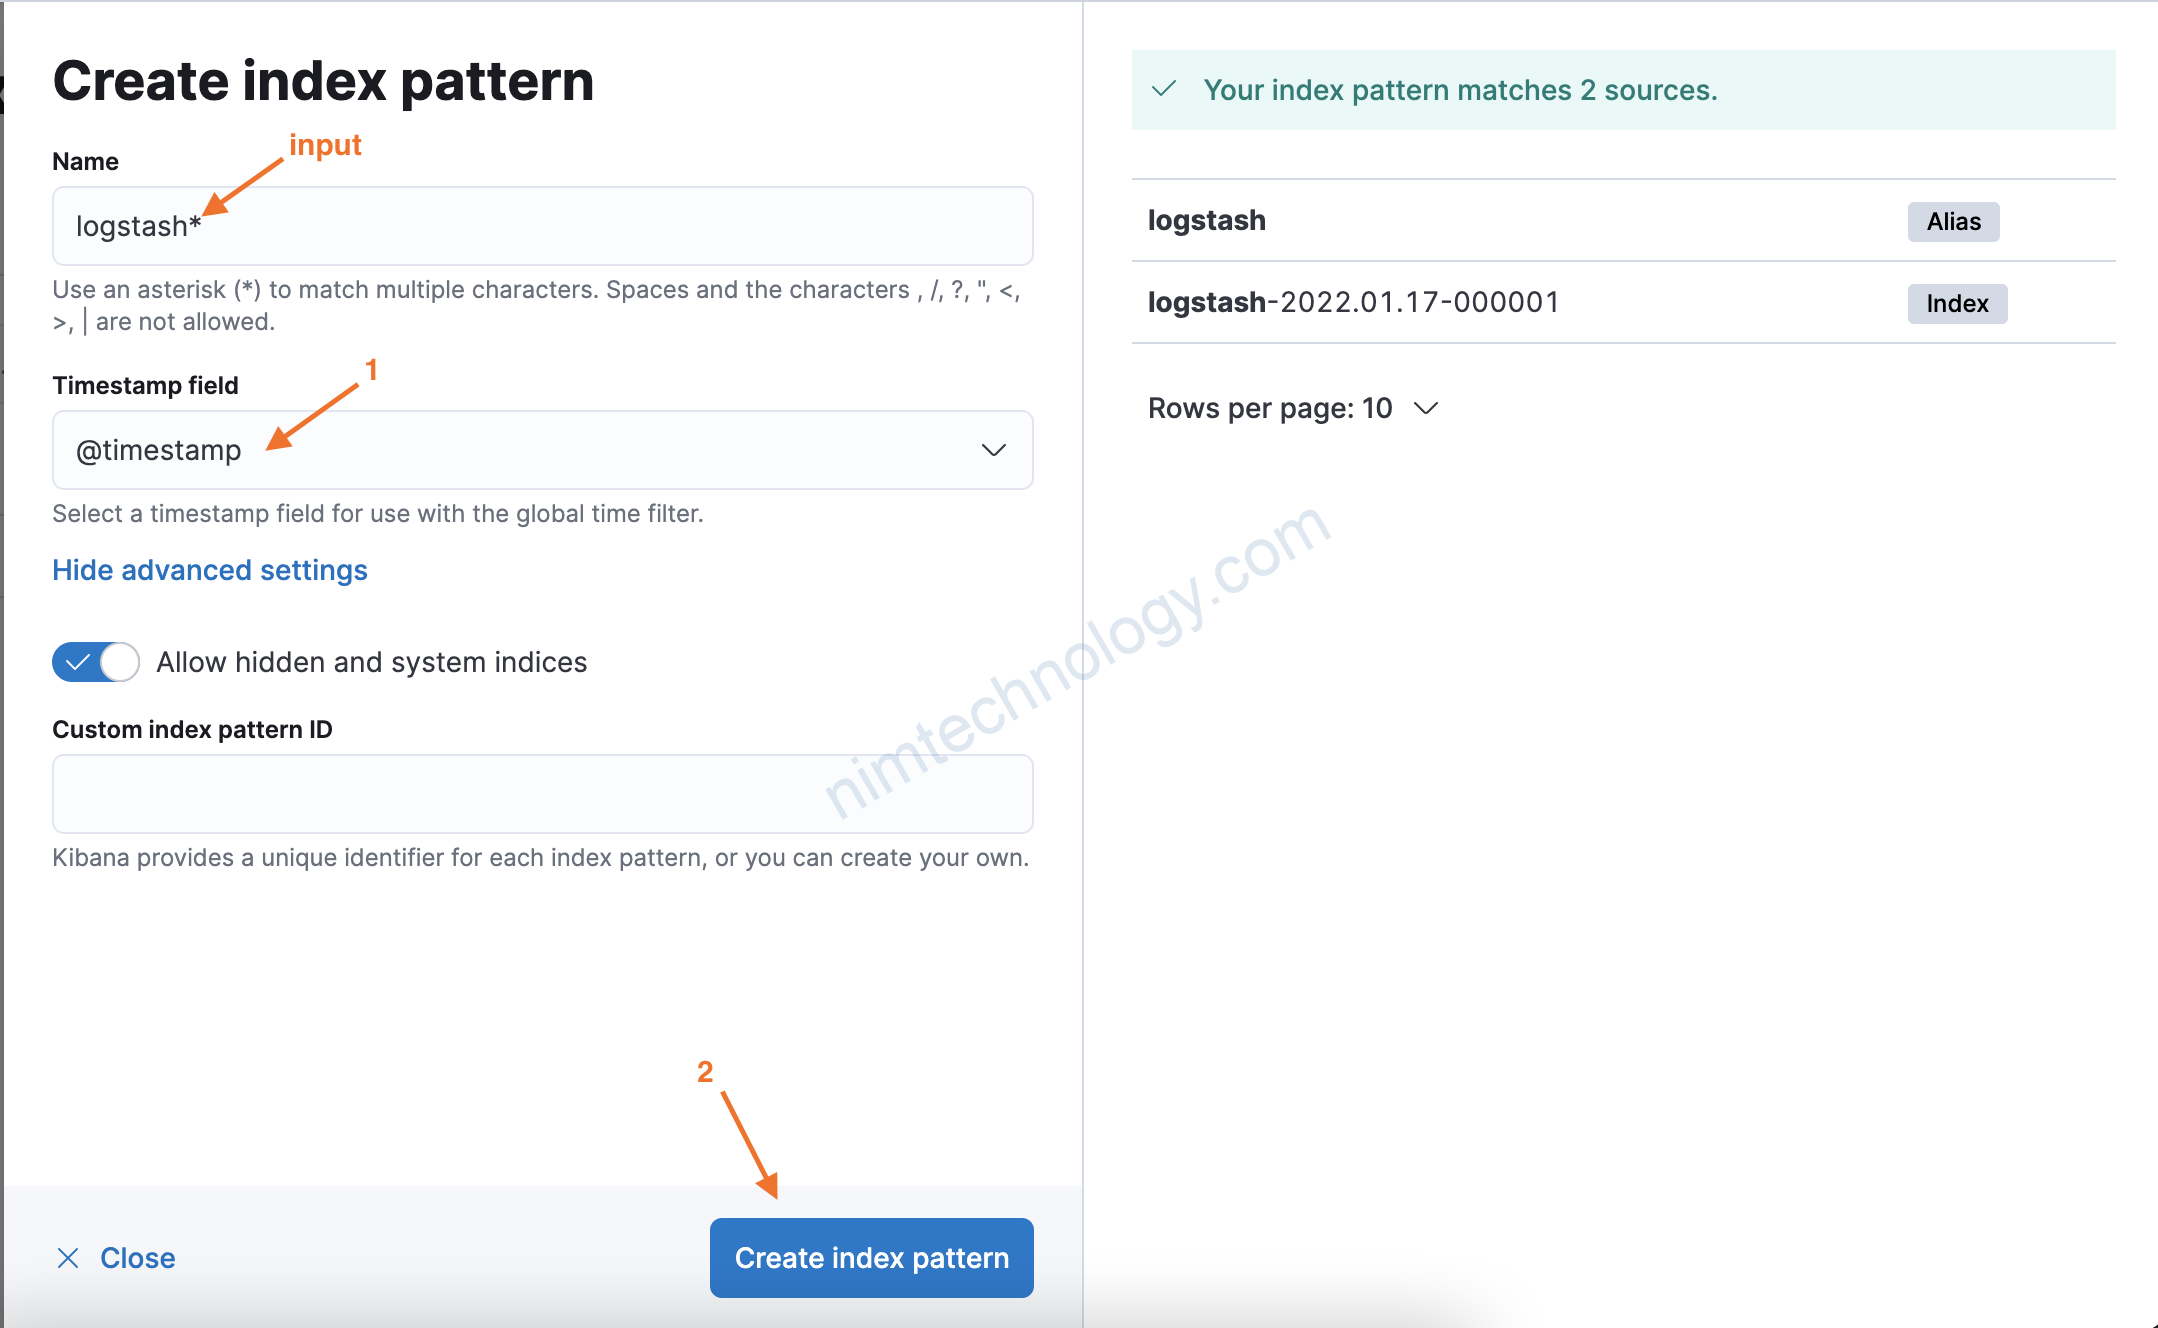
2.3) Custome index.
Như ở trên bạn sẽ thấy index sẽ là logstash*
và thường chúng ta hay tạo index theo từng loại server
# See https://www.elastic.co/guide/en/logstash/current/configuration-file-structure.html for detail

# Input is from UDP port 5000
input {
  udp {
    port => "5000"
  }
}

# Original Kong log is on JSON format and will be send to elasticsearch in field “message”.
# So we need to take the json from field “message”, and read the original format.
filter {
  json {
    source => "message"
    add_tag => ["kong"]
  }

#  mutate {
#     remove_field => [ "message" ]
#  }

  geoip {
    source => "client_ip"
  }
}

## Add your filters / logstash plugins configuration here

output {
  elasticsearch {
    hosts => "<IP-Elastic>:9200"
    index => "kongapi-%{+YYYY.MM.dd}"
  }
}
Bạn thấy là chúng ta sẽ để như này: index => "kongapi-%{+YYYY.MM.dd}"
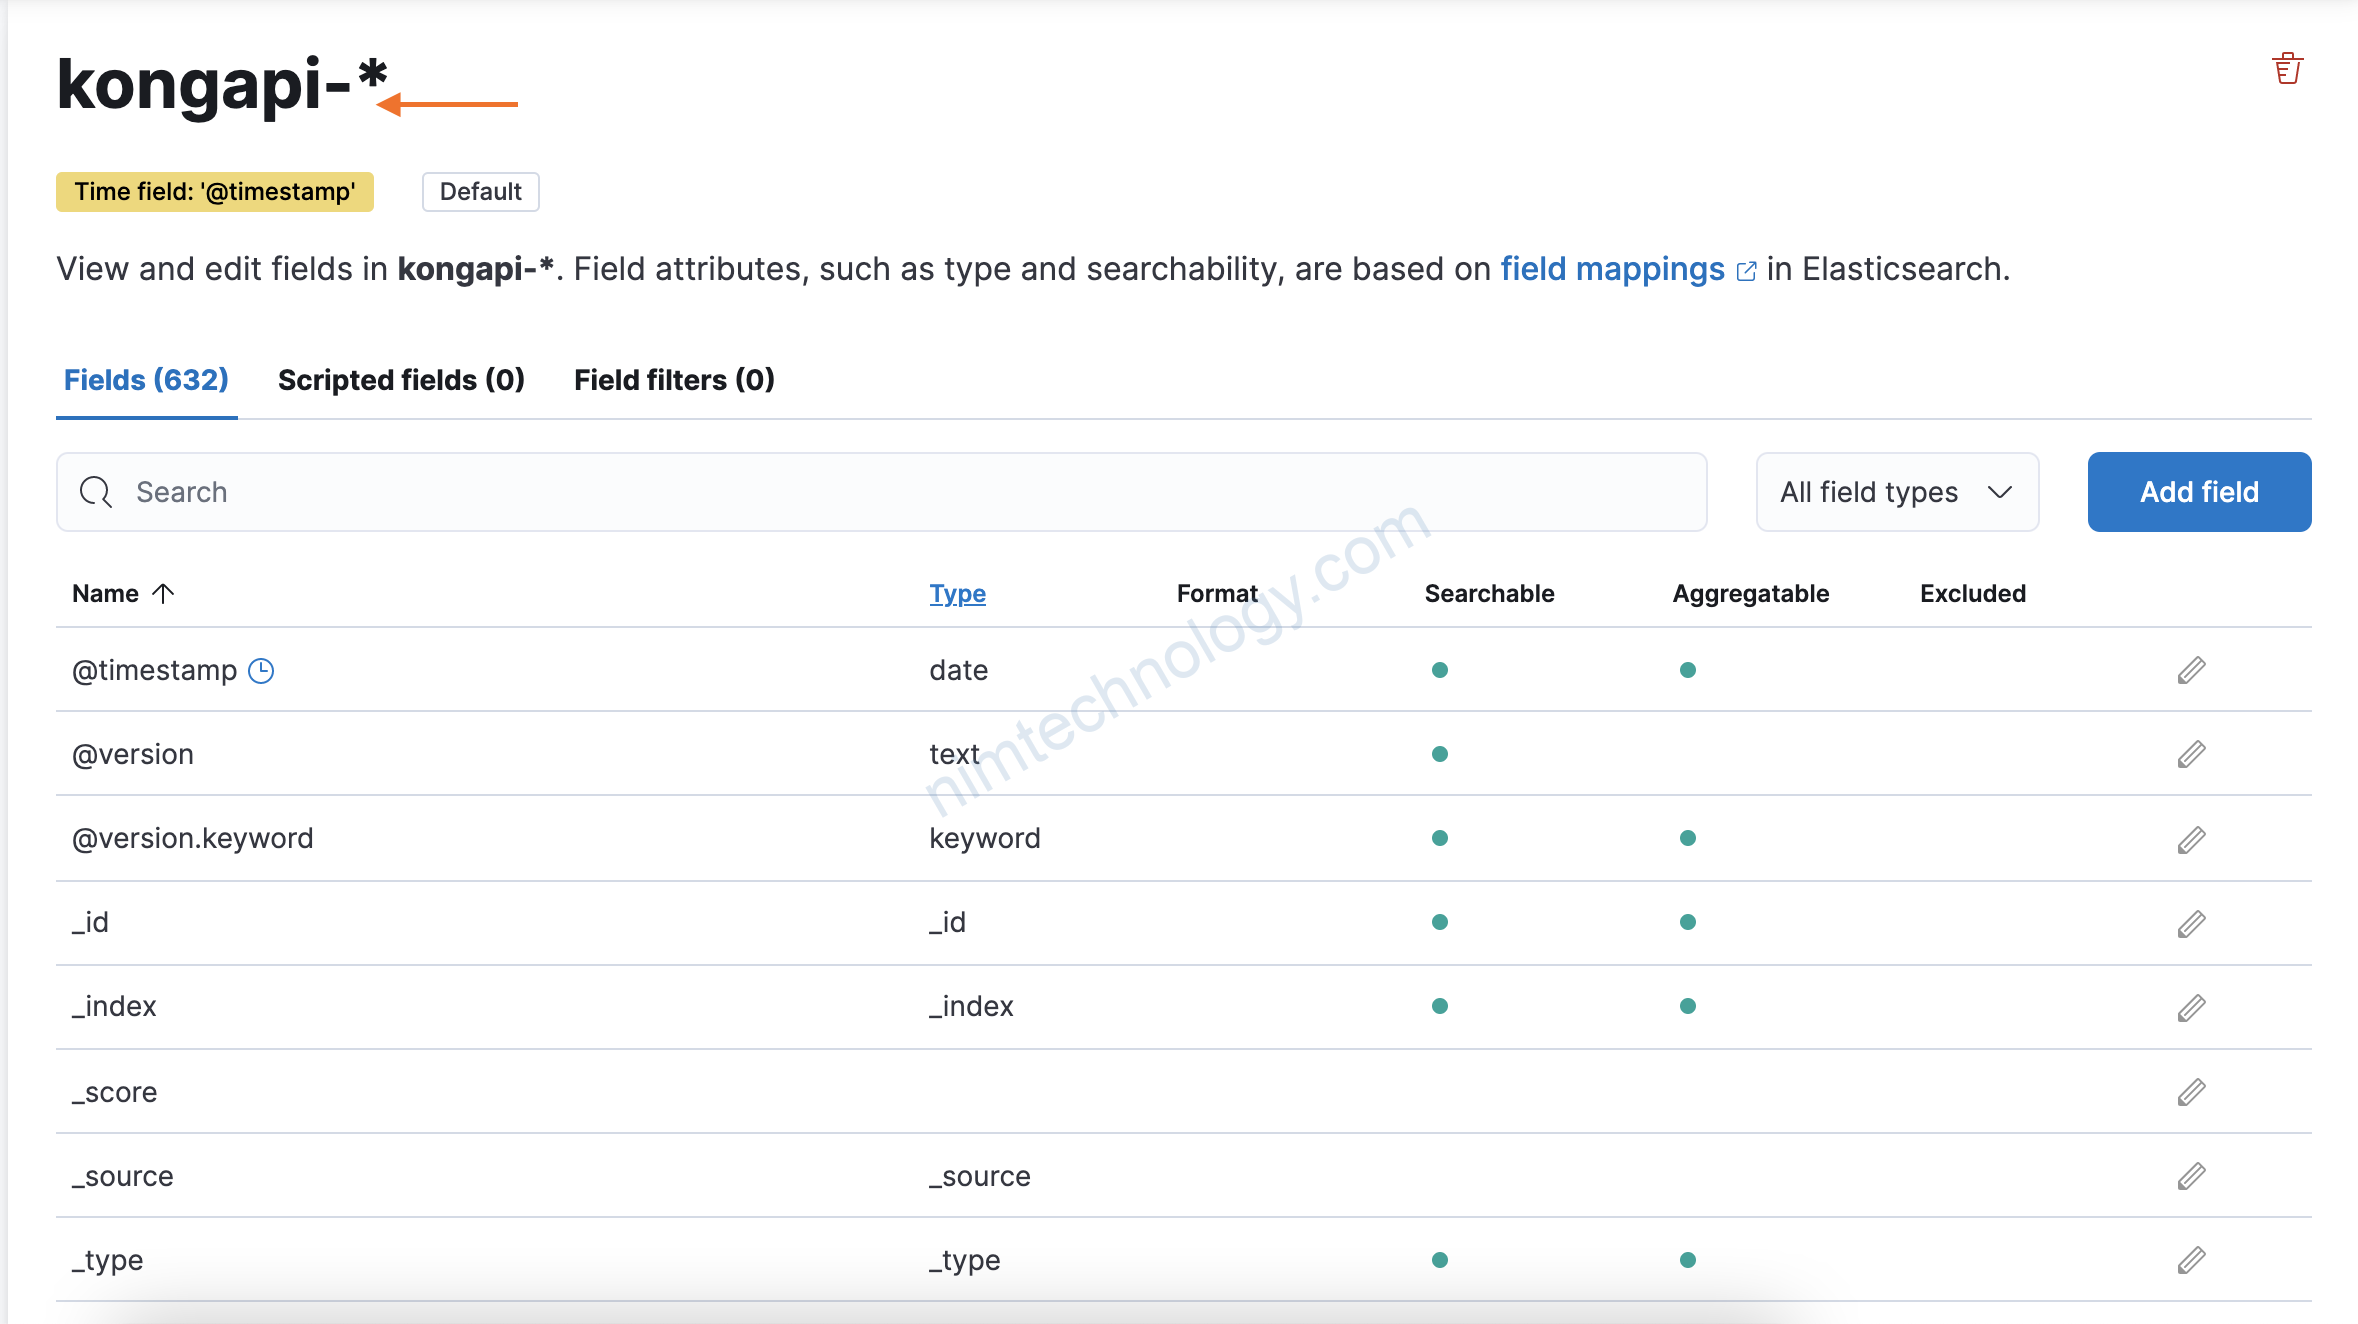
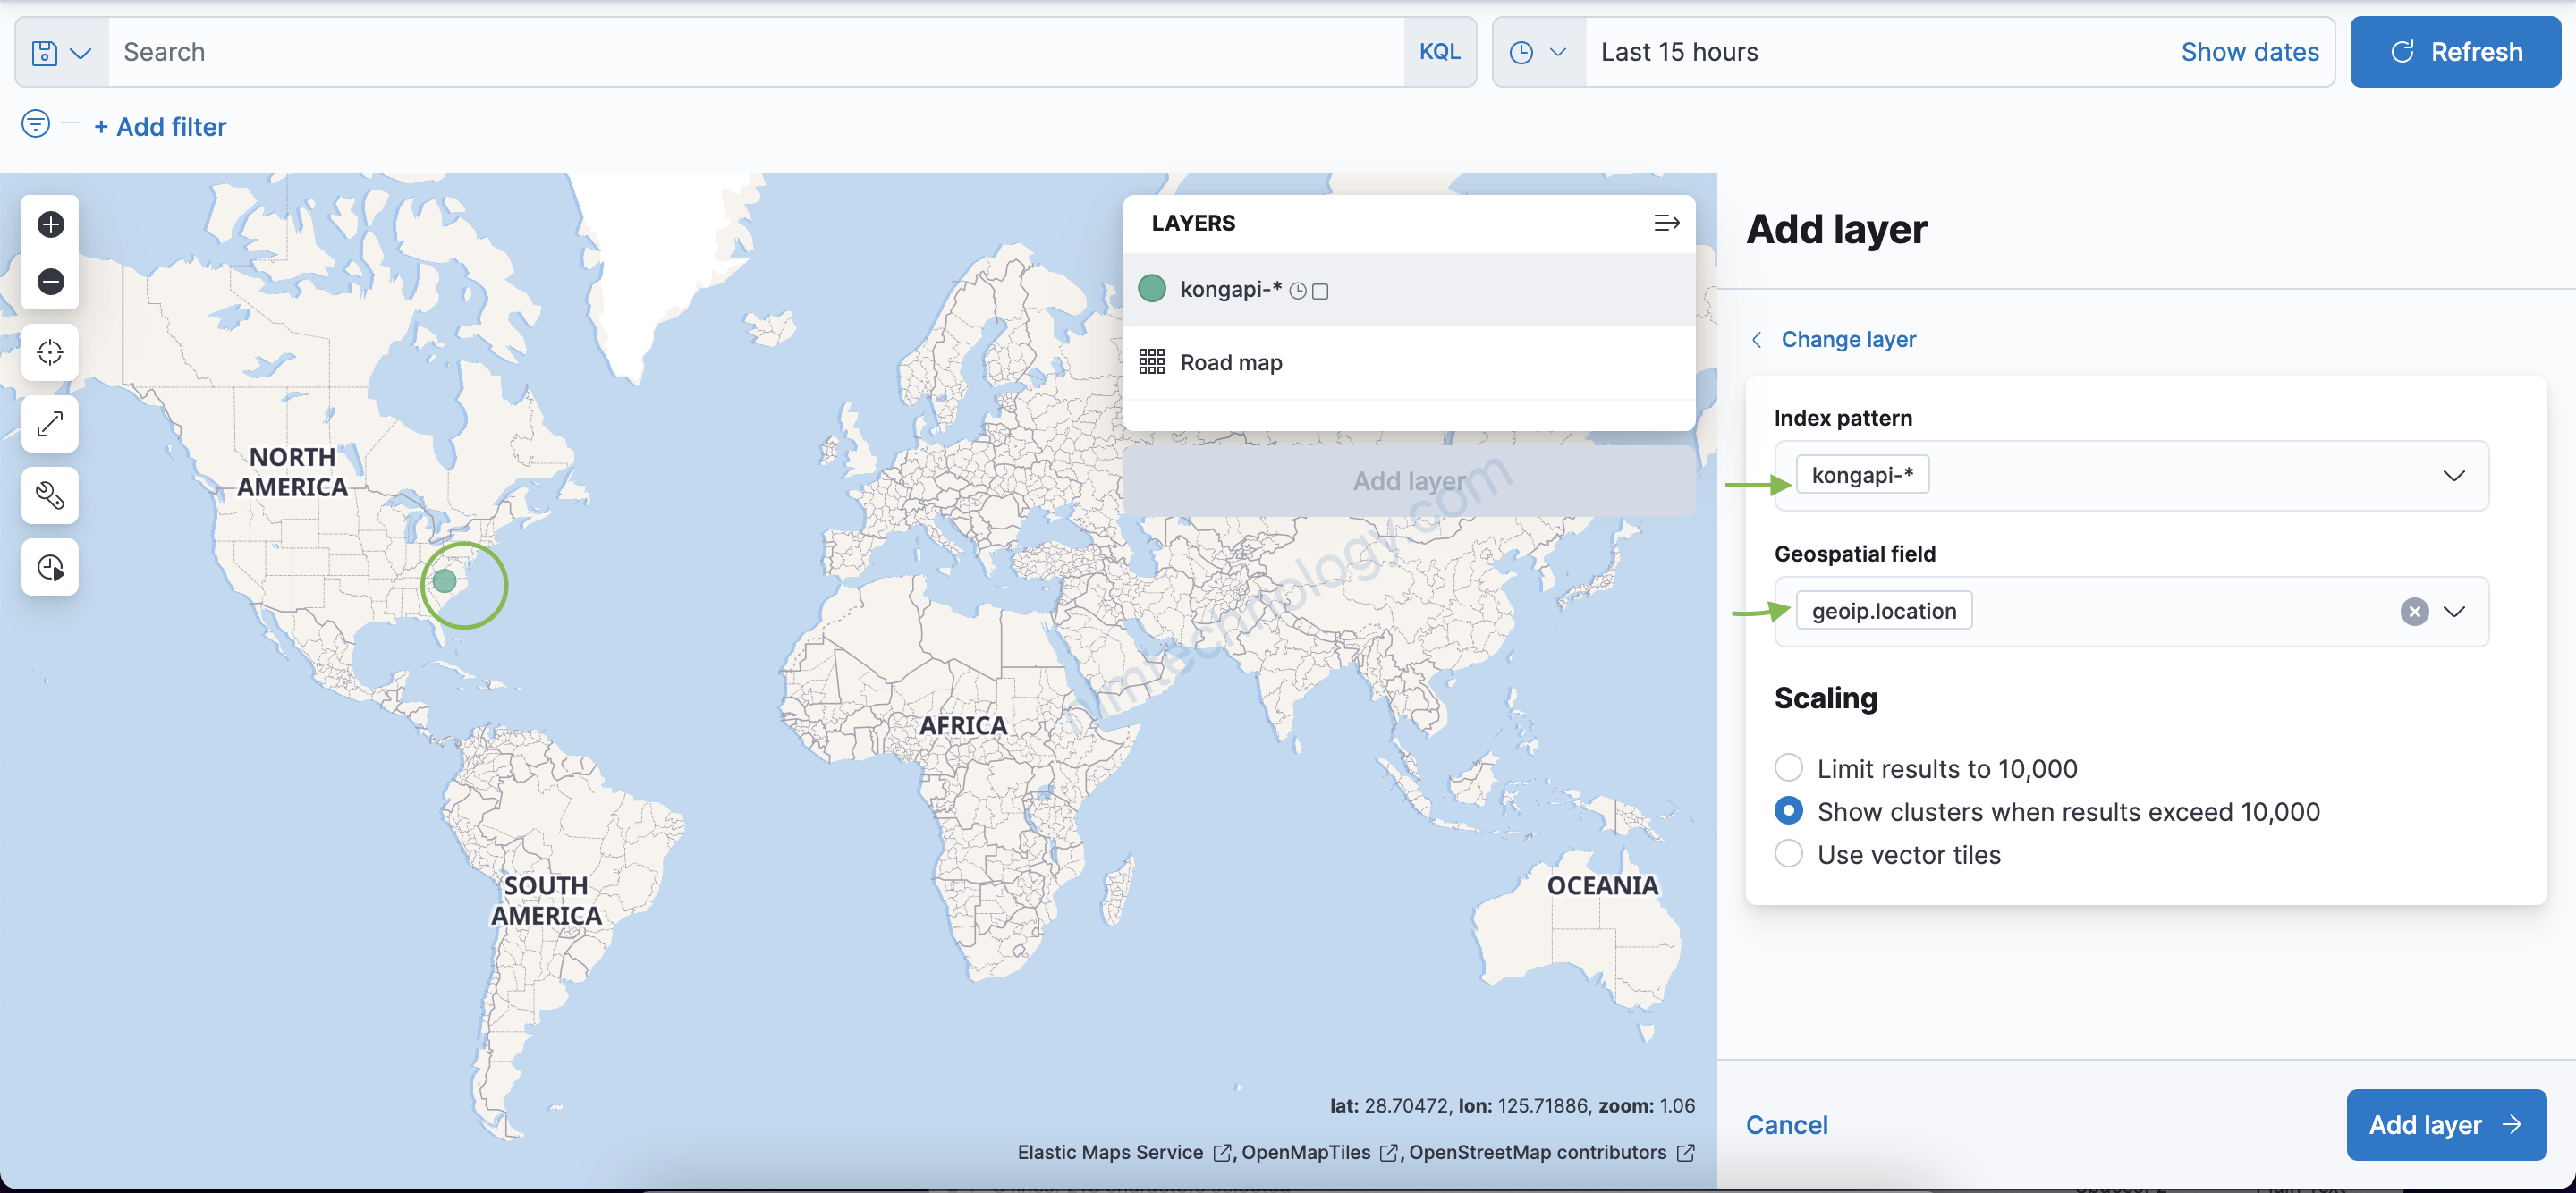
Nhưng mà khi bạn đổi sang index khác thì mình nhận ra là Kinana nó ko hiểu các field geoip.* để chúng ta vẽ bảng đồ
Các bạn cũng không cần lo vì mình sẽ hướng dẫn nhé