Đầu tiên bạn cần đăng ký tài khoản trên web của coralogix.
và sẽ không được dùng gmail nhé
https://dashboard.eu2.coralogix.com/#/signup
1) Install Coralogix Agent
Update (24/7/2025)
https://coralogix.com/docs/opentelemetry/integrations/kubernetes-complete-observability-advanced-configuration/
https://coralogix.com/docs/opentelemetry/kubernetes-observability/kubernetes-complete-observability-basic-configuration/
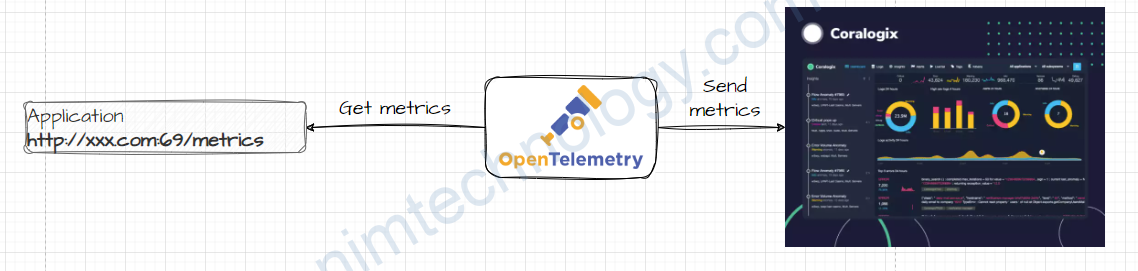
Thật ra thì thanh niên này độ lại agent của open telemetry collector
REPO URL: https://cgx.jfrog.io/artifactory/coralogix-charts-virtual
CHART: otel-infrastructure-collector:0.1.2
Nếu bạn muốn tham khảo helm chart của coralogix trên github:
telemetry-shippers/otel-agent/k8s-helm at master · coralogix/telemetry-shippers · GitHub
global:
  domain: "coralogix.com"
  traces:
    endpoint: "ingress.coralogix.com:443"
  metrics:
    endpoint: "ingress.coralogix.com:443"
  logs:
    endpoint: "ingress.coralogix.com:443"
opentelemetry-collector:
  mode: daemonset
  config:
    processors:
      attributes/insert:
        actions:
          - key: cluster_name
            action: insert
            value: nimtechnology-k0s
    exporters:
      coralogix:
        private_key: "112e529d-50b8-ae7e-8cec-xxxxxxxx"
2)Config the Open Telemetry collector to get metrics from Prometheus Receiver.
Bạn có thể cập nhật nhiều Receiver khác:
https://github.com/open-telemetry/opentelemetry-collector-contrib/tree/main/receiver
Bạn có thể tham khảo link dưới
prometheus_simple: https://github.com/open-telemetry/opentelemetry-collector-contrib/tree/main/receiver/simpleprometheusreceiver
prometheus: https://github.com/open-telemetry/opentelemetry-collector-contrib/tree/main/receiver/prometheusreceiver
2.1) Static Config
opentelemetry-collector:
  mode: deployment
  config:
    receivers:
      prometheus:
        config:
          scrape_configs:
          - job_name: opentelemetry-collector
            scrape_interval: 30s
            static_configs:
            - targets:
              - ${MY_POD_IP}:8888
          - job_name: 'metrics-server-exporter'
            scrape_interval: 30s
            static_configs:
            - targets:
              - xxx.monitoring.svc.cluster.local:1994
Nếu target là domain thì bạn nhớ check là pod có resolve được domain đó sang IP không nhé!
2.2) Auto Discover the metrics on Open Telemetry Collector
scrape_configs:
  - job_name: 'kubernetes-pods'
    kubernetes_sd_configs:
      - role: pod
    relabel_configs:
      - source_labels: [__meta_kubernetes_pod_annotation_prometheus_io_scrape]
        action: keep
        regex: true
      - source_labels: [__meta_kubernetes_pod_annotation_prometheus_io_path]
        action: replace
        target_label: __metrics_path__
        regex: (.+)
      - source_labels: [__address__, __meta_kubernetes_pod_annotation_prometheus_io_port]
        action: replace
        regex: (.+):(?:\d+);(\d+)
        replacement: $${1}:$${2}
        target_label: __address__
      - action: labelmap
        regex: __meta_kubernetes_pod_label_(.+)
      - source_labels: [__meta_kubernetes_namespace]
        action: replace
        target_label: kube_namespace
      - source_labels: [__meta_kubernetes_pod_name]
        action: replace
        target_label: pod
kubernetes_sd_configs: - role: pod: This section is telling Prometheus to discover and potentially scrape metrics from Kubernetes pods. The role parameter can be set to different Kubernetes object types like node, service, endpoints, but here we use pod.relabel_configs: This section contains rules that are applied to each discovered target before it gets scraped. These rules can modify or filter out targets based on their labels.
The first rule:
- source_labels: [__meta_kubernetes_pod_annotation_prometheus_io_scrape]
  action: keep
  regex: true
Here, Prometheus looks at the __meta_kubernetes_pod_annotation_prometheus_io_scrape label, which represents the prometheus.io/scrape annotation on the pod. If the annotation is ‘true,’ the pod will be kept for scraping; otherwise, it’s dropped.
The second rule:
- source_labels: [__meta_kubernetes_pod_annotation_prometheus_io_path]
  action: replace
  target_label: __metrics_path__
  regex: (.+)
This rule modifies the __metrics_path__ label, which is used by Prometheus to know where to scrape metrics from. The new value is taken from the prometheus.io/path annotation on the pod.
The third rule:
- source_labels: [__address__, __meta_kubernetes_pod_annotation_prometheus_io_port]
  action: replace
  regex: (.+):(?:\d+);(\d+)
  replacement: $${1}:$${2}
  target_label: __address__
This rule modifies the __address__ label, which is used by Prometheus to know which IP and port to scrape. The new value is built from the IP of the target (which is already contained in the __address__ label) and the port number from the prometheus.io/port annotation on the pod.
Specify the workload that you want to monitor via annotation.
To enable Prometheus to automatically collect metrics from a specific Kubernetes Deployment, you need to annotate the Deployment object accordingly. The Prometheus instance should have the necessary configurations to discover and scrape targets based on these annotations.
Here is a basic example of how to annotate a Deployment in Kubernetes:
apiVersion: apps/v1
kind: Deployment
metadata:
  labels:
    app: prometheus-cloudwatch-exporter
    app.kubernetes.io/instance: cloudwatch-exporter-nimtechnology-dev
    chart: prometheus-cloudwatch-exporter-0.24.0
    heritage: Helm
    release: cloudwatch-exporter-nimtechnology-dev
  name: cloudwatch-exporter-nimtechnology-dev-prometheus-cloudwatch-exporter
  namespace: coralogix
spec:
  replicas: 1
  selector:
    matchLabels:
      app: prometheus-cloudwatch-exporter
      release: cloudwatch-exporter-nimtechnology-dev
  template:
    metadata:
      annotations:
        ####################
        ###### Look at #######
        ####################
        prometheus.io/path: /metrics
        prometheus.io/port: '9106'
        prometheus.io/scrape: 'true'
      labels:
        app: prometheus-cloudwatch-exporter
        release: cloudwatch-exporter-nimtechnology-dev
    spec:
      containers:
        - env:
            - name: POD_IP
              valueFrom:
                fieldRef:
                  fieldPath: status.podIP
            - name: AWS_ACCESS_KEY_ID
...
In this example,
prometheus.io/scrape: 'true'tells Prometheus to scrape metrics from this deployment.prometheus.io/path: '/metrics'Specifies the endpoint that exposes the metrics.prometheus.io/port: '8080'tells Prometheus the port on which the metrics are exposed.
Remember to replace your-deployment with the name of your actual deployment and adjust the port and path according to your application’s settings.
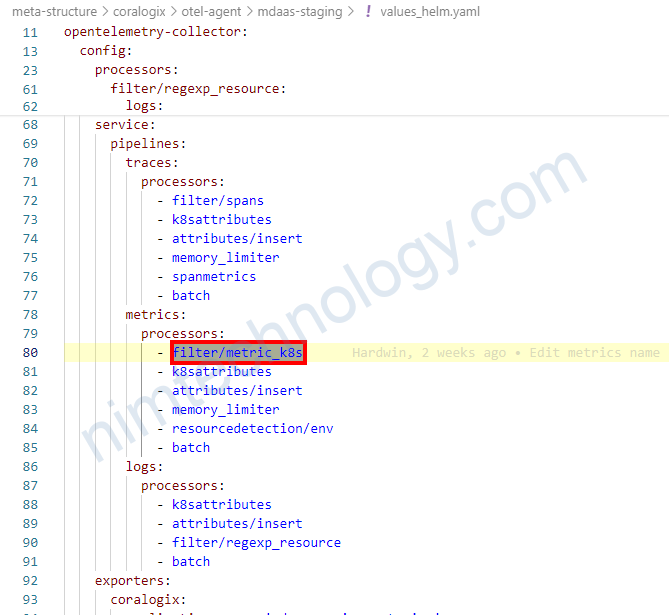
2.3) Filter metrics on Coralogix.
Đầu tiên bạn cần tim ra các metrics mà đang sử dụng trên Grafana
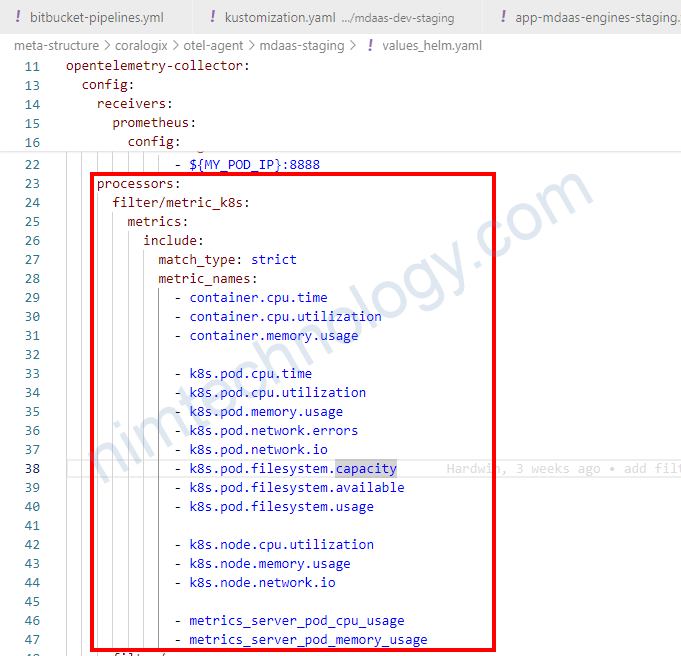
Trên ý tưởng là chúng ta nhận trong filter và remove các metrics còn lại.
    processors:
      filter/metric_k8s:
        metrics:
          include:
            match_type: strict
            metric_names:
              - container.cpu.time
              - container.cpu.utilization
              - container.memory.usage
Sau khi cấu hình filter như thế nào thì bạn cần khai báo nó trong service
3) Collect Logs by OpenTelemetry Collector.
Trong một bài của tracing mình cũng đã nhắc đến việc filtering in processors.
Bình thường thường khi chúng ta setup OpenTelemetry Collector trên k8s thì nó sẽ lấy hết logs Stdout, Stderror trên k8s và send đi
Nhưng giờ mình muốn chỉ send logs của 1 vài namespace thôi!
3.1) Specify to collect logs of a few workloads on k8s by filtering way in Processors
Bạn có thể follow link này.
https://github.com/open-telemetry/opentelemetry-collector-contrib/tree/main/processor/filterprocessor
Mình chỉ lấy logs of namespace argocd.
    processors:
      ...
      filter/regexp_resource:
        logs:
          include:
            match_type: regexp
            resource_attributes:
            - key: k8s.namespace.name
              value: "^argocd$"
*Đầu tiên thì bạn đặt tên cho processors con: filter/regexp_resource (format: filter/<name>)
*logs: This section likely contains the settings and parameters for the log processing. It takes a pipeline type, of which logs metrics, and traces are supported, followed by an action:
+ include: Any names NOT matching filters are excluded from remainder of pipeline
=> Nếu chọn include nó giữ nào các messages mà match với regex
+ exclude: Any names matching filters are excluded from remainder of pipeline
=> Nếu chọn exclude nó bỏ nào các messages mà match với regex
*match_type: chúng ta có 2 kiểu là strict|regexp
This indicates that the filter is using regular expressions (regex or strict) for matching.
trong bài này thì mình chọn regexresource_attributes: ResourceAttributes defines a list of possible resource attributes to match logs against. A match occurs if any resource attribute matches all expressions in this given list.
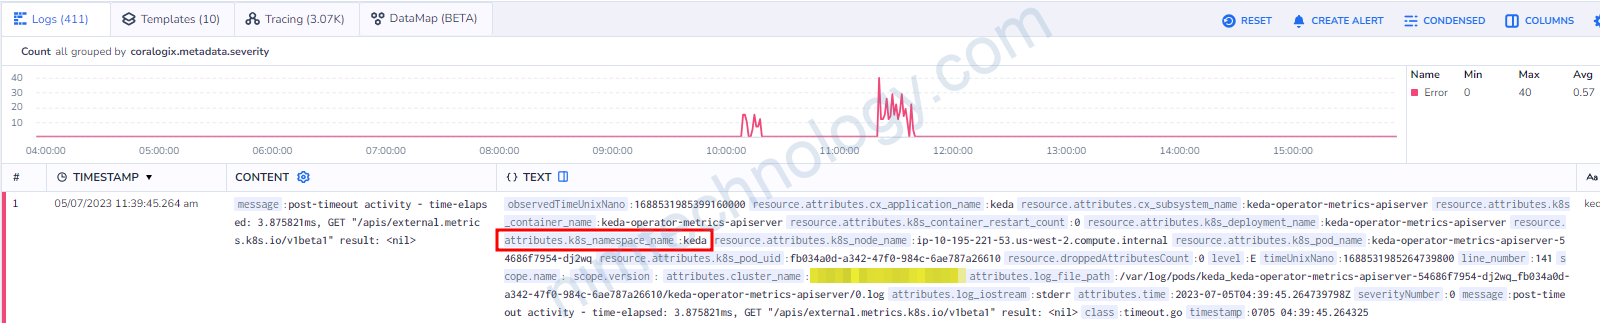
ở đâu thì chọn key như thế nào. Giờ chúng ta cùng vào coralogix.
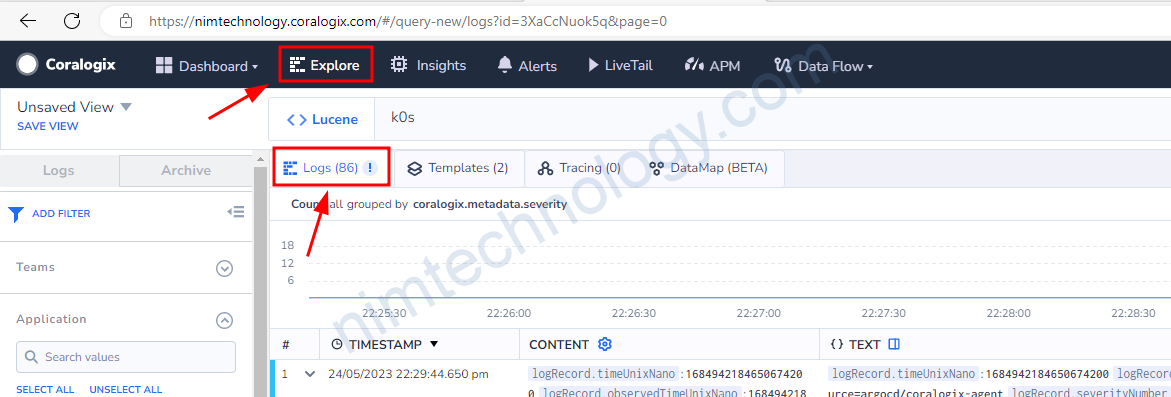
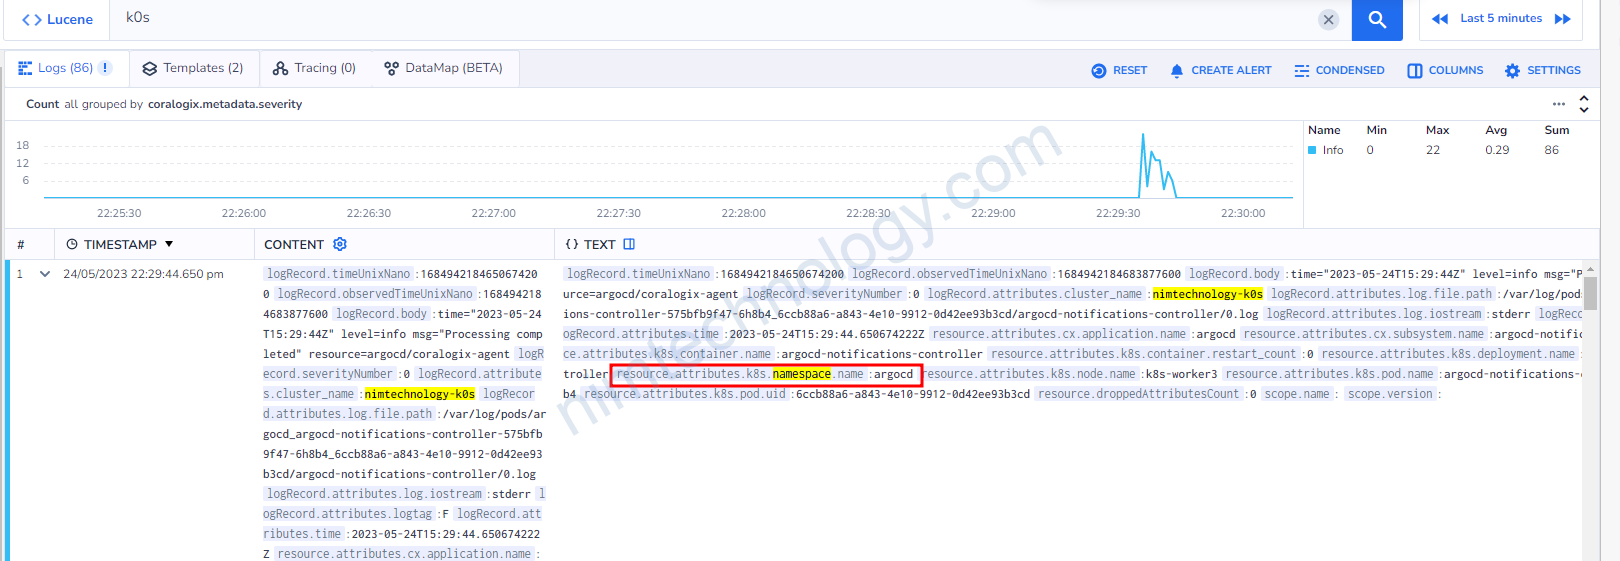
lúc này ta sẽ lấy k8s.namespace.name vào đưa vào key.
Có một điều lưu ý là: resource.attributes.k8s_namespace_name:keda
Bạn sẽ thấy sau resource.attributes là k8s_namespace_name nhưng chúng ta lúc filter sẽ vẫn dùng k8s.namespace.name
thay “_” thành”.“
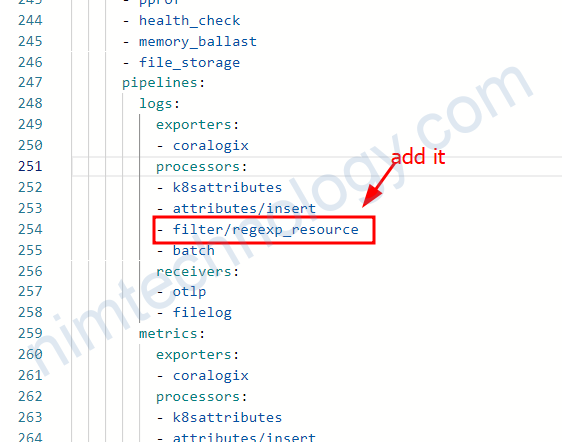
You should then add this processor to your logs pipeline (after k8sattributes processor)
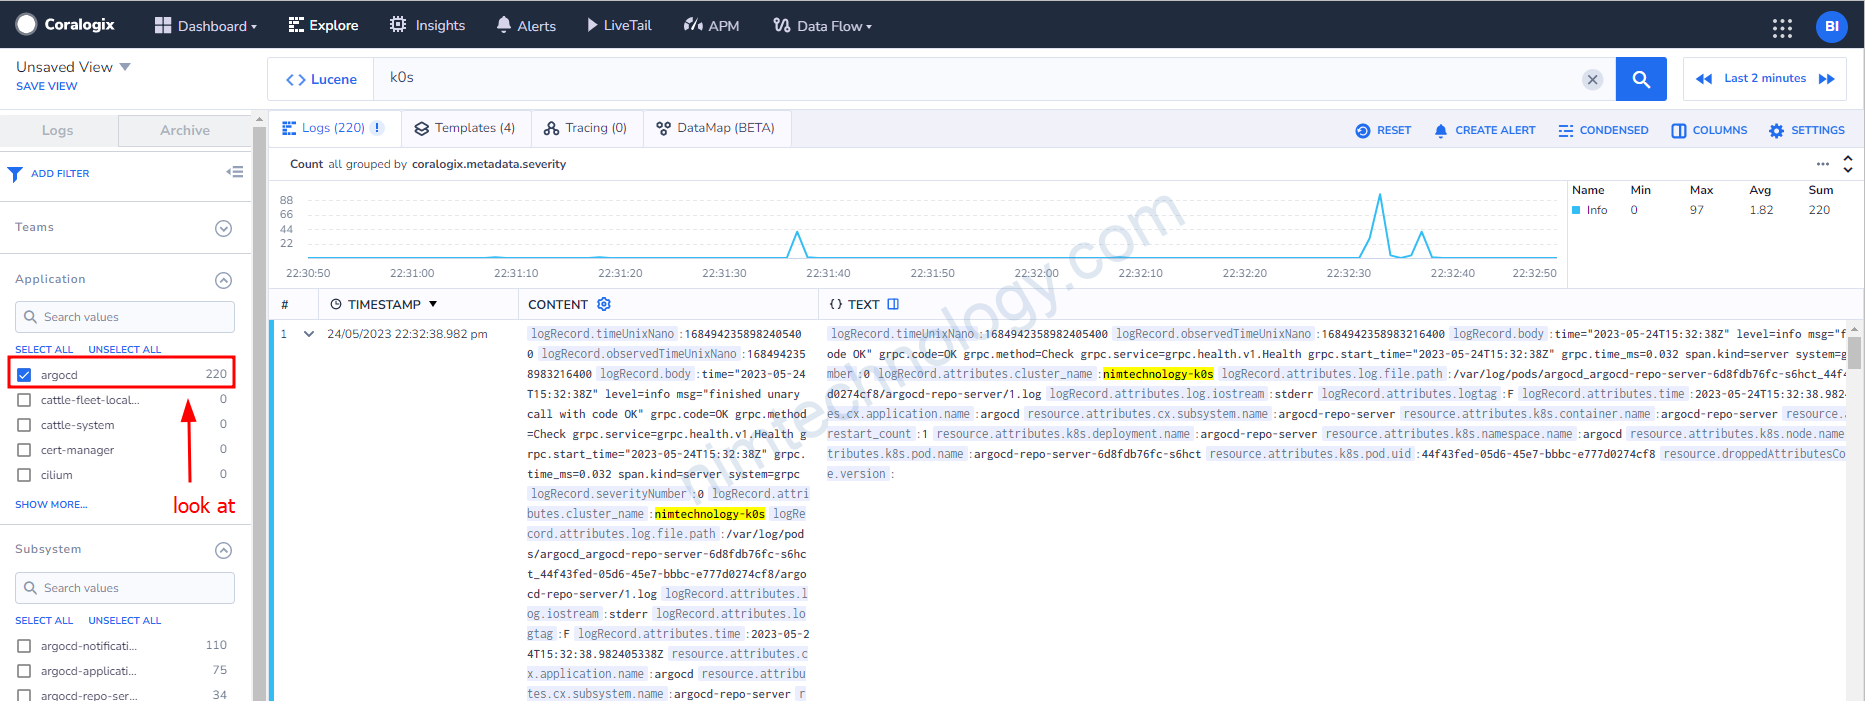
Giờ bạn thấy chỉ còn argocd
3.2) Opentelemetry sends log to Vector.
Giờ chúng ta cần send log từ opentelemetry trên sang vector để thực hiện transform.
exporters:
  otlp/vector:
    endpoint: vector-nim-dev.coralogix:4317
    tls:
      insecure: true
...
...

service:
  pipelines:
    logs/results:
      exporters:
      - otlp/vector
      processors:
      - k8sattributes
      - attributes/insert
      - batch
      - filter/regexp_resource
      receivers:
      - filelog/result_logs_only
Bạn có thể thấy là mình đăng send log sang port 4317 (GRPC protocol) hoặc bạn có thể gửi sang port 4318 (HTTP Protocol)
Và bạn cũng thấy là mình có tạo 1 pipeline để apply việc gửi log sang vector.
3.3) Filter Log by Opentelemetry.
Giờ mình sẽ cung cấp 1 case cụ thể filter log
exporters:
  otlp/vector:
    endpoint: vector-nim-dev.coralogix:4317
    tls:
      insecure: true
receivers:
  filelog/result_logs_only:
    - type: file_input
      include:
      - /var/log/pods/*result*/*/*.log
      include_file_name: false
      include_file_path: true
      start_at: beginning
      storage: file_storage
      operators:
      - id: parser-containerd
        type: regex_parser
        output: recombine-cri
        regex: ^(?P<time>\d{4}-\d{2}-\d{2}T[0-9:.]+Z)\s(?P<stream>stdout|stderr)\s(?P<logtag>P|F)\s(?P<log>.*)
        timestamp:
          layout: '%Y-%m-%dT%H:%M:%S.%LZ'
          parse_from: attributes.time

      - id: recombine-cri
        type: recombine
        combine_field: attributes.log
        combine_with: ""
        is_last_entry: attributes.logtag == 'F'
        source_identifier: attributes["log.file.path"]
        overwrite_with: "newest"
        output: filter-esindex-results

      - id: filter-esindex-results
        type: filter
        expr: 'attributes.log not matches "esIndexName"'
        output: extract_metadata_from_filepath

      - id: extract_metadata_from_filepath
        type: regex_parser
        parse_from: attributes["log.file.path"]
        regex: ^.*/(?P<namespace>[^_]+)_(?P<pod_name>[^_]+)_(?P<uid>[a-f0-9\-]+)/(?P<container_name>[^\._]+)/(?P<restart_count>\d+)\.log$
      - type: move
        from: attributes.stream
        to: attributes["log.iostream"]
      - type: move
        from: attributes.container_name
        to: resource["k8s.container.name"]
      - type: move
        from: attributes.namespace
        to: resource["k8s.namespace.name"]
      - type: move
        from: attributes.pod_name
        to: resource["k8s.pod.name"]
      - type: move
        from: attributes.restart_count
        to: resource["k8s.container.restart_count"]
      - type: move
        from: attributes.uid
        to: resource["k8s.pod.uid"]
      - type: move
        from: attributes.log
        to: body
service:
  pipelines:
    logs/results:
      exporters:
      - otlp/vector
      processors:
      - k8sattributes
      - attributes/insert
      - batch
      - filter/regexp_resource
      receivers:
      - filelog/result_logs_only
Chúng ta sẽ đi sâu vào phần receiver.
receivers:
  filelog/result_logs_only:
    - type: file_input
      include:
      - /var/log/pods/*result*/*/*.log
      include_file_name: false
      include_file_path: true
      start_at: beginning
      storage: file_storage
Nó setup việc read log files
– chúng ta sử dụng type: file_input
– Chỉ định targets log file tại: include -> /var/log/pods/*result*/*/*.log
– include_file_path: true The full path of the log file is included as an attribute (log.file.path), which is used later to extract metadata.
– start_at: beginning: It processes log files from their beginning, not just new lines.
-> Nó giống như bắt đâu đọc từ dòng đầu tiên của file.
Tiếp đến chúng ta đi vào phần operator.
      - id: parser-containerd
        type: regex_parser
        output: recombine-cri
        regex: ^(?P<time>\d{4}-\d{2}-\d{2}T[0-9:.]+Z)\s(?P<stream>stdout|stderr)\s(?P<logtag>P|F)\s(?P<log>.*)
        timestamp:
          layout: '%Y-%m-%dT%H:%M:%S.%LZ'
          parse_from: attributes.time
Bước này chúng ta thực hiện lấy các log và match với regex.
This parses the raw log line, which appears to be in a standard container runtime (like containerd or cri-o) format. It uses a regular expression to extract the timestamp, the stream (stdout or stderr), a log tag (P for partial, F for full line)(P cho dòng không đầy đủ, F cho dòng đầy đủ), and the log content itself.
      - id: recombine-cri
        type: recombine
        combine_field: attributes.log
        combine_with: ""
        is_last_entry: attributes.logtag == 'F'
        source_identifier: attributes["log.file.path"]
        overwrite_with: "newest"
        output: filter-esindex-results
recombine-cri (recombine): This operator is for handling multi-line logs (like stack traces). It appends log lines together until it finds a line tagged as the final one (F), ensuring a complete log entry is processed as a single event.
Chúng ta cùng tìm hiểu:
The container runtime (like CRI-O or contained) là smart. Khi một application writes một multi-line log, nó adds a tag đặc biệt cho mỗi line.
– Nó gắn thẻ P (viết tắt của “Partial”) vào mỗi dòng không phải là dòng cuối cùng của tin nhắn.
– Nó đánh dấu dòng cuối cùng của tin nhắn bằng chữ F (viết tắt của “Full” hoặc “Final”).
Raw log là như sau:
2024-05-21T12:00:00Z stdout P Exception in thread "main" java.lang.NullPointerException
2024-05-21T12:00:00Z stdout P at com.example.MyApplication.doSomething(MyApplication.java:10)
2024-05-21T12:00:00Z stdout P at com.example.MyApplication.main(MyApplication.java:5)
2024-05-21T12:00:00Z stdout F ... 2 more
recombine-cri nó combine các dòng lại dựa vào các tag và kết quả là:
    Exception in thread "main" java.lang.NullPointerException
    at com.example.MyApplication.doSomething(MyApplication.java:10)
    at com.example.MyApplication.main(MyApplication.java:5)
    ... 2 more
- id: filter-esindex-results
type: filter
expr: 'attributes.log not matches "esIndexName"'
output: extract_metadata_from_filepath
expr | required | Incoming entries that match this expression will be dropped. |
Nếu Message đi vào mà match với điều điện sẽ bị Drop.
Nếu message không chứa “esIndexName” thì nó sẽ bị drop. và không đi tiếp đến bước sau.
3.4) Coralogix/Opentelemetry: Collect logs from Windows Pods.
Bạn thấy có helm chart ở đây:
https://github.com/coralogix/telemetry-shippers/tree/master/otel-integration/k8s-helm
Lúc này mình thấy có file values-windows.yaml
Lúc này bạn cần download file values-windows.yaml và để dưới local
- name: otel-integration
  includeCRDs: false
  releaseName: otel-windows-agent
  version: 0.0.244
  repo: https://cgx.jfrog.io/artifactory/coralogix-charts-virtual
  valuesFile: values-windows.yaml
  namespace: coralogix
  additionalValuesFiles:
    - values-custom-windows.yaml
Còn file: values-custom-windows.yaml thì sẽ như sau:
global:
  domain: "coralogix.us"
  clusterName: "nimtechnology-engines"

opentelemetry-agent-windows:
  # Provide permission for otel windows can read the pod logs
  securityContext:
    windowsOptions:
      runAsUserName: "ContainerAdministrator"
  image:
    tag: 0.140.1-windows-2022-amd64
  config:
    extensions:
      file_storage:
        directory: "C:\\ProgramData\\otelcol\\file_storage"
        create_directory: true
        timeout: 1s
    processors:
      resourcedetection/env:
        detectors: ["env"] # Use environment variables only, remove "system" or "gcp/aws/azure" if it causes errors
      filter/spans:
        spans:
          exclude:
            match_type: strict
            span_names:
              - dev_mdaas
      attributes/insert:
        actions:
          - key: cluster_name
            action: insert
            value: nimtechnology-engines
      filter/regexp_resource:
        logs:
          include:
            match_type: regexp
            resource_attributes:
            - key: k8s.namespace.name
              value: "^nitmechnology-engines-dev$"
    service:
      pipelines:
        logs:
          processors:
            - attributes/insert
            - filter/regexp_resource

# Limit other sub-charts to Linux nodes only
opentelemetry-agent:
  enabled: false

opentelemetry-cluster-collector:
  enabled: false
4) Advantage
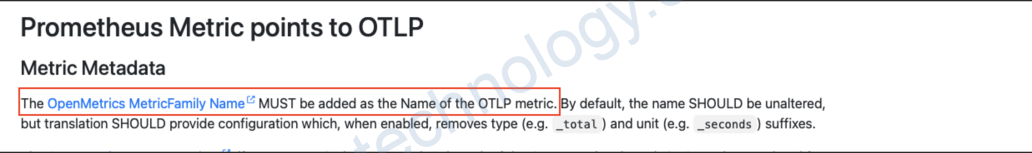
4.1) OTel spec requires _total suffix when converting Prometheus metric to OTLP.
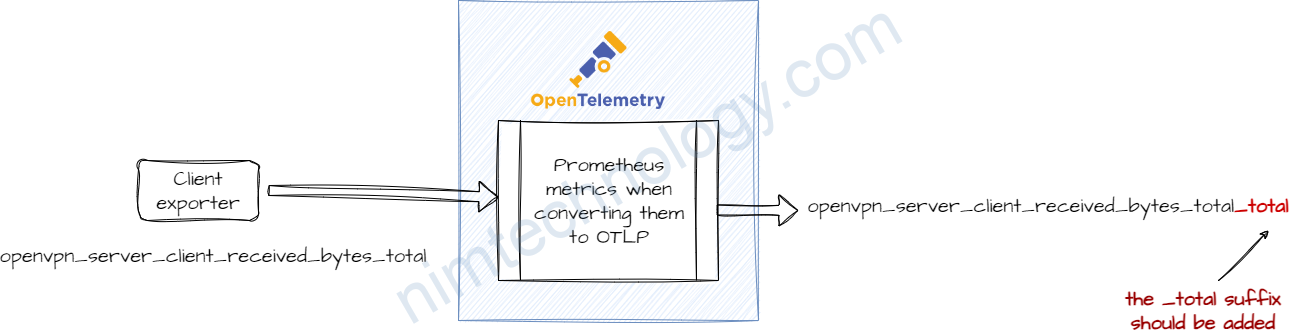
The OTel spec requires that the _total suffix is added when converting a Prometheus metric to OTLP.
It is explained here – https://opentelemetry.io/docs/specs/otel/compatibility/prometheus_and_openmetrics/#metric-metadata
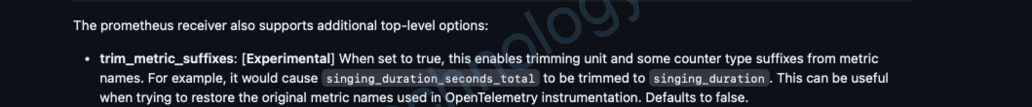
According to this explanation – It should be possible to disable this behavior by using the trim_metric_suffixes feature on the prometheus receiver – https://github.com/open-telemetry/opentelemetry-collector-contrib/blob/main/receiver/prometheusreceiver/README.md
Integrating with Coralogix data sources, including Prometheus, involves…
Coralogix cũng cho phép chúng ta query trực tiếp vào data source như một prometheus.
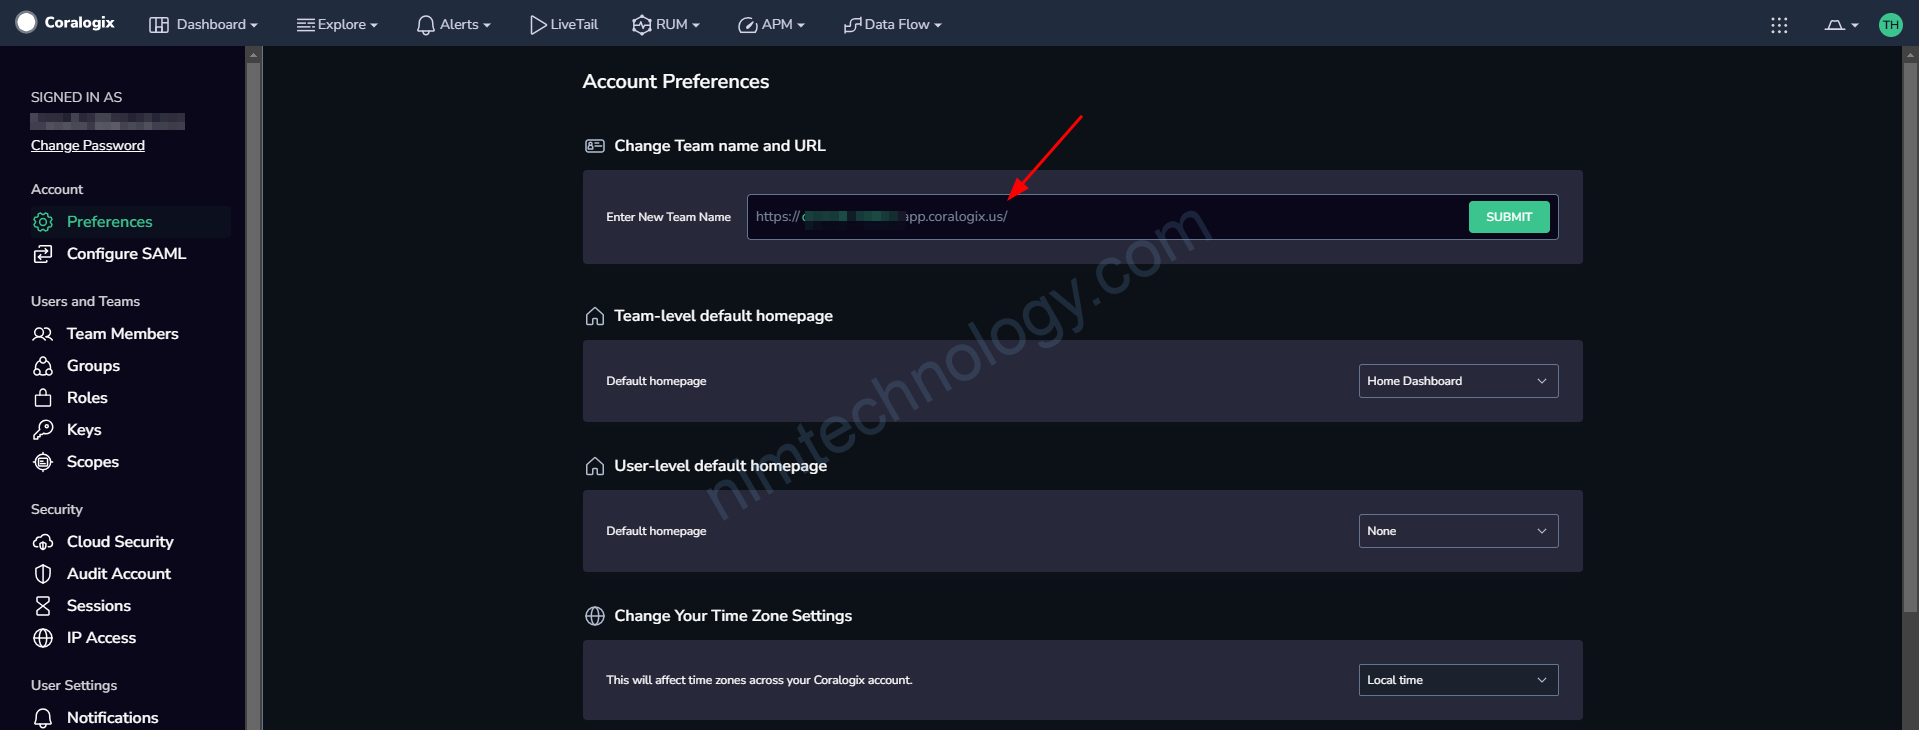
Đầu tiên các bạn cần xác định là Coralogix của các bạn đang được cài đặt trên region nào?
Bạn có thể nhắn tin trực tiếp với coralogix hoặc như mình vào phần setting:
https://coralogix.com/docs/integrations/coralogix-endpoints/#metrics
ở link trên tổng hợp các endpoint của metrics coralogix:
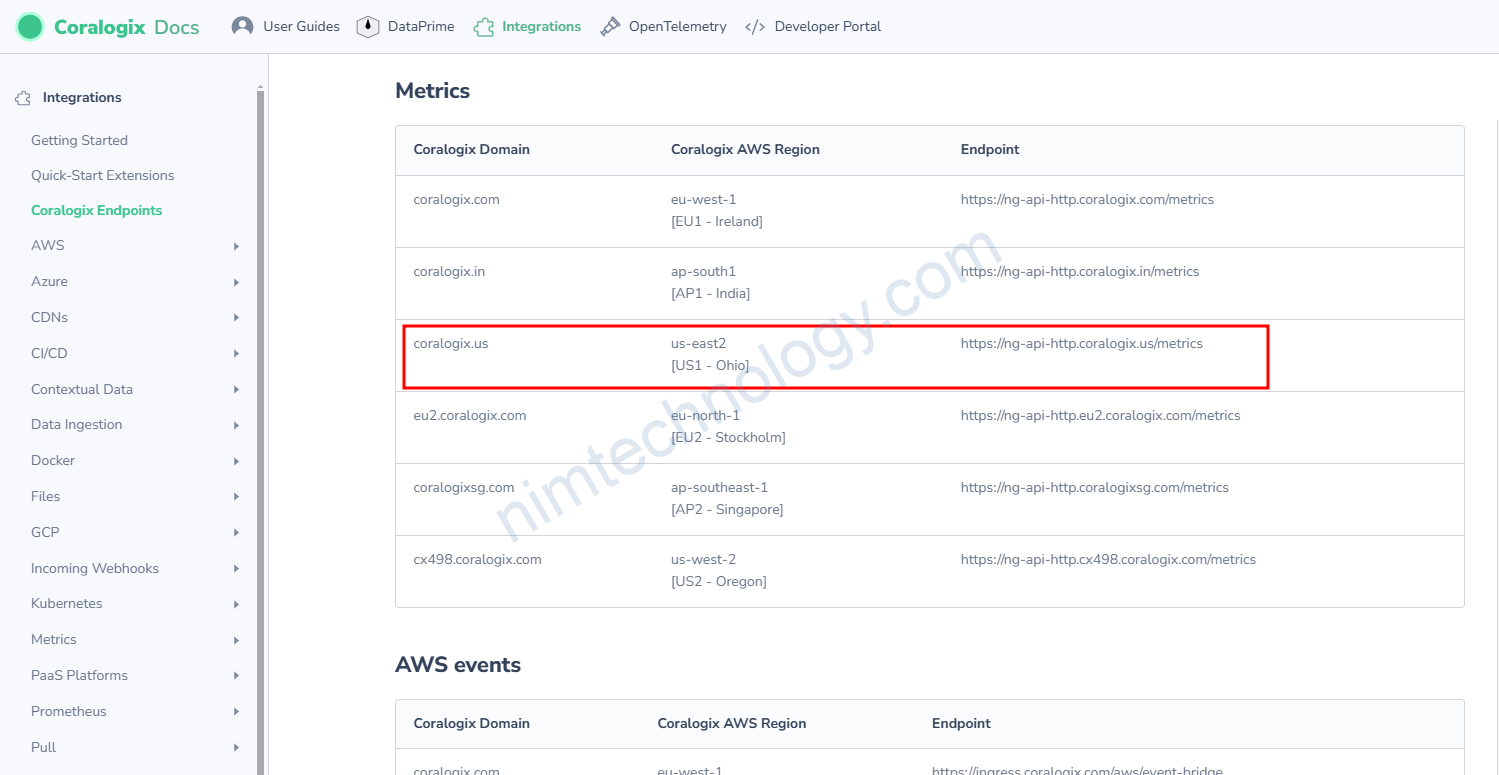
Mình chọn endpoint là:
https://ng-api-http.coralogix.us/metricsTiếp đến bạn tạo 1 api key với role là DATAQUERYING
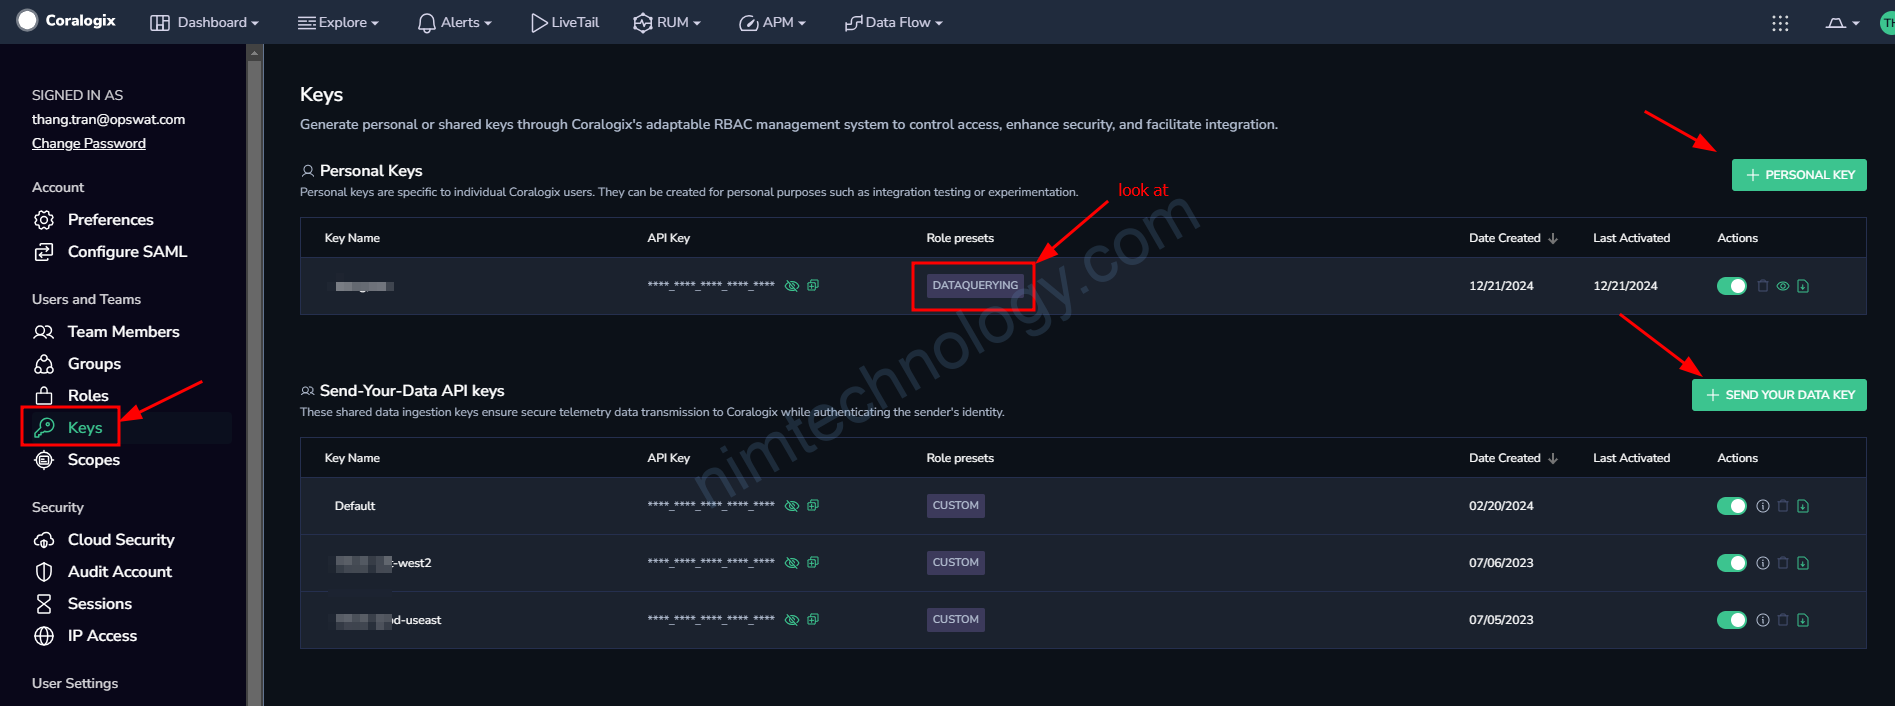
chi tiết của key này là:
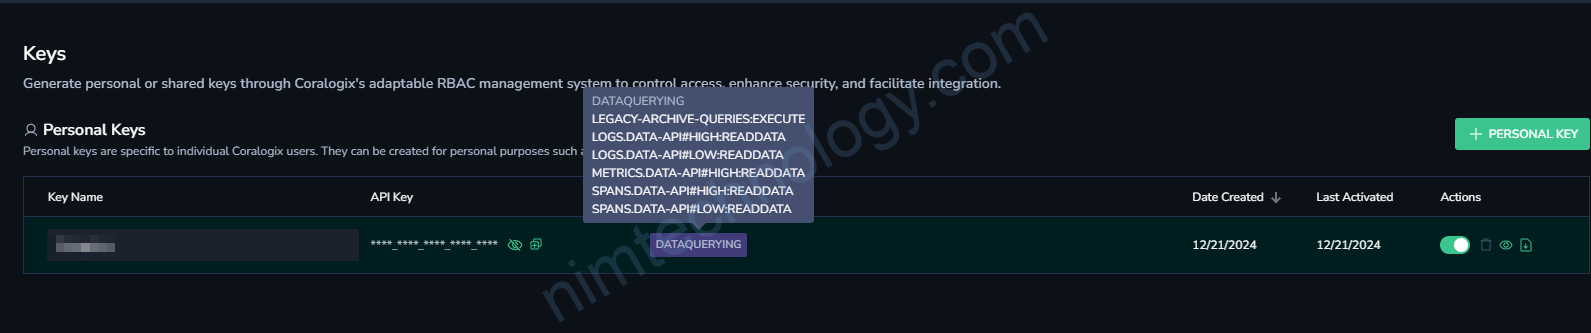
DATAQUERYING
LEGACY-ARCHIVE-QUERIES:EXECUTE
LOGS.DATA-API#HIGH:READDATA
LOGS.DATA-API#LOW:READDATA
METRICS.DATA-API#HIGH:READDATA
SPANS.DATA-API#HIGH:READDATA
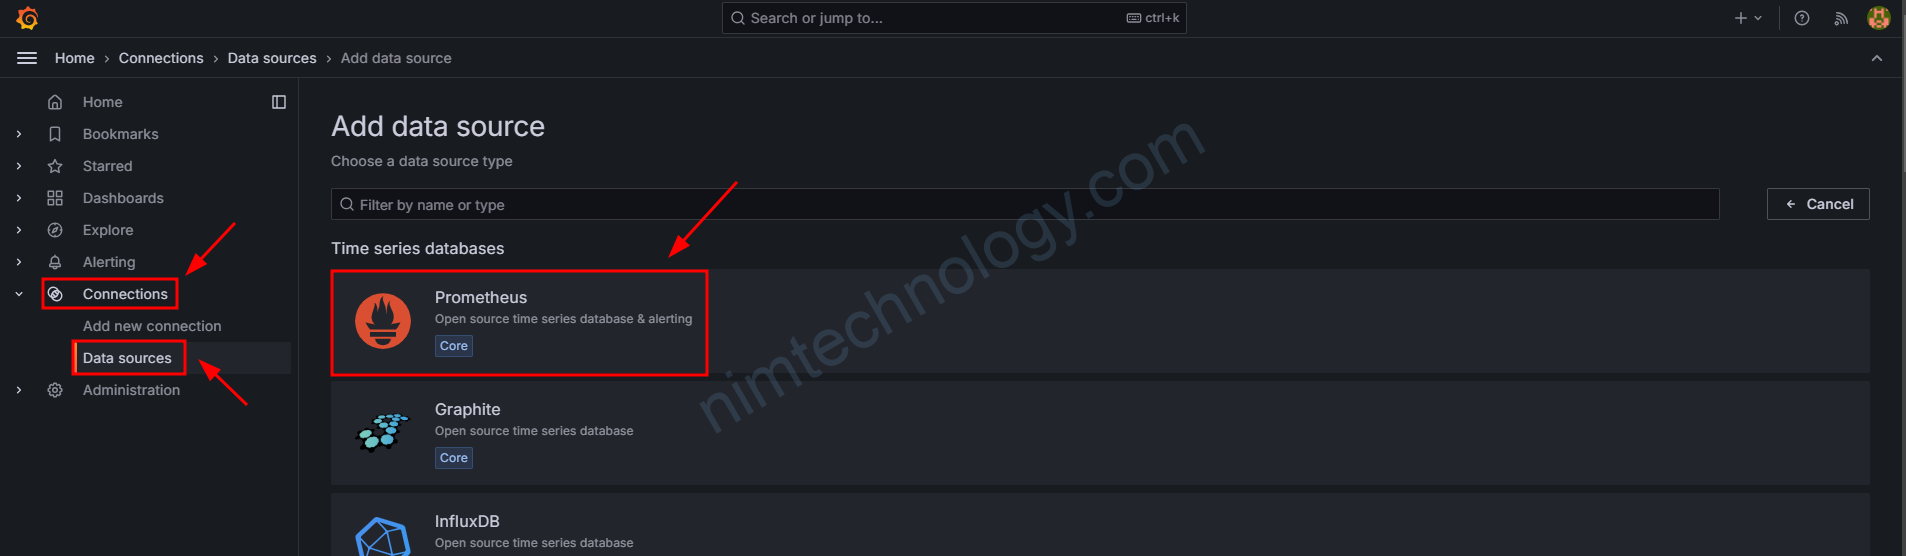
SPANS.DATA-API#LOW:READDATATiếp đến bạn đi sang Grafana để setup connection:
https://coralogix.com/docs/user-guides/visualizations/grafana-plugin/#connect-your-metrics
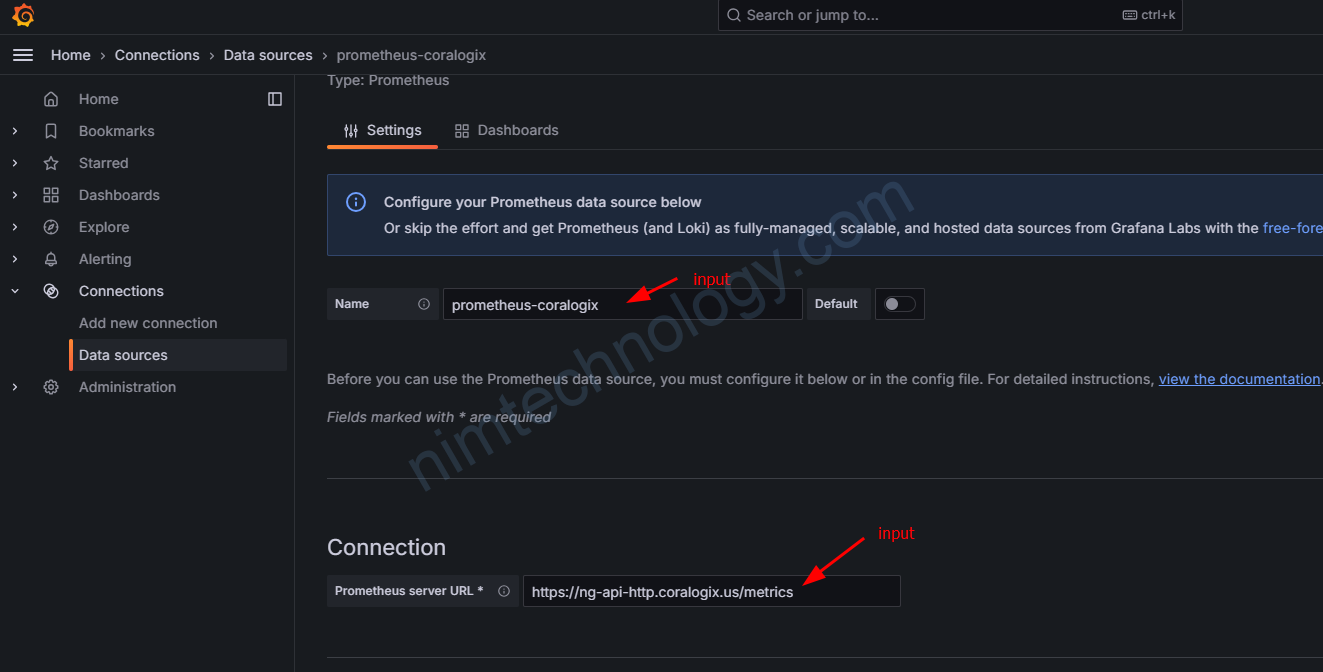
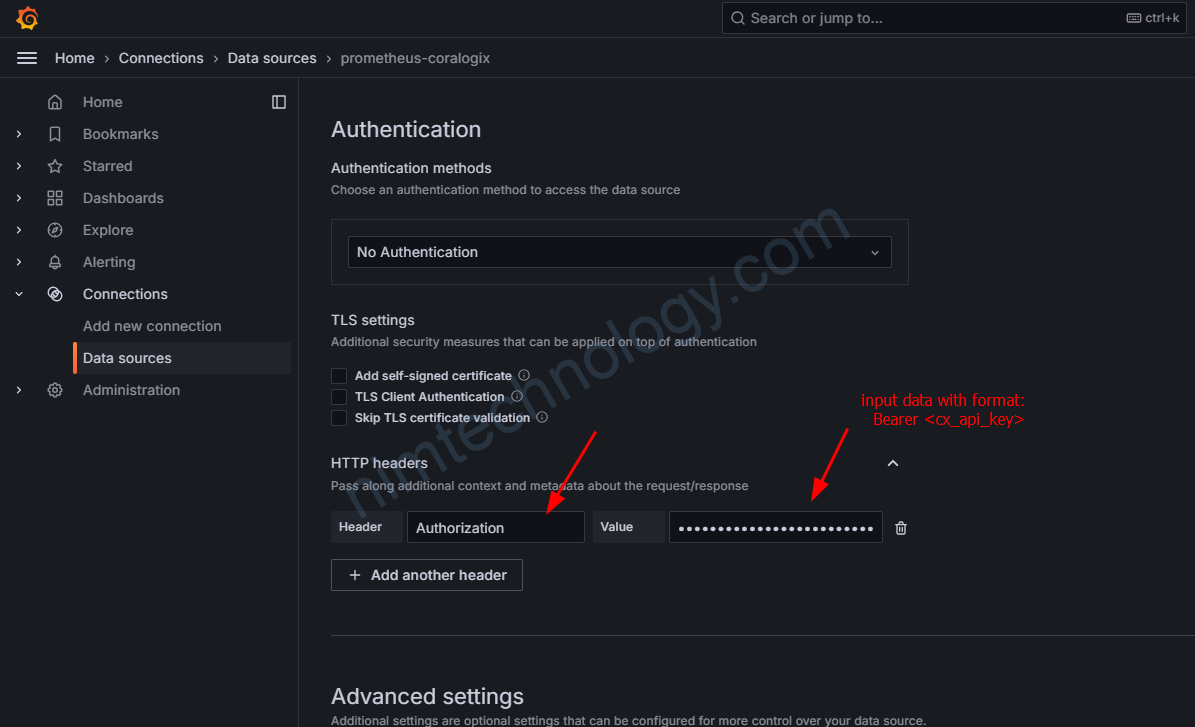
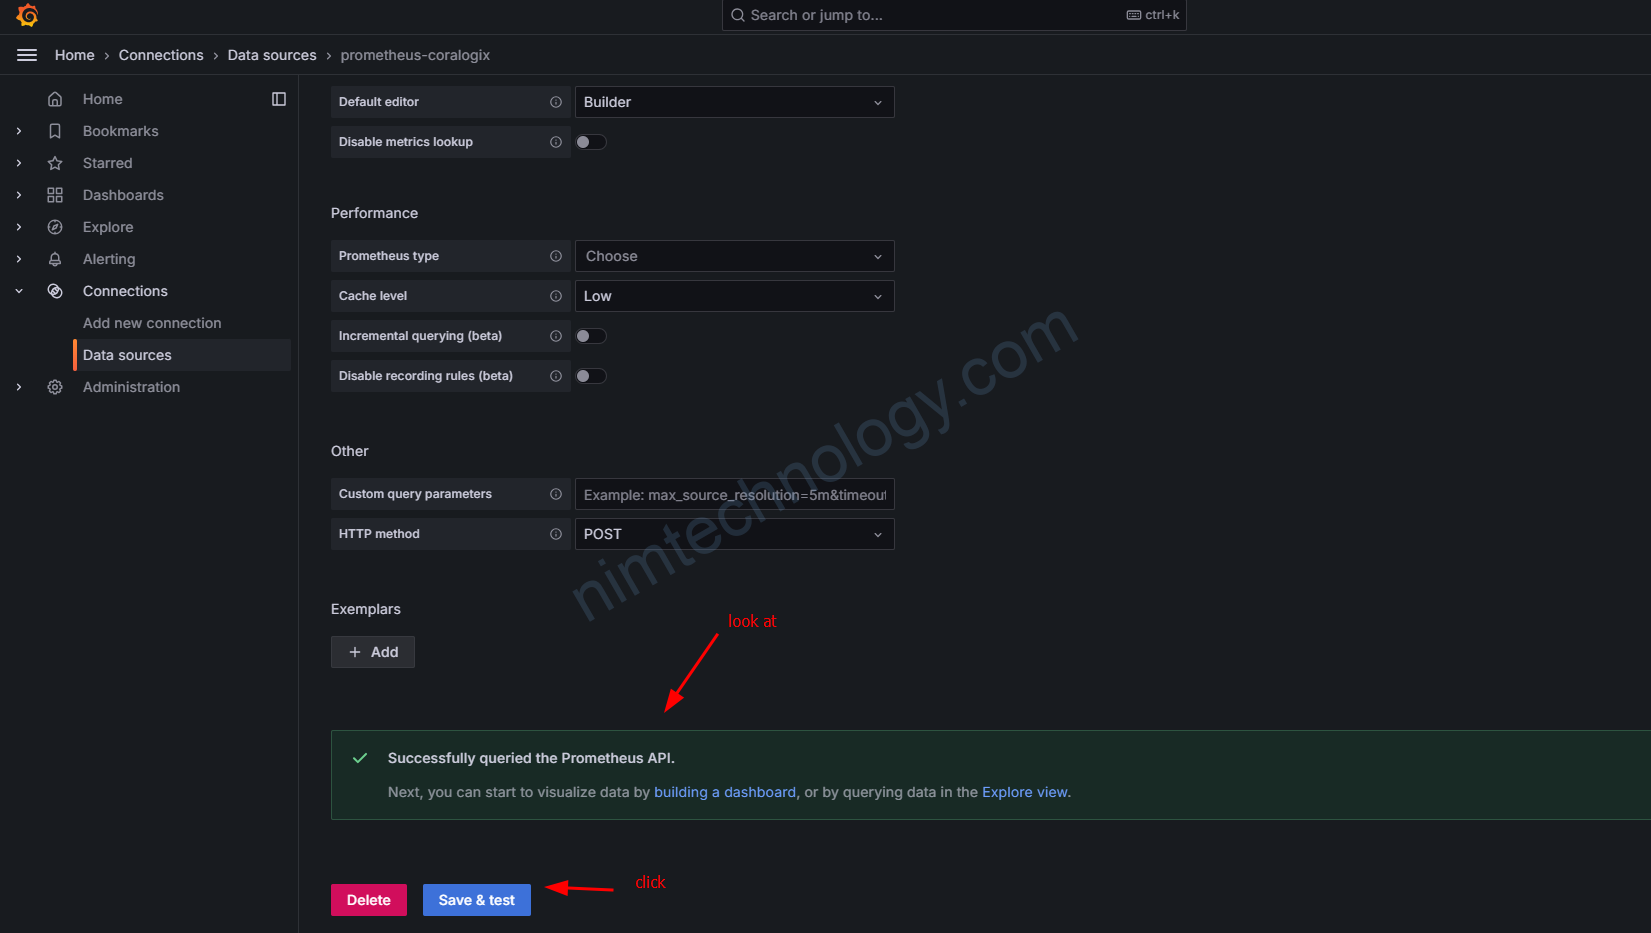
Vậy là đã xong ok rồi dứt thôi