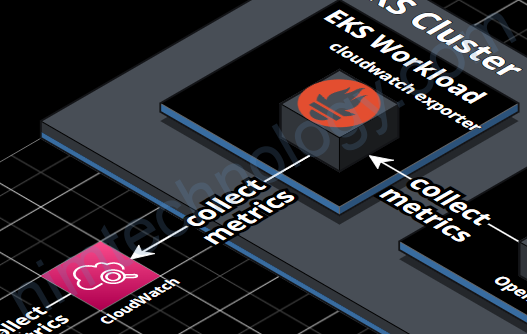
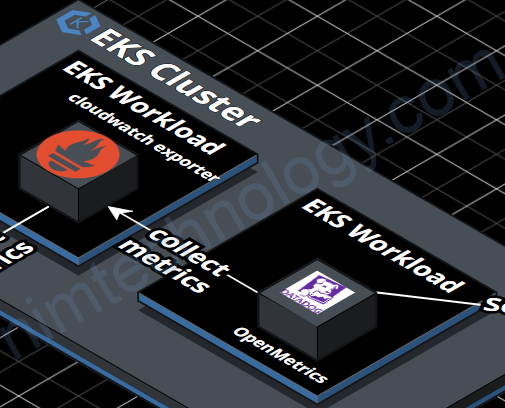
1) Introduce the design architecture
Mô hình bạn có thể thấy như hình bên dưới.
Thì mình dùng datadog agent trên k8s để collect metrics của cloudwatch
Nhưng mà datadog agent không để đọc trực tiếp vào Cloudwatch nên mình sẽ sử dụng 1 opensource của prometheus là prometheus cloudwatch exporter để get metrics từ cloud watch.
https://github.com/prometheus/cloudwatch_exporter
Tiếp đó là agent datadog sẽ get metrics của prometheus cloudwatch exporter thông qua package: OpenMetrics
https://docs.datadoghq.com/containers/kubernetes/prometheus/?tab=kubernetesadv2
https://docs.datadoghq.com/developers/custom_checks/prometheus/
Bạn sẽ bảo là datadog có thể chủ động lấy metrics từ aws và chỉ cần cung cấp access key và secret key là xong. Nim làm rườm ra quá.
Với cách của bạn thì mình thấy là datadog sẽ cần tạo 1 Lamda để craw data từ Cloudwatch.
Lý do:
1) Hiện tại mình đăng sài bạn free cho homelab thì không tùy ý sài nhiều dịch vụ trên aws, cũng như tạo nhiều instances của datadog được.
2) Hiện tại mình muốn test là làm sao để datadog draw metrics của các endpoints được viết dựa trên package prometheus.
Ví dụ mình muốn monitor keda thông qua endpoint metrics mặc định của keda thì sẽ cần dùng cách OpenMetrics.
2) Configure the monitoring components.
2.1) Install the Cloudwatch exporter.
mình sẽ cài thông qua helm.
REPO URL: https://prometheus-community.github.io/helm-charts
CHART: prometheus-cloudwatch-exporter:0.24.0
Tiếp đến là helm values:
aws:
  aws_access_key_id: XXXXXRU2NYXXXXX
  aws_secret_access_key: XXXXXXXXGpzKfj+L0eXPXXXXXXXX

config: |-
  # This is the default configuration for prometheus-cloudwatch-exporter
  region: us-west-2
  period_seconds: 300
  metrics:
  - aws_namespace: AWS/EBS
    aws_metric_name: VolumeReadOps
    aws_statistics: [Average]
    aws_dimensions: [VolumeId]
Theo mình thì phần căng nhất là bạn chả hiểu làm thể nào để define được cái select đúng không?
Cách đầu tiên bạn cần chọn bừa trên cloudwatch trên web
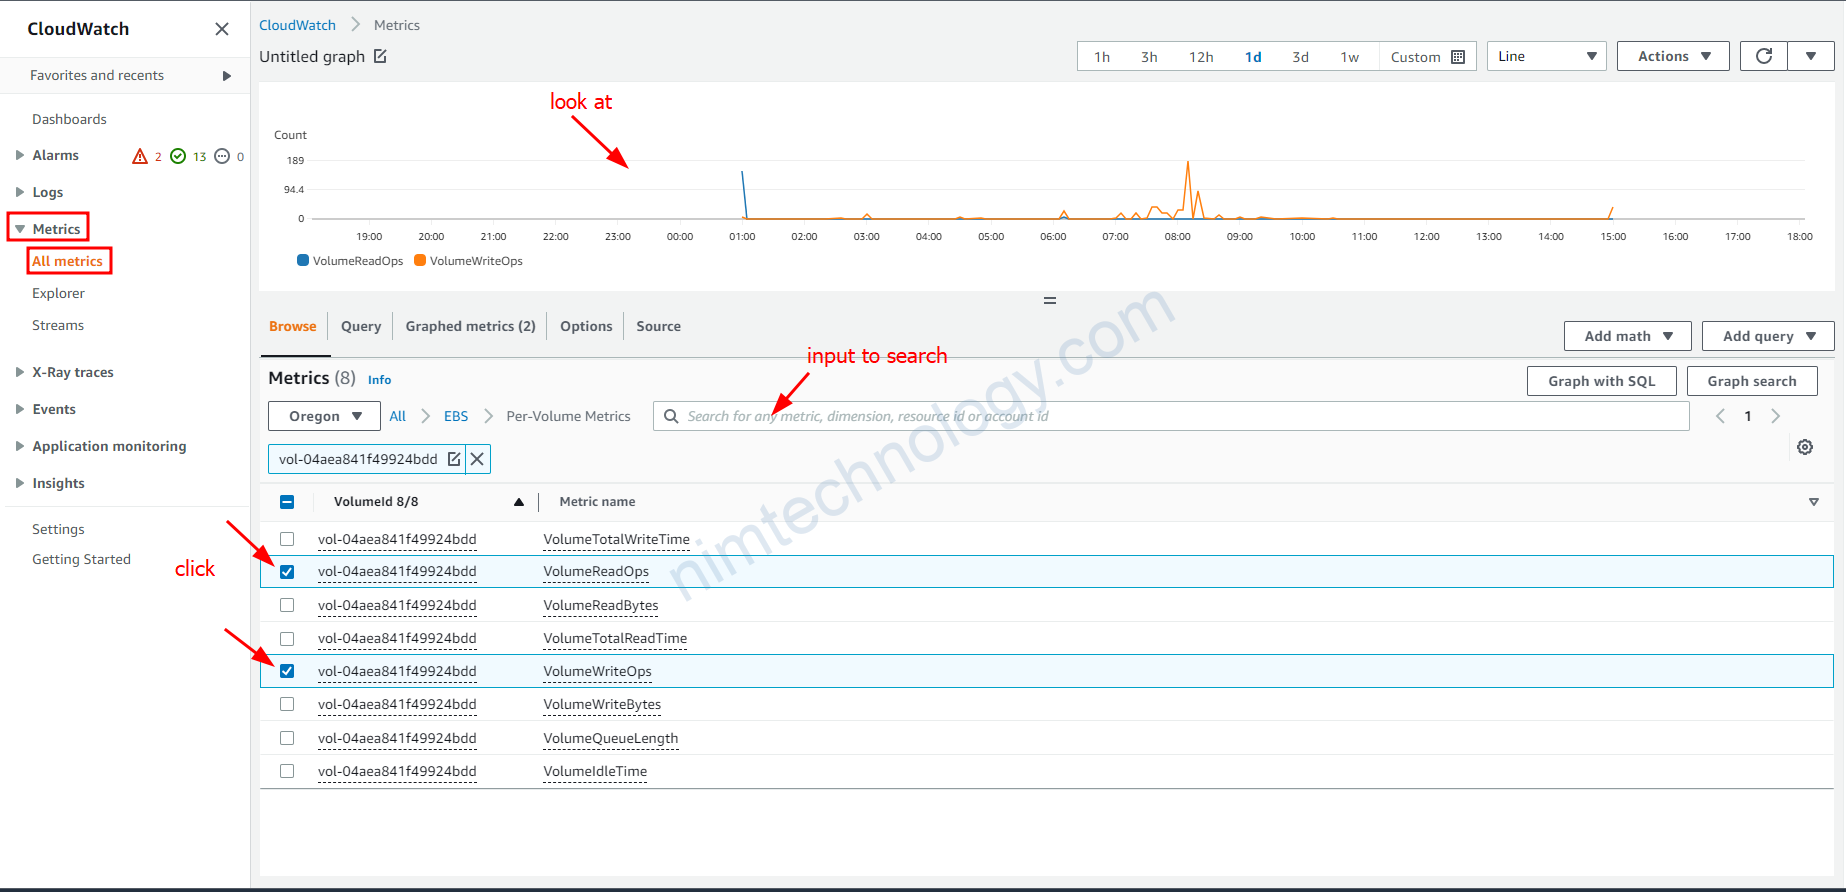
Sau bạn đã chọn các thông số phù hợp thì bạn dùng thêm command để get
aws cloudwatch get-metric-statistics \
--namespace AWS/EBS \
--metric-name VolumeWriteOps \
--start-time 2023-04-04T08:00:00 \
--end-time 2023-04-04T08:15:00 \
--period 300 \
--statistics Average \
--dimensions Name=VolumeId,Value=vol-04aea841f49924bdd \
--profile nimtechnology-staging \
--region us-west-2
Giờ mình cần note vài thứ:
statistics là gì?
sau đây là gợi ý của chatgpt:
To create a chart based on the AWS/EBS VolumeReadOps metric, you can use the CloudWatch console or API to retrieve the data points for the metric over a specific time range, and then plot the data points on a line chart.
Here are some statistics that you can calculate for the VolumeReadOps metric:
- Average: The average number of read operations per second over the specified time range.
- Minimum: The minimum number of read operations per second during the specified time range.
- Maximum: The maximum number of read operations per second during the specified time range.
- Sum: The total number of read operations that occurred during the specified time range.
You can choose any of these statistics to plot on the chart. For example, if you want to show the trend of the average number of read operations over time, you can plot the average statistic as a line chart. Or, if you want to show the total number of read operations over time, you can plot the sum statistic as a stacked area chart.
Lấy aws_metric_name ở đâu?
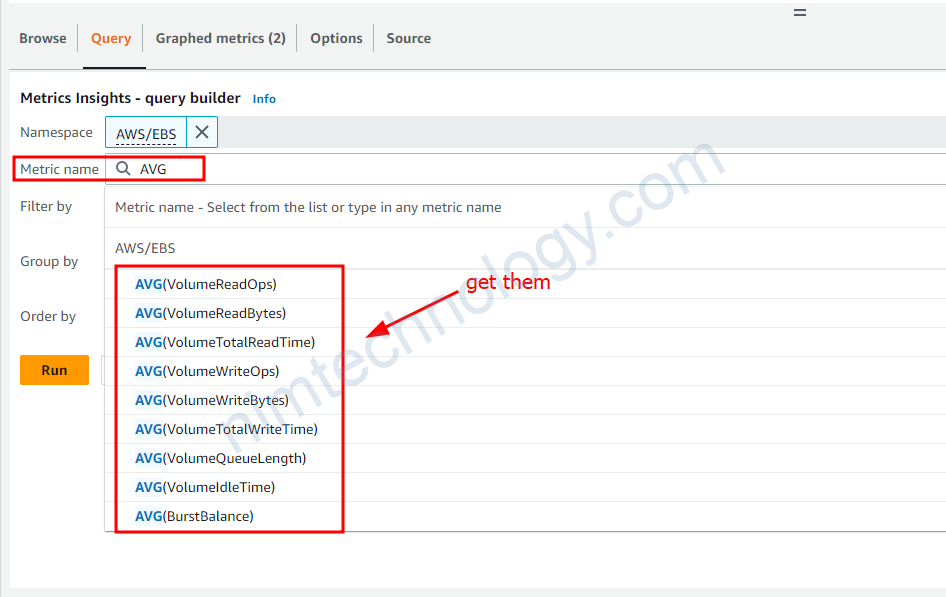
aws_dimensions thì sao?
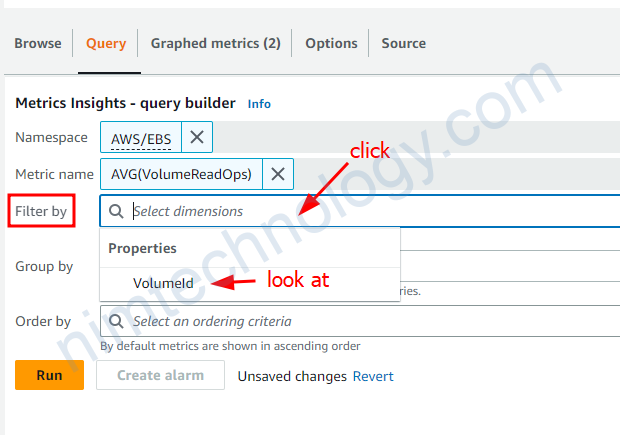
Bạn sẽ lấy nó ở ô filter by nhé
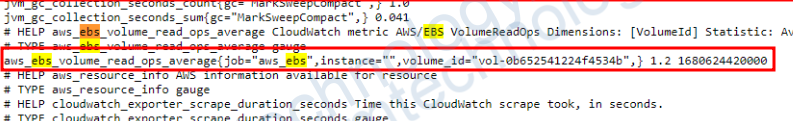
lúc này bạn curl vào enpoind của cloudwatch exporter
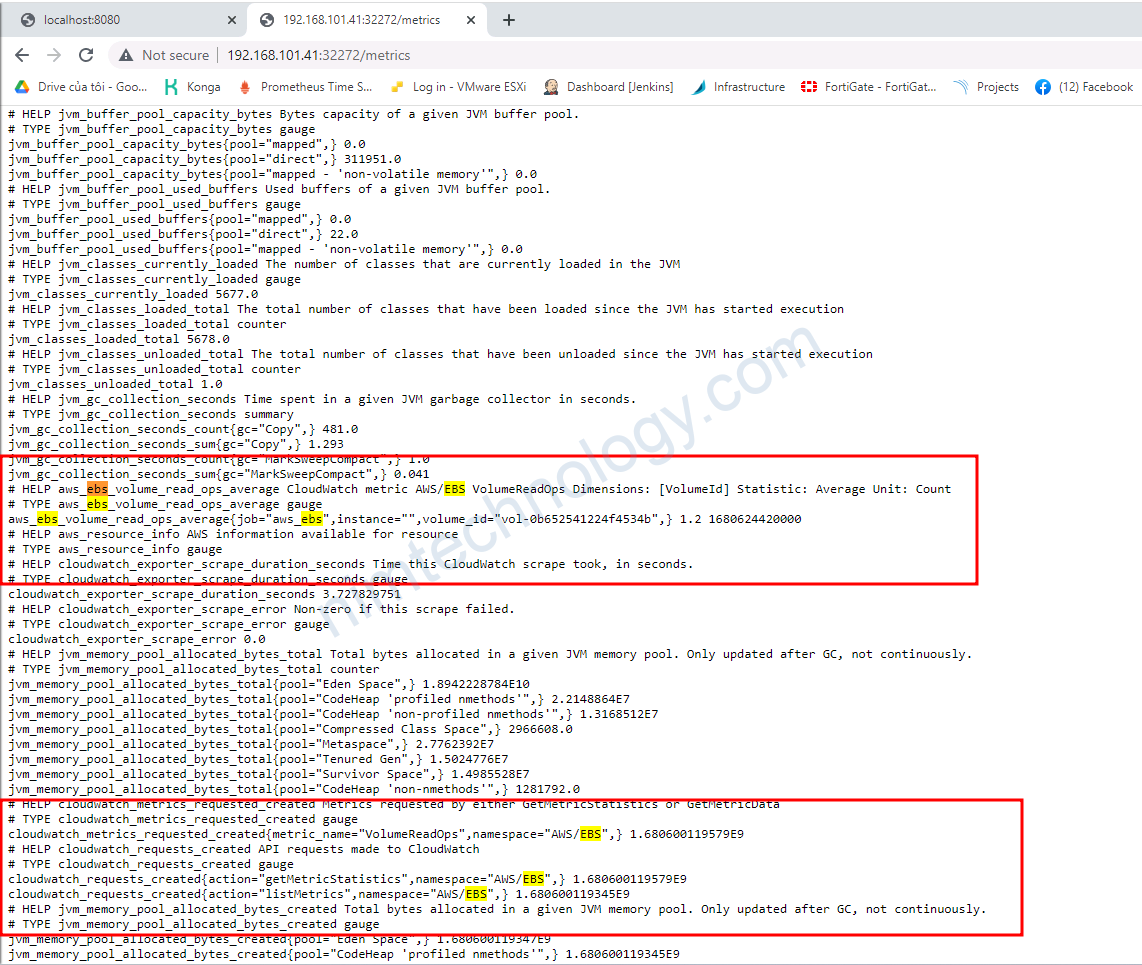
Đã nhận.
Done Cloudwatch exporter!
2.2) Configure DataDog to collect metrics from prometheus-cloudwatch-exporter
Bạn sẽ setup OpenMetrics trên datadog agent để collect metrics từ CloudWatch Exporter.
Bạn sẽ sửa helm value của datadog.
datadog:
  ...
  ...
  confd:
    openmetrics.yaml: |-
      instances:
        - openmetrics_endpoint: http://cloudwatch-prometheus-cloudwatch-exporter.prometheus:9106/metrics
          namespace: cloudwatch
          metrics:
            - aws_ebs_volume_read_ops_average: aws_ebs_volume_read_ops_average
            - aws_ebs_volume_write_ops_average: aws_ebs_volume_write_ops_average
https://docs.datadoghq.com/containers/kubernetes/prometheus/?tab=kubernetesadv2
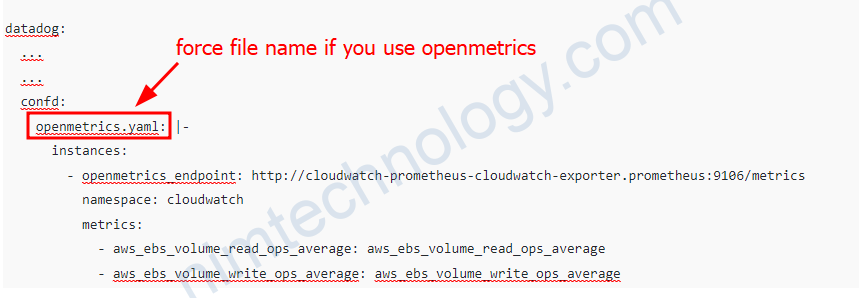
Nếu bạn đặt tên khác nó sẽ lỗi.
namespace: Set namespace to be prefixed to every metric when viewed in Datadog.
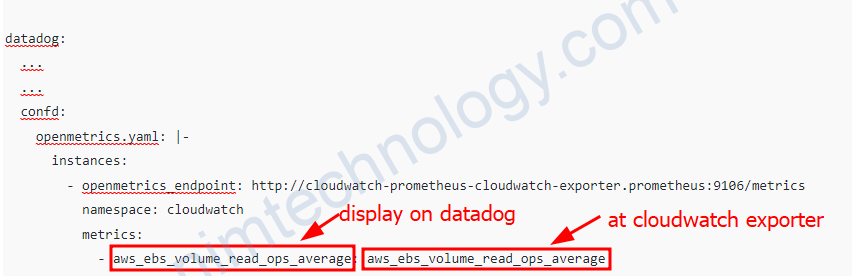
Phần metrics: bạn sẽ chỉ lấy một số metrics và đưa vào datadog thôi ví dụ.
Trong đống metrics đó bạn chỉ lấy: aws_ebs_volume_read_ops_average
The metrics configuration is a list of metrics to retrieve as custom metrics. Include each metric to fetch and the desired metric name in Datadog as key value pairs, for example, {"<METRIC_TO_FETCH>":"<NEW_METRIC_NAME>"}. You can alternatively provide a list of metric names strings, interpreted as regular expressions, to bring the desired metrics with their current names. If you want all metrics, then use ".*" rather than "*".
Note: Regular expressions can potentially send a lot of custom metrics.
For a full list of available parameters for instances, including namespace and metrics, see the sample configuration openmetrics.d/conf.yaml.
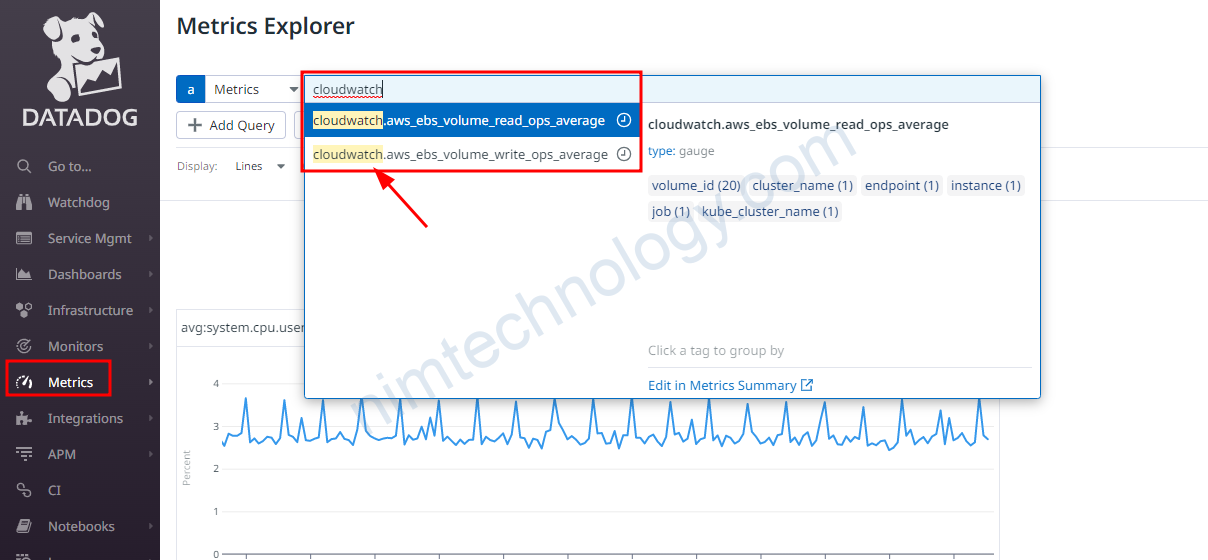
Vậy là datadog đã có metrics của cloudwatch
Solve ISsues.
Read timed out.
Một hôm mạng lag, thể là mình lên datadog mà thấy dashboard ko có data
Dưới đây là log trong datadog agent.
2023-04-17 04:25:19 UTC | CORE | ERROR | (pkg/collector/python/datadog_agent.go:130 in LogMessage) | openmetrics:cloudwatch:6d8b7e1d977e1d09 | (base.py:66) | There was an error scraping endpoint http://cloudwatch-prometheus-cloudwatch-exporter.prometheus:9106/metrics: HTTPConnectionPool(host='cloudwatch-prometheus-cloudwatch-exporter.prometheus', port=9106): Read timed out. (read timeout=10.0)To increase the timeout for the OpenMetrics integration when calling the openmetrics_endpoint, you can add the timeout parameter to the instance configuration in the openmetrics.yaml file. The timeout parameter is specified in seconds.
Here’s an updated version of your configuration snippet with a 30-second timeout:
datadog:
  logs:
    enabled: true
    containerCollectAll: true
  confd:
    openmetrics.yaml: |-
      instances:
        - openmetrics_endpoint: http://cloudwatch-prometheus-cloudwatch-exporter.prometheus:9106/metrics
          namespace: cloudwatch
          metrics:
            - aws_ebs_volume_read_ops_average: aws_ebs_volume_read_ops_average
            - aws_ebs_volume_write_ops_average: aws_ebs_volume_write_ops_average
          timeout: 30
In this example, the timeout for the OpenMetrics integration when calling the specified endpoint is set to 30 seconds. Adjust the value of the timeout parameter to meet your specific requirements.
Nó ở đây Bạn có thể recheck lại.