Hiện tại thì mỉnh sử dụng windows-exporter để monitor windows k8s.
https://github.com/prometheus-community/windows_exporter
Để integrate với windows_exporter thì bạn nên cài trước prometheus_operator.
Mình đang test trên eks 1.24
1) Install the component of windows exporter.
apiVersion: apps/v1
kind: DaemonSet
metadata:
  labels:
    app: windows-exporter
  name: windows-exporter
  namespace: monitoring
spec:
  selector:
    matchLabels:
      app: windows-exporter
  template:
    metadata:
      labels:
        app: windows-exporter
    spec:
      securityContext:
        windowsOptions:
          hostProcess: true
          runAsUserName: "NT AUTHORITY\\system"
      hostNetwork: true
      initContainers:
        - name: configure-firewall
          image: mcr.microsoft.com/windows/nanoserver:1809
          command: ["powershell"]
          args: ["New-NetFirewallRule", "-DisplayName", "'windows-exporter'", "-Direction", "inbound", "-Profile", "Any", "-Action", "Allow", "-LocalPort", "9182", "-Protocol", "TCP"]
      containers:
      - args:
        - --config.file=%CONTAINER_SANDBOX_MOUNT_POINT%/config.yml
        name: windows-exporter
        image: ghcr.io/prometheus-community/windows-exporter:latest
        imagePullPolicy: Always
        ports:
        - containerPort: 9182
          hostPort: 9182
          name: http
        volumeMounts:
        - name:  windows-exporter-config
          mountPath: /config.yml
          subPath: config.yml
      nodeSelector:
        kubernetes.io/os: windows
      volumes:
      - name: windows-exporter-config
        configMap:
          name: windows-exporter-config
---
kind: ConfigMap
apiVersion: v1
metadata:
  name: windows-exporter-config
  namespace: monitoring
  labels:
    app: windows-exporter
data:
  config.yml: |
    collectors:
      enabled: '[defaults],container'
    collector:
      service:
        services-where: "Name='containerd' or Name='kubelet'"


---
apiVersion: v1
kind: Service
metadata:
  name: prometheus-community-prometheus-windows-exporter
  namespace: prometheus
  labels:
    app.kubernetes.io/component: metrics
    app.kubernetes.io/instance: prometheus-community
    app.kubernetes.io/name: prometheus-windows-exporter
    jobLabel: windows-exporter
    release: prometheus-community
  annotations:
    prometheus.io/scrape: 'true'
spec:
  ports:
    - name: http-metrics
      protocol: TCP
      port: 9182
      targetPort: 9182
  selector:
    app: windows-exporter
  type: ClusterIP

---
apiVersion: monitoring.coreos.com/v1
kind: ServiceMonitor
metadata:
  labels:
    app.kubernetes.io/component: metrics
    app.kubernetes.io/instance: prometheus-community
    app.kubernetes.io/name: prometheus-windows-exporter
    app.kubernetes.io/part-of: prometheus-windows-exporter
    jobLabel: windows-exporter
    release: prometheus-community
  name: prometheus-community-prometheus-windows-exporter
  namespace: prometheus
spec:
  endpoints:
    - port: http-metrics
      scheme: http
  jobLabel: jobLabel
  selector:
    matchLabels:
      app.kubernetes.io/instance: prometheus-community
      app.kubernetes.io/name: prometheus-windows-exporter
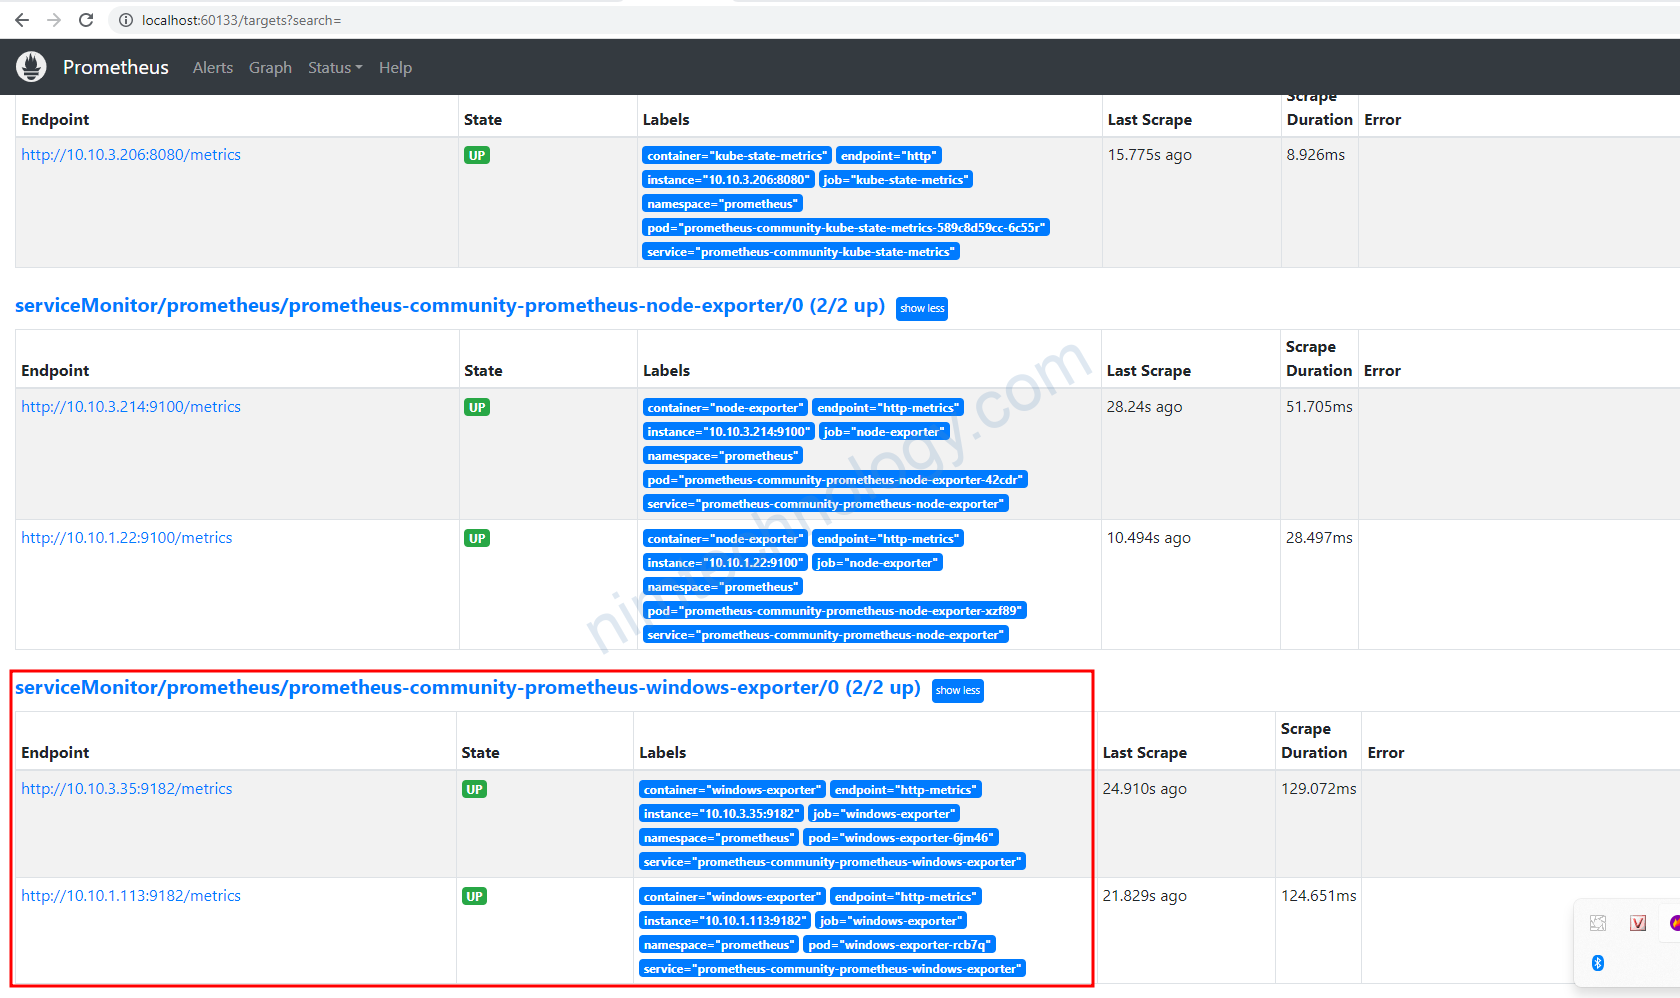
Lúc này thì trên prometheus-operator đang nhận được metrics của windows-exporter.
https://grafana.com/grafana/dashboards/17264-windows-exporter-for-prometheus-dashboard-en-v20221026/
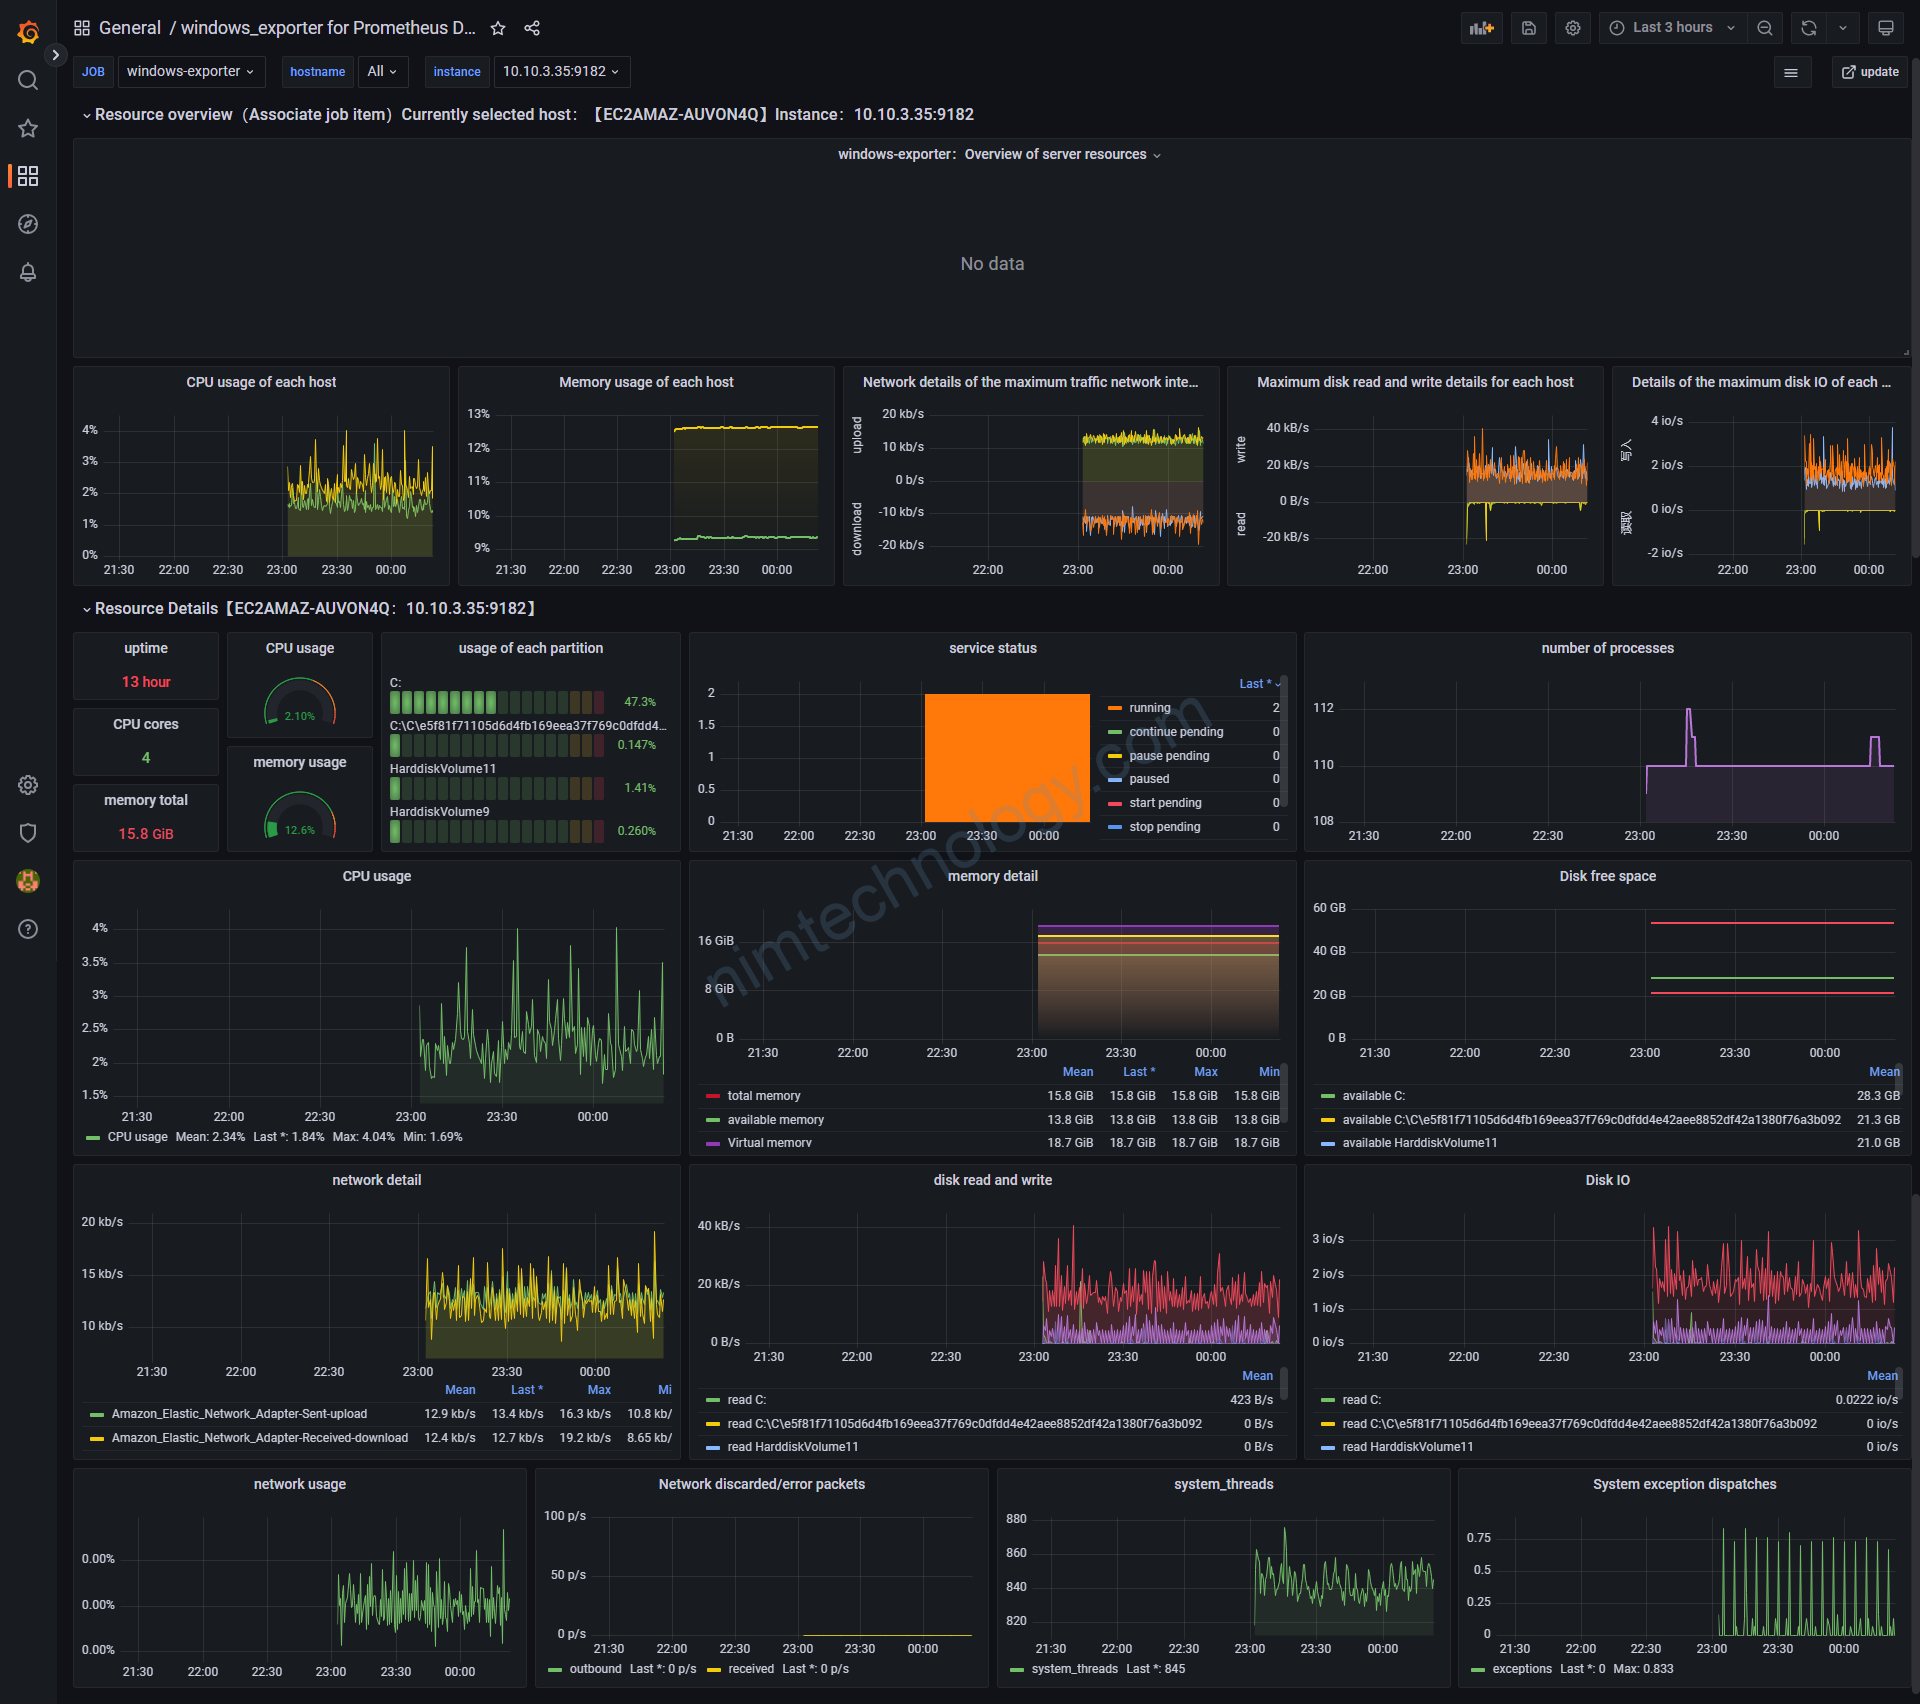
Hiện tại mình chỉ thấy là nó monitor được con node windows.
chứ không monitor được các pod windows trong k8s windows