Skip to content

NimTechnology

Trình bày các công nghệ CLOUD một cách dễ hiểu.

  • Kubernetes & Container
    • Docker
    • Kubernetes
      • Ingress
      • Pod
    • Helm Chart
    • OAuth2 Proxy
    • Isito-EnvoyFilter
    • Apache Kafka
      • Kafka
      • Kafka Connect
      • Lenses
    • Vault
    • Longhorn – Storage
    • VictoriaMetrics
    • MetalLB
    • Kong Gateway
  • CI/CD
    • ArgoCD
    • ArgoWorkflows
    • Argo Events
    • Spinnaker
    • Jenkins
    • Harbor
    • TeamCity
    • Git
      • Bitbucket
  • Coding
    • DevSecOps
    • Terraform
      • GCP – Google Cloud
      • AWS – Amazon Web Service
      • Azure Cloud
    • Golang
    • Laravel
    • Python
    • Jquery & JavaScript
    • Selenium
  • Log, Monitor & Tracing
    • DataDog
    • Prometheus
    • Grafana
    • ELK
      • Kibana
      • Logstash
  • BareMetal
    • NextCloud
  • Toggle search form

[Prometheus] filter or allowlist metrics before sending to the remote storage via remote_write in Prometheus

Posted on September 14, 2023January 11, 2024 By nim No Comments on [Prometheus] filter or allowlist metrics before sending to the remote storage via remote_write in Prometheus

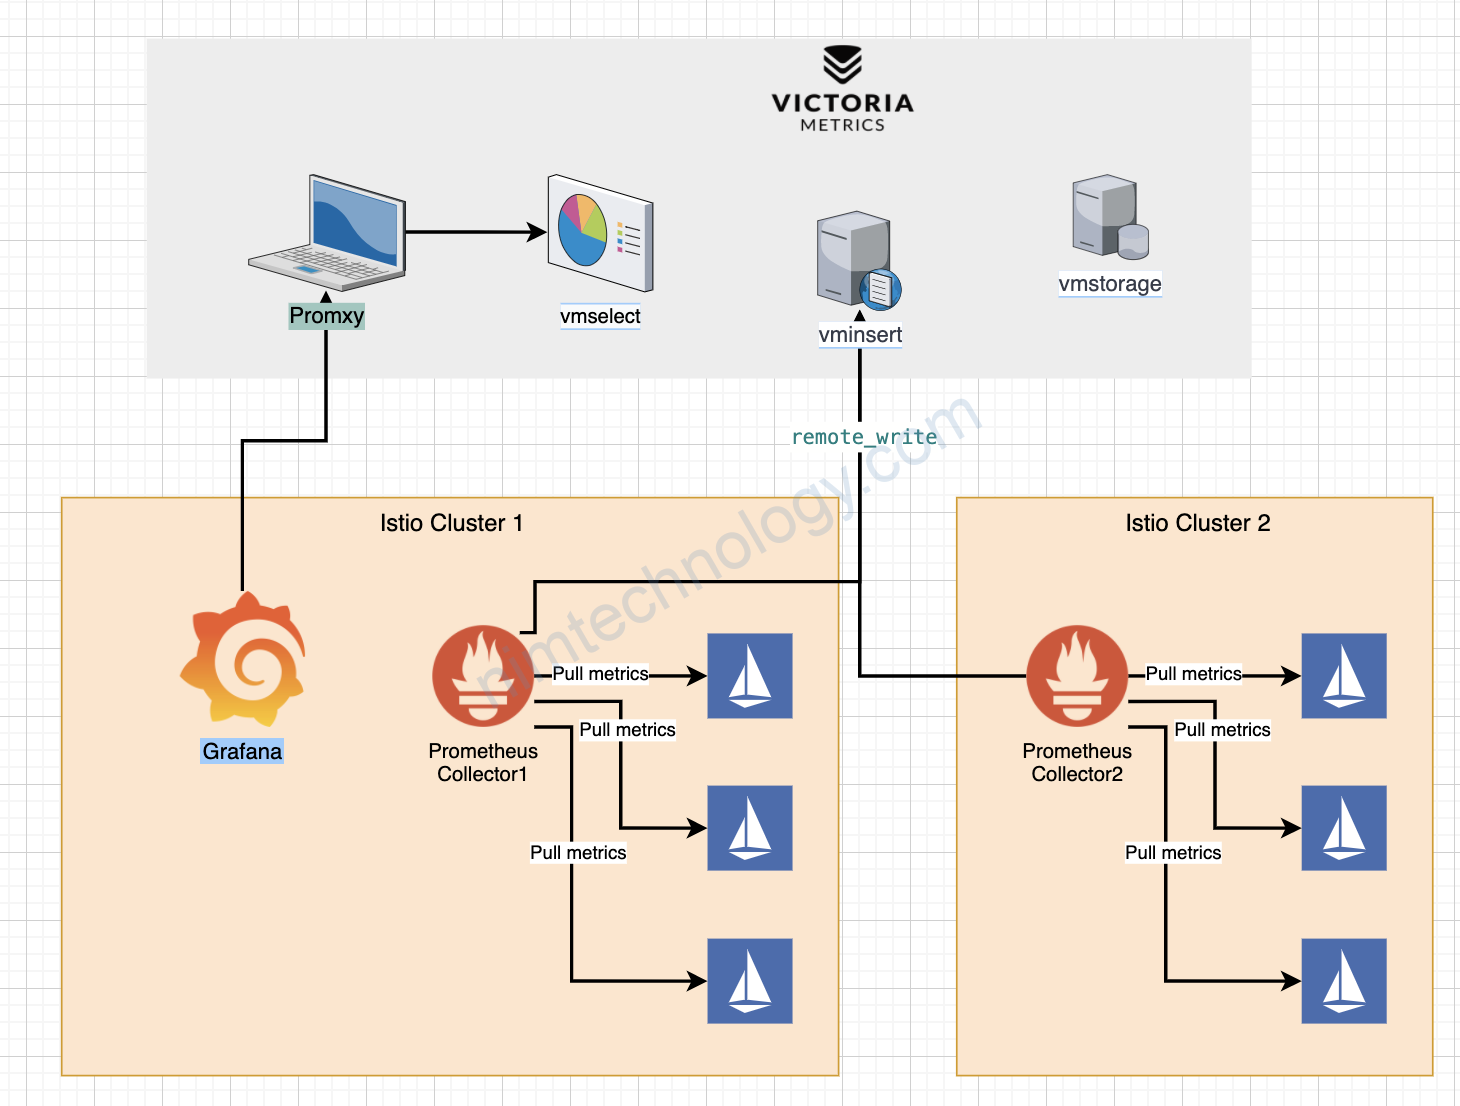
There are a few options to filter or allowlist metrics before they are sent to the remote storage via remote_write in Prometheus:

Contents

Toggle
  • 1. Use metric relabeling
  • 2. Use PromQL recording rules

1. Use metric relabeling

You can configure relabelling rules on the remote_write config to filter or transform metrics before they are sent. For example:

with metrics:
my_metric_http{status_code=200, cluster=nim] 100
my_metric_http{status_code=500, cluster=nim] 100
k8s_metric_memory{container=web, cluster=nim] 100

remote_write:
  - url: http://remote-storage:9201/write
    write_relabel_configs:
      - source_labels: [__name__]
        regex: ^my_metric_.*
        action: keep

This would only keep metrics matching the regex ^my_metric_.* and drop all others.
We will have the metrics:
my_metric_http{status_code=200, cluster=nim] 100
my_metric_http{status_code=500, cluster=nim] 100

Continuously, you can filter metrics based on the labels in side metrics

            remoteWrite:
              - url: http://remote-storage:9201/write
                name: 'staging-engines'
                remote_timeout: 120s
                bearer_token_file: /etc/secrets/bearer-token-coralogix.txt
                write_relabel_configs:
                  - source_labels: ["status_code"]
                    regex: "^200$"
                    action: keep

Through the above filter. the metrics will be approved such as:
my_metric_http{status_code=200, cluster=nim] 100

2. Use PromQL recording rules

You can create recording rules that match your allowlist metrics and output them to new metrics. Then scrape those rules instead of the original metrics.

  1. Create a separate rules file for your allowlist, for example allowlist_rules.yml
  2. Define a recording rule for each metric you want to allowlist. The rule should match the original metric name and output it to a new metric name prefixed with something like allowlisted_. For example:
groups:
- name: allowlist
  rules:
  - record: allowlisted_http_requests_total
    expr: http_requests_total

  - record: allowlisted_api_latency_seconds
    expr: api_latency_seconds
  1. In prometheus.yml configuration, load this new rules file:
rule_files:
  - "/path/to/allowlist_rules.yml"
  1. Configure your remote_write target to only scrape the Prometheus /api/v1/rules endpoint rather than /api/v1/metrics. This ensures it will only get the allowlisted metrics generated from the recording rules. For example:
remote_write:
  - url: https://remote-storage/write
    basic_auth:
      username: prom
      password: rules
    scrape_configs:
      - job_name: 'allowlisted'
        metrics_path: /api/v1/rules
  1. Reload Prometheus configuration for the rules and remote_write to take effect.
Prometheus

Post navigation

Previous Post: [DevSecOps] Mutation testing
Next Post: [Python] Python connects MongoDB

More Related Articles

[Grafana/Prometheus] Design chart for bucket metrics to Grafana Grafana
[Prometheus] Prometheus to use monitoring k8s Prometheus
[Prometheus – Grafana – Monitoring] Look into rate and irate, min, max, average and latest over a specific time. Prometheus
[Prometheus/Grafana] Install Prometheus and Grafana on ubuntu. BareMetal
[Prometheus] TIP – Custom Prometheus Log, Monitor & Tracing
[VictoriaMetrics/Grafana/Prometheus/Kiali] VictoriaMetrics is a fast, cost-effective and scalable time series database Grafana

Leave a Reply Cancel reply

Your email address will not be published. Required fields are marked *

Tham Gia Group DevOps nhé!
Để Nim có nhiều động lực ra nhiều bài viết.
Để nhận được những thông báo mới nhất.

Recent Posts

  • [WordPress] Hướng dấn gửi mail trên WordPress thông qua gmail. June 15, 2025
  • [Bitbucket] Git Clone/Pull/Push with Bitbucket through API Token. June 12, 2025
  • [Teamcity] How to transfer the value from pipeline A to pipeline B June 9, 2025
  • [Windows] Remove the process that consumes too much CPU. June 3, 2025
  • Deploying Web-Based File Managers: File Browser and KubeFileBrowser with Docker and Kubernetes June 3, 2025

Archives

  • June 2025
  • May 2025
  • April 2025
  • March 2025
  • February 2025
  • January 2025
  • December 2024
  • November 2024
  • October 2024
  • September 2024
  • August 2024
  • July 2024
  • June 2024
  • May 2024
  • April 2024
  • March 2024
  • February 2024
  • January 2024
  • December 2023
  • November 2023
  • October 2023
  • September 2023
  • August 2023
  • July 2023
  • June 2023
  • May 2023
  • April 2023
  • March 2023
  • February 2023
  • January 2023
  • December 2022
  • November 2022
  • October 2022
  • September 2022
  • August 2022
  • July 2022
  • June 2022
  • May 2022
  • April 2022
  • March 2022
  • February 2022
  • January 2022
  • December 2021
  • November 2021
  • October 2021
  • September 2021
  • August 2021
  • July 2021
  • June 2021

Categories

  • BareMetal
    • NextCloud
  • CI/CD
    • Argo Events
    • ArgoCD
    • ArgoWorkflows
    • Git
      • Bitbucket
    • Harbor
    • Jenkins
    • Spinnaker
    • TeamCity
  • Coding
    • DevSecOps
    • Golang
    • Jquery & JavaScript
    • Laravel
    • NextJS 14 & ReactJS & Type Script
    • Python
    • Selenium
    • Terraform
      • AWS – Amazon Web Service
      • Azure Cloud
      • GCP – Google Cloud
  • Kubernetes & Container
    • Apache Kafka
      • Kafka
      • Kafka Connect
      • Lenses
    • Docker
    • Helm Chart
    • Isito-EnvoyFilter
    • Kong Gateway
    • Kubernetes
      • Ingress
      • Pod
    • Longhorn – Storage
    • MetalLB
    • OAuth2 Proxy
    • Vault
    • VictoriaMetrics
  • Log, Monitor & Tracing
    • DataDog
    • ELK
      • Kibana
      • Logstash
    • Fluent
    • Grafana
    • Prometheus
  • Uncategorized
  • Admin

Copyright © 2025 NimTechnology.