Sau bao ngày chạy Openvpn thì cuồi cùng đã monitor được
https://kifarunix.com/monitor-openvpn-connections-with-prometheus-and-grafana/
1) Install Golang
1.1) Raspberry (chipset armvX)
wget https://redirector.gvt1.com/edgedl/go/go1.15.2.linux-armv6l.tar.gz
tar -C /usr/local -xvf go1.15.2.linux-armv6l.tar.gz
export PATH=$PATH:/usr/local/go/bin
1.2) Ubuntu (not chipset armvX)
wget https://golang.org/dl/go1.15.2.linux-amd64.tar.gz
tar -C /usr/local -xzf go1.15.2.linux-amd64.tar.gz
export PATH=$PATH:/usr/local/go/bin
2) Download openvpn_exporter and config
mkdir openvpn_exporter
wget https://github.com/kumina/openvpn_exporter/archive/v0.3.0.tar.gz
tar xzf v0.3.0.tar.gz
cd openvpn_exporter-0.3.0/
vi main.go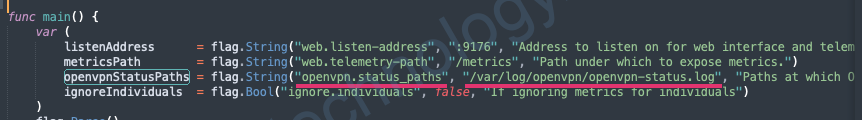
Bạn nhớ kiểm tra file log status của bạn ở đâu nhé
func main() {
	var (
		listenAddress      = flag.String("web.listen-address", ":9176", "Address to listen on for web interface and telemetry.")
		metricsPath        = flag.String("web.telemetry-path", "/metrics", "Path under which to expose metrics.")
		openvpnStatusPaths = flag.String("openvpn.status_paths", "/var/log/openvpn/status.log", "Paths at which OpenVPN places its status files.")
		ignoreIndividuals  = flag.Bool("ignore.individuals", false, "If ignoring metrics for individuals")
	)
	flag.Parse()
GIờ tiến hành build file.
go build -o openvpn_exporter main.goThe suggestion of @Burak Serdar to re-install Go fixed the issue.
The problem happened because I installed new version of Go on top a previous one.
Nếu bị fail
Fail to build with code Go: “redeclared in this block” [duplicate]
The solution:
1. Remove Go: rm -rvf /usr/local/go/
2. Install it again from Golang website:
cd ~/go/Downloads
// Depends on the version you download
tar -C /usr/local -xzf go1.14.4.linux-amd64.tar.gz
export PATH=$PATH:/usr/local/go/bin
cd ~/go/src/myproj/
go build
// no errors

cp openvpn_exporter /usr/local/bin/
openvpn_exporter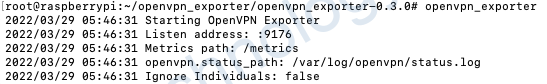
Sau đó bạn truy cập vào trang web:
http://<IP-openvpn-server>:9176/metrics
Nếu bạn bị lỗi:
Failed to scrape showq socket: unexpected file contents: “OpenVPN CLIENT LIS”
https://github.com/kumina/openvpn_exporter/issues/16
bạn sẽ cần thêm "status-version 3" vào file /etc/openvpn/server.conf
status /var/log/openvpn/status.log
status-version 3
3) Config on Prometheus
  ## Add OpenVPN Node Exporter
  - job_name: 'openvpn-metrics'
    scrape_interval: 5s
    static_configs:
    - targets:
      - <IP-OpenVPN-Server>:9176
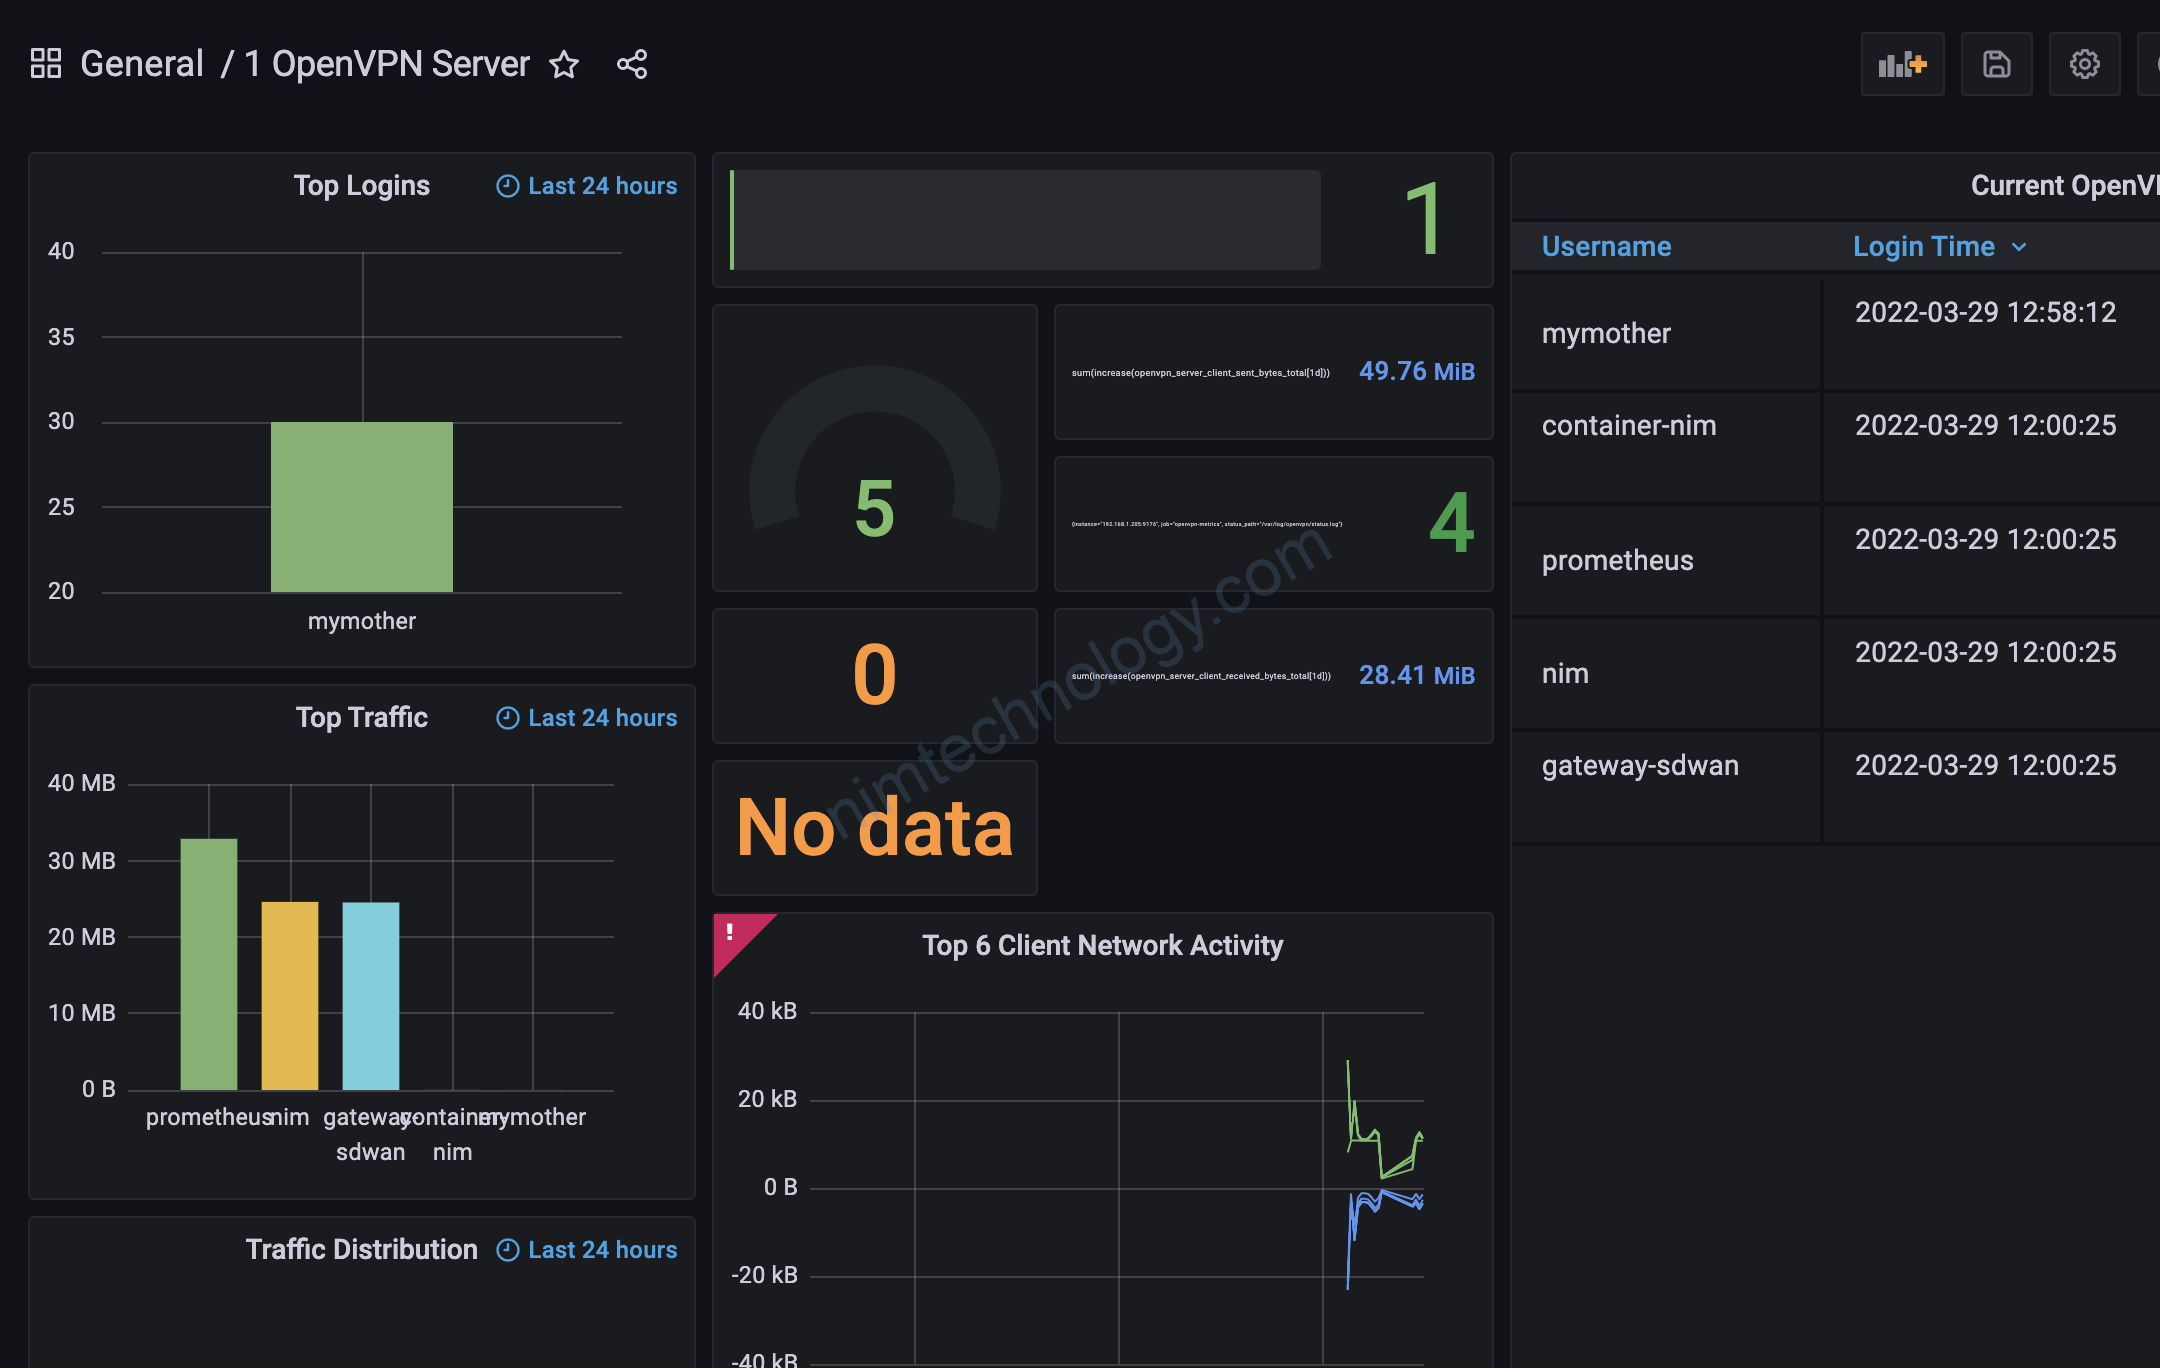
4) Config on Grafana
Bạn sẽ sài cái chart này:
For instance, we took the community dashboard from https://grafana.com/grafana/dashboards/10562 and modified it to fit our needs.

Nếu gặp lỗi trên thì:
grafana-cli plugins install grafana-piechart-panel
5) Running OpenVPN Node Exporter as a Service
vi /etc/systemd/system/openvpn_exporter.service
[Unit]
Description=Prometheus OpenVPN Node Exporter
Wants=network-online.target
After=network-online.target

[Service]
Type=simple
ExecStart=/usr/local/bin/openvpn_exporter

[Install]
WantedBy=multi-user.target
Giờ khởi động lại service
systemctl daemon-reload
systemctl enable --now openvpn_exporter.service
systemctl status openvpn_exporter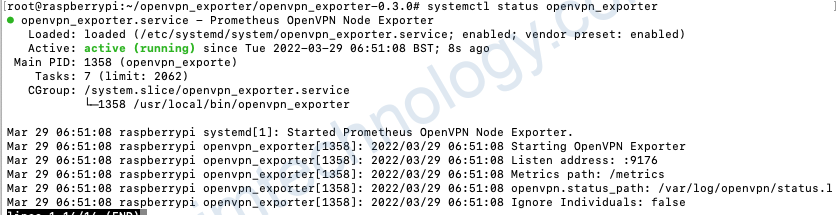
6) Docker
To use with docker you must mount your status file to /etc/openvpn_exporter/server.status.
docker run -p 9176:9176 \
  -v /path/to/openvpn_server.status:/etc/openvpn_exporter/server.status \
  kumina/openvpn-exporter -openvpn.status_paths /etc/openvpn_exporter/server.status
Metrics should be available at http://localhost:9176/metrics.