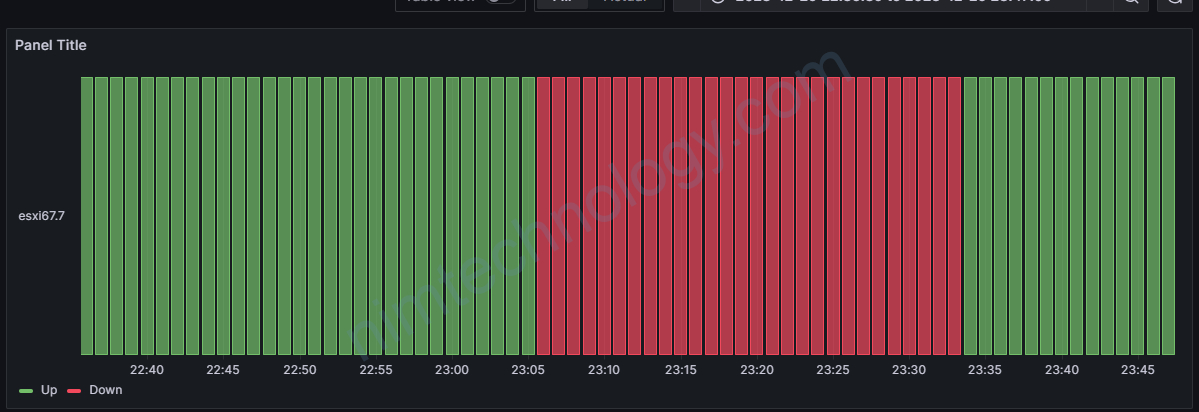
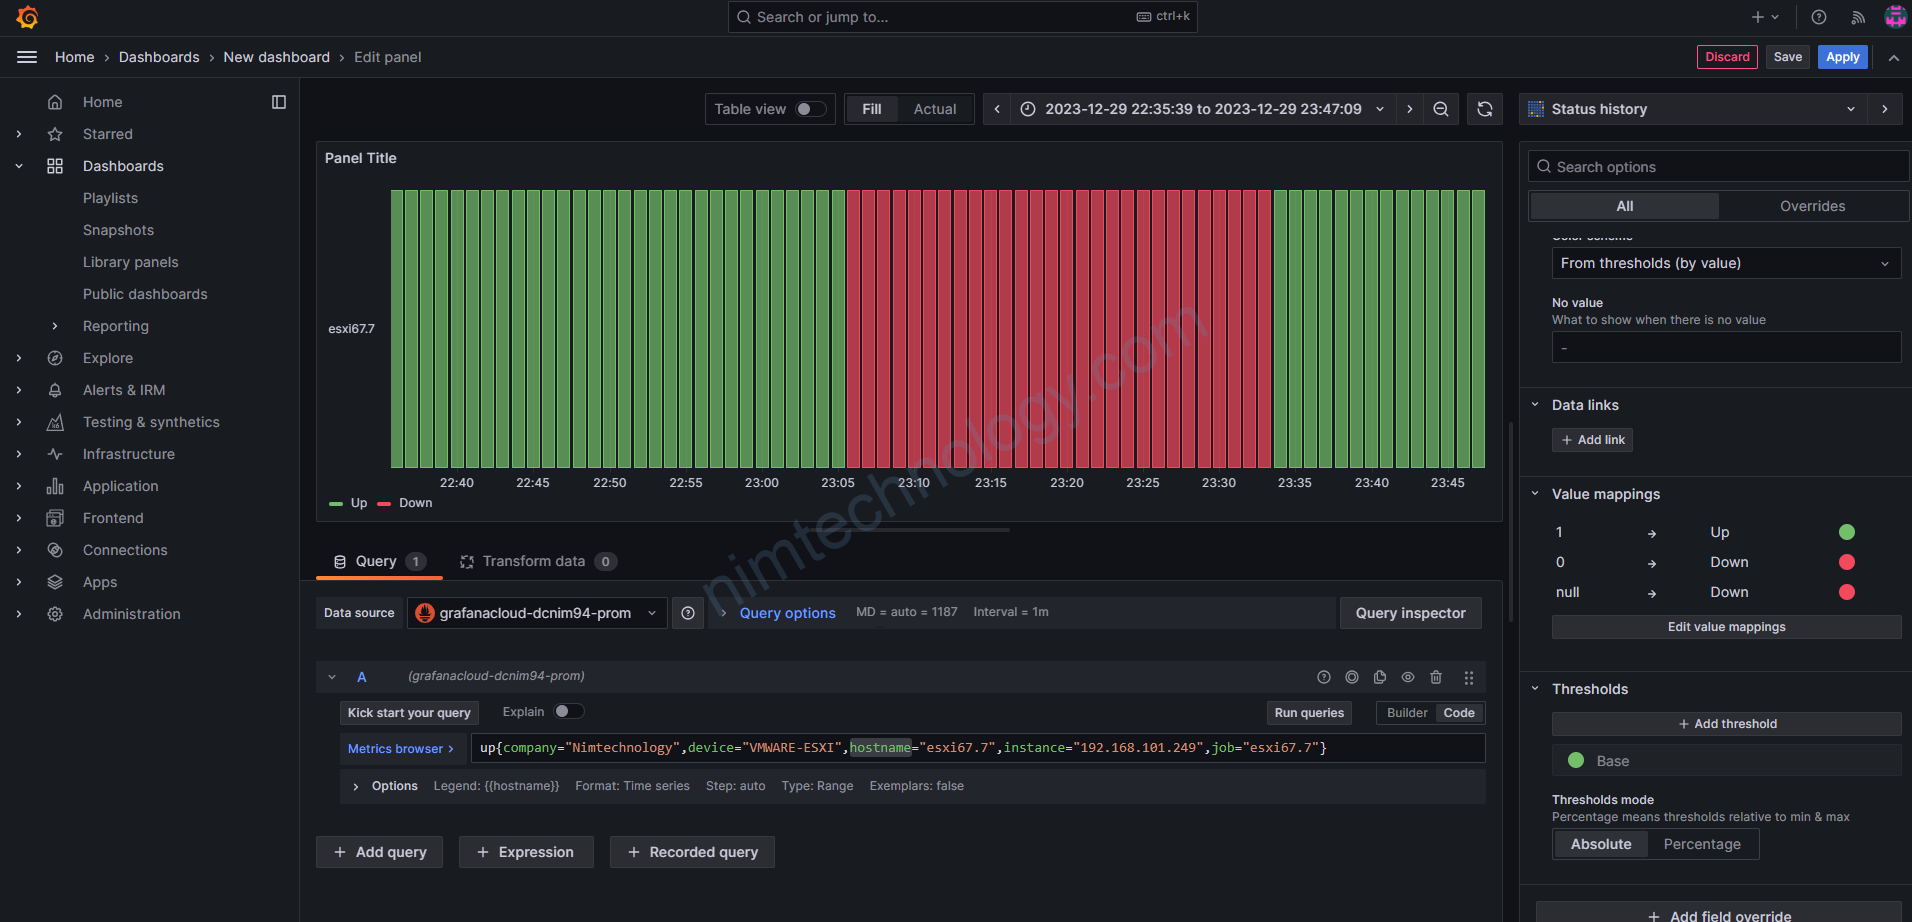
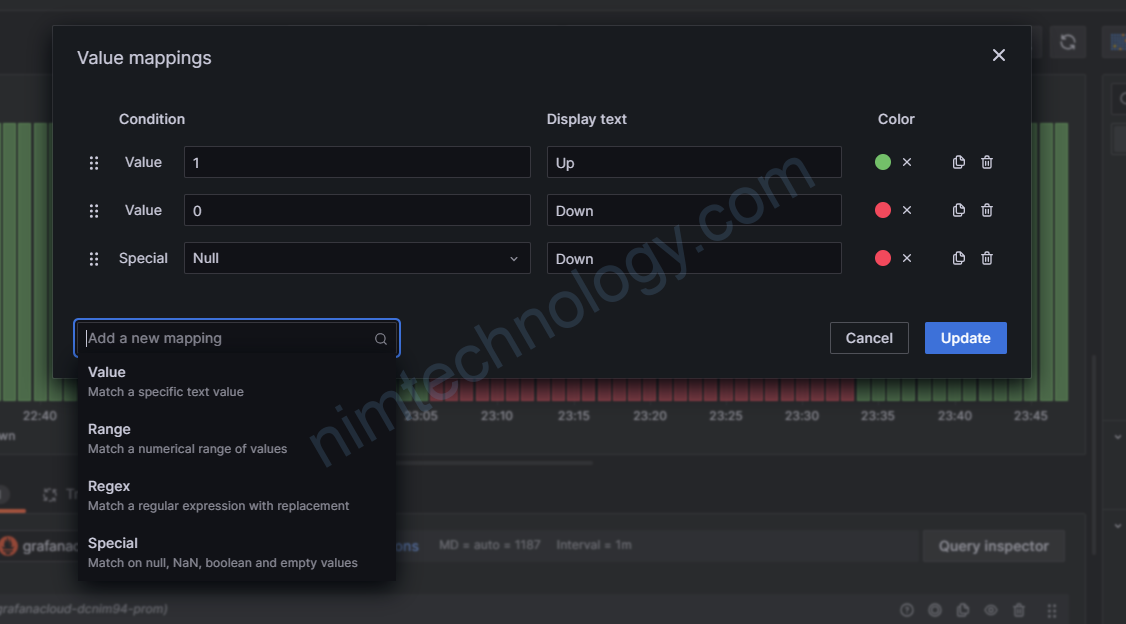
Bạn có một metrics up{label=”xxx”} = 1 thì sẽ là Up
https://grafana.com/docs/grafana/latest/panels-visualizations/configure-value-mappings/
https://grafana.com/docs/grafana/latest/panels-visualizations/visualizations/status-history/
Ngoài ra bạn cũng có thể vẽ được chart percent dửa trên metrics uptime 0/1
Với metrics uptime của Uptime Kuma thì mình gặp lỗi bên dưới:
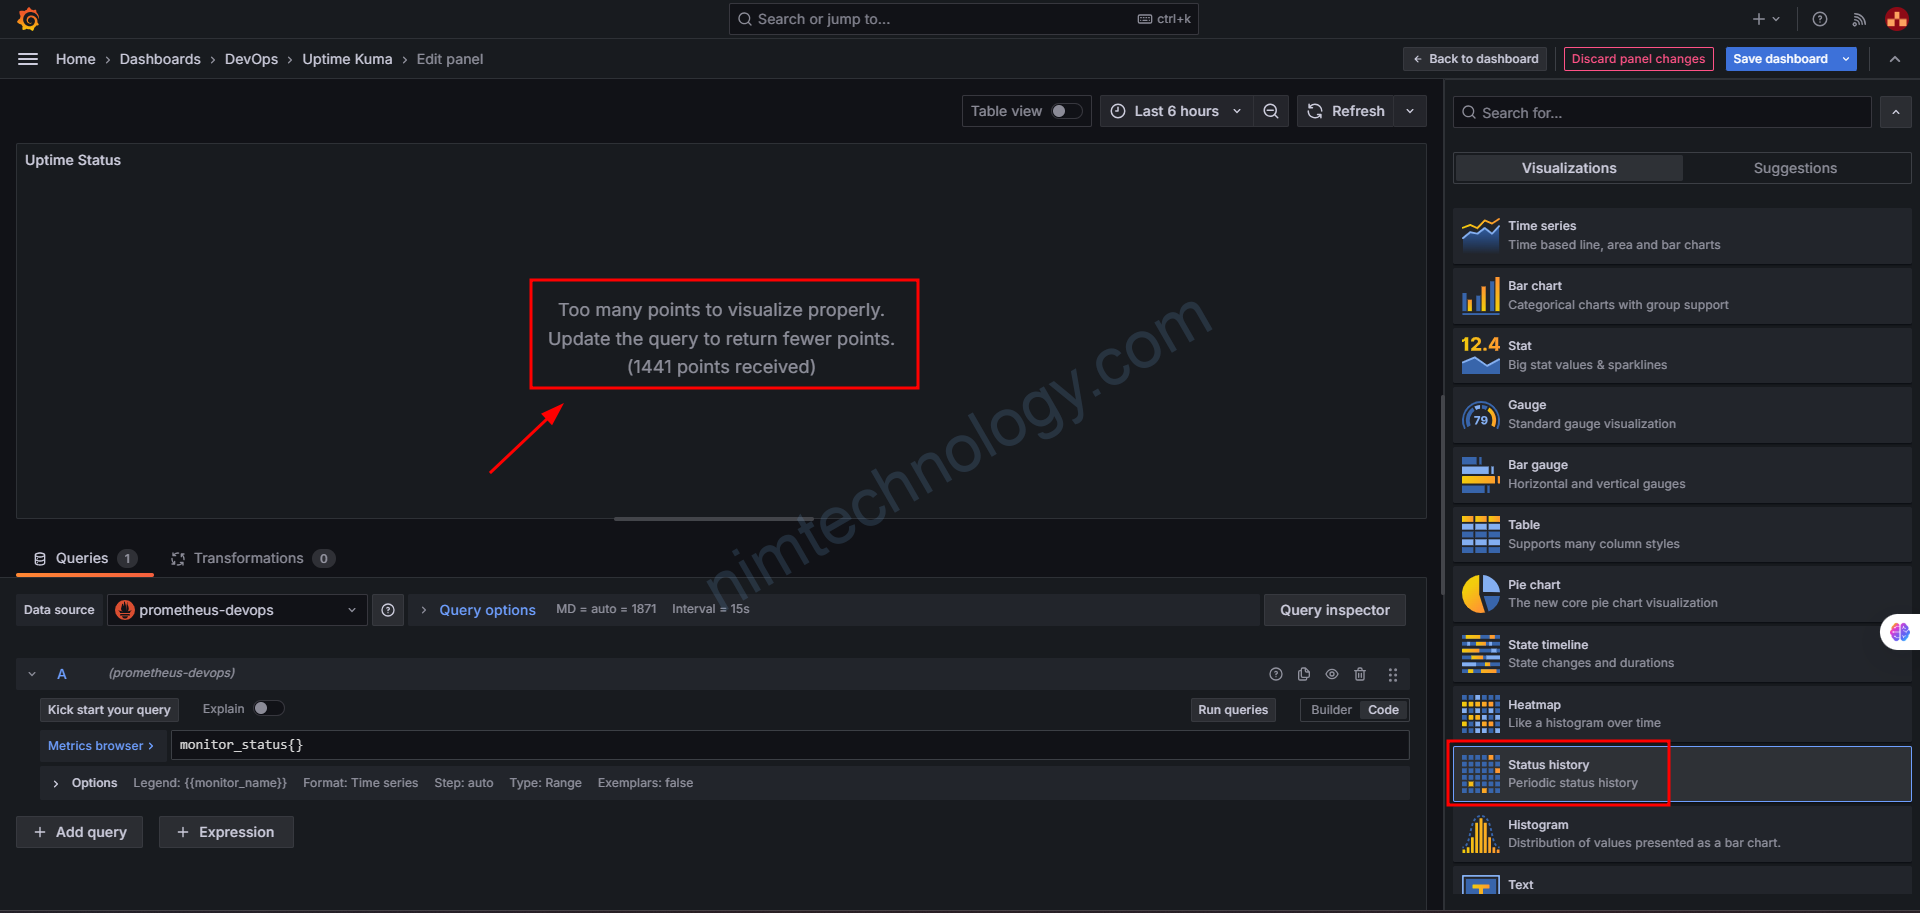
Too many points to visualize properly.
Update the query to return fewer points.
(1441 points received)
Nếu bạn gặp trường hợp này thì bạn có thể sử dụng heatmap
Một số option mà bạn cần edit khi sử dụng
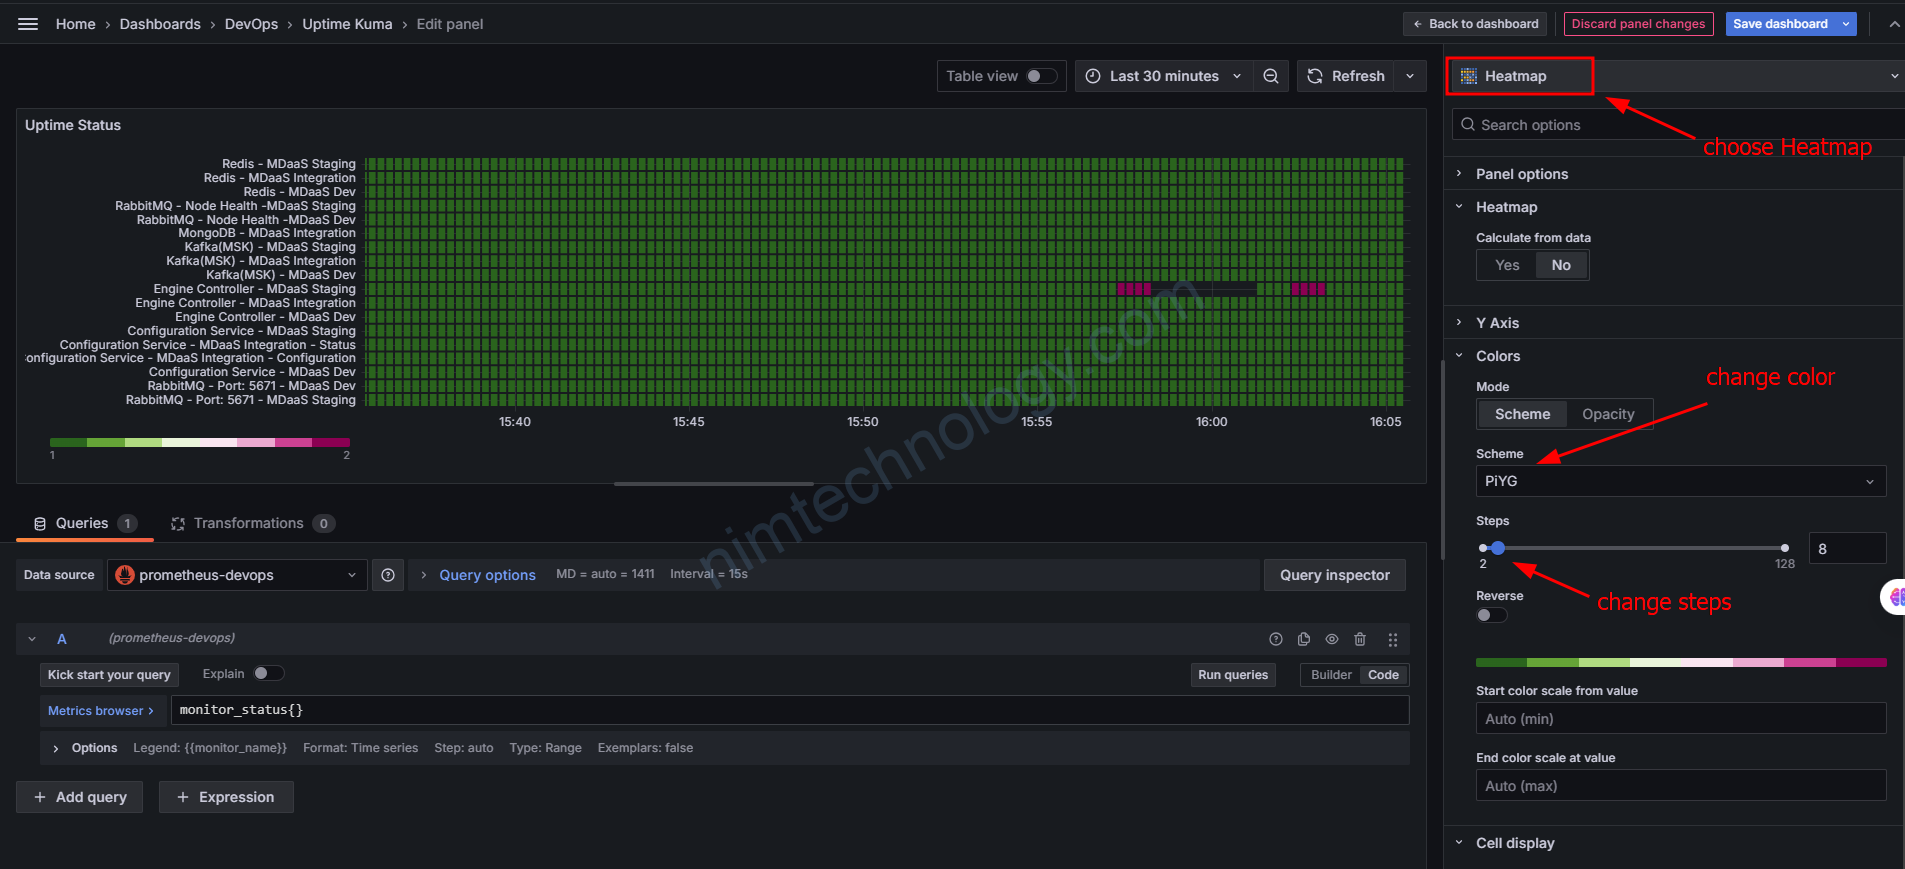
Bạn chọn type chart là heatmap
Tiếp đến bạn thay đổi scheme để đổi màu của đồ thị
Steps để chỉnh sự tưởng phản màu của các số.