Link thao khảo:
https://dzone.com/articles/creating-custom-kibana-visualizations
https://qiita.com/j-yama/items/81f0ea6cf967b3bc7203
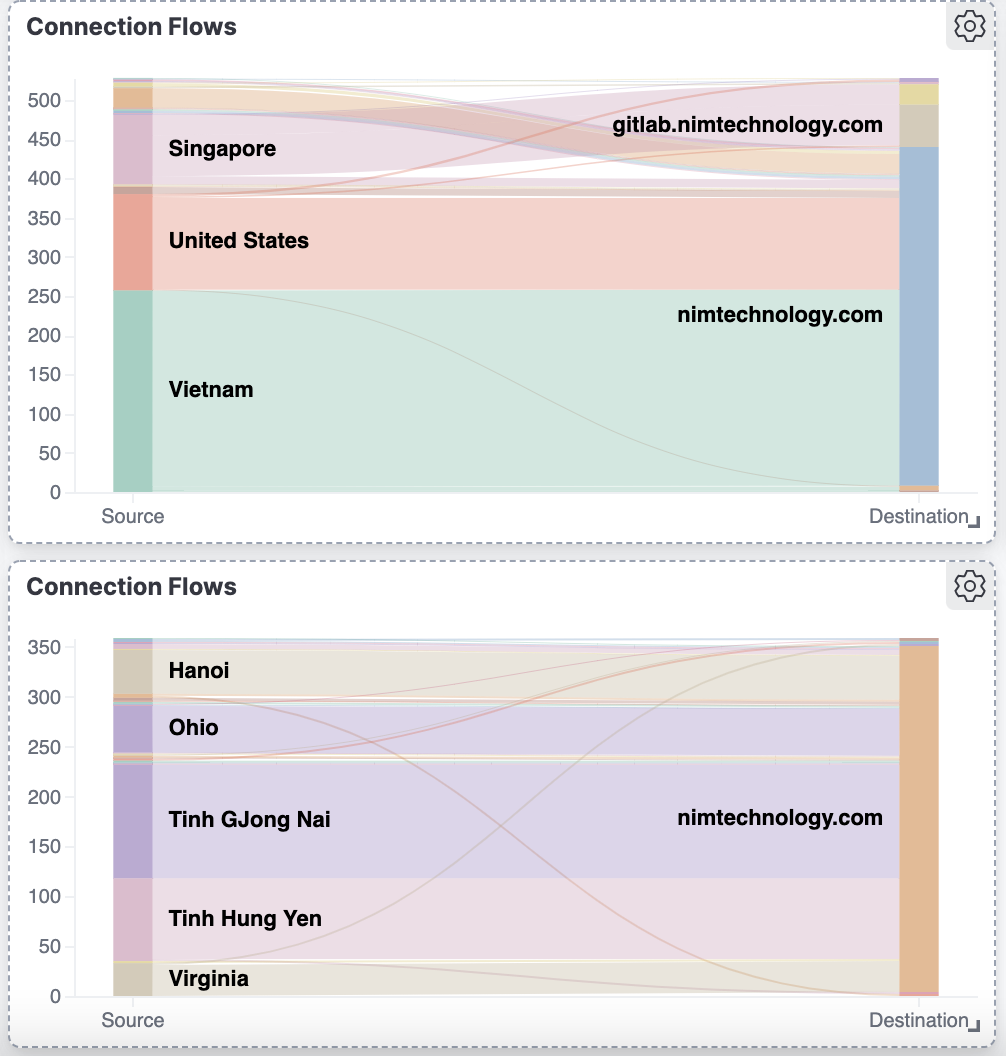
Mình đã từng thấy chart này trong khoá học dậy elk stack của itforvn và mình cũng mới bật log trên server fortigate của mình
Mình nảy ra 1 ý tưởng là sẽ tạo chart thể hiện source ip là các server của mình đi đâu?
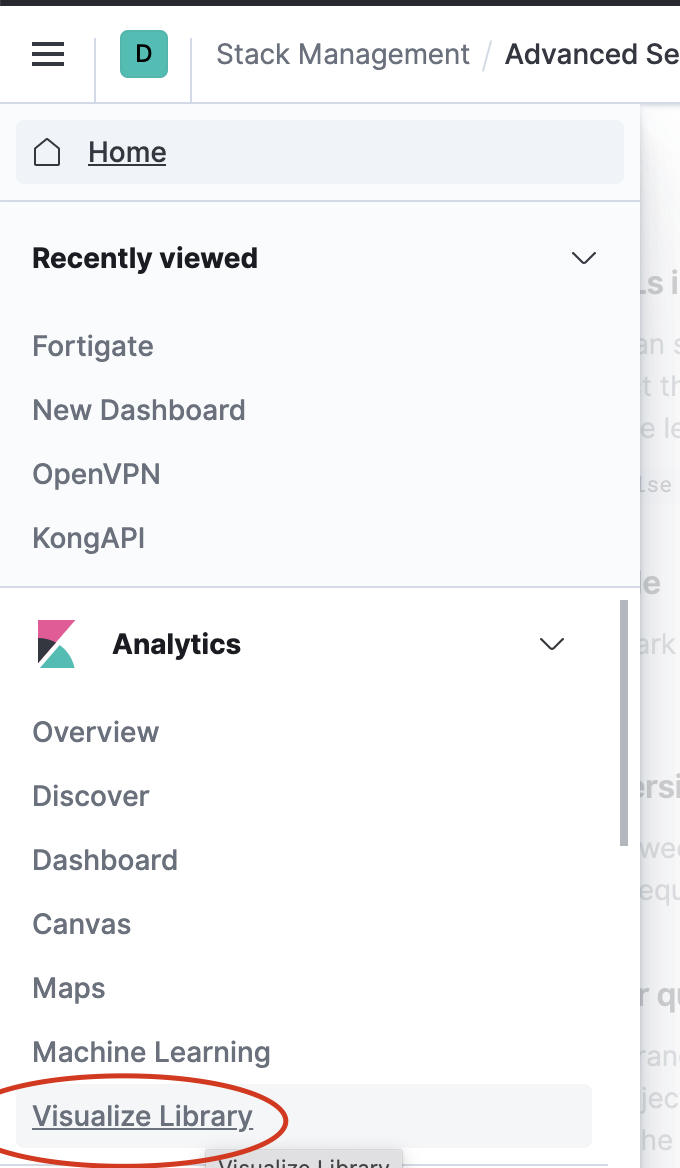
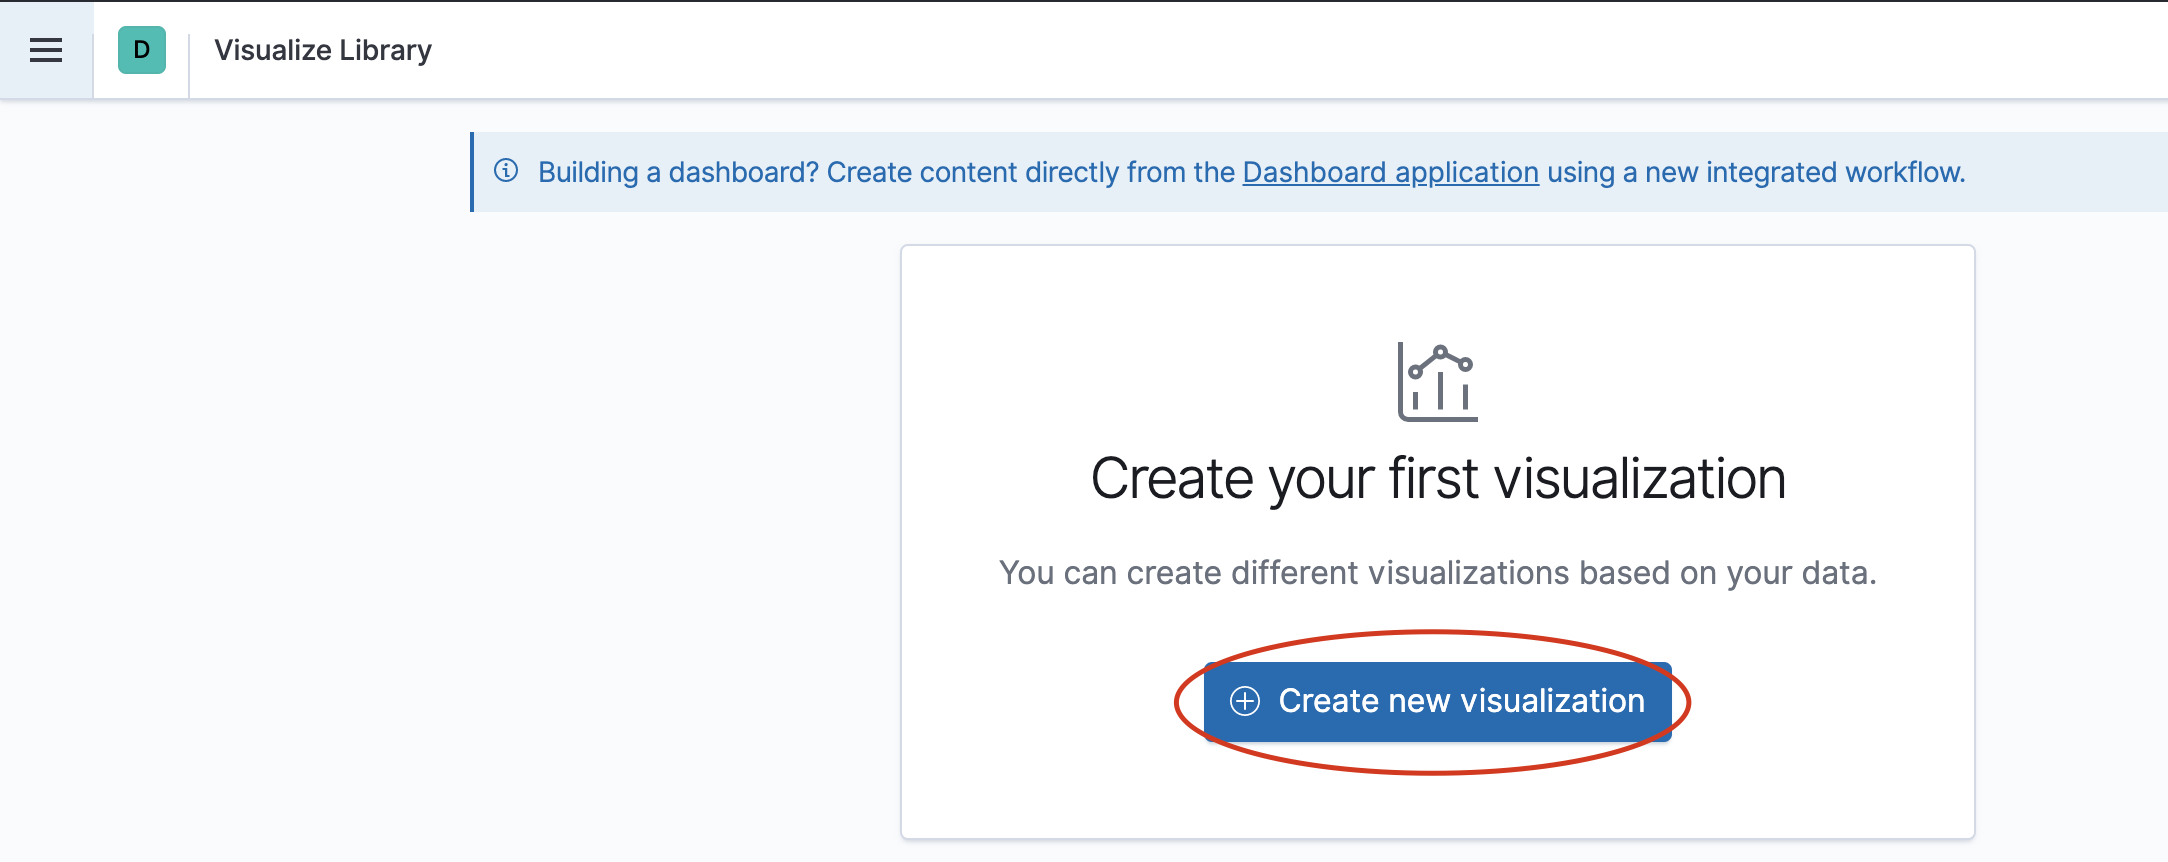
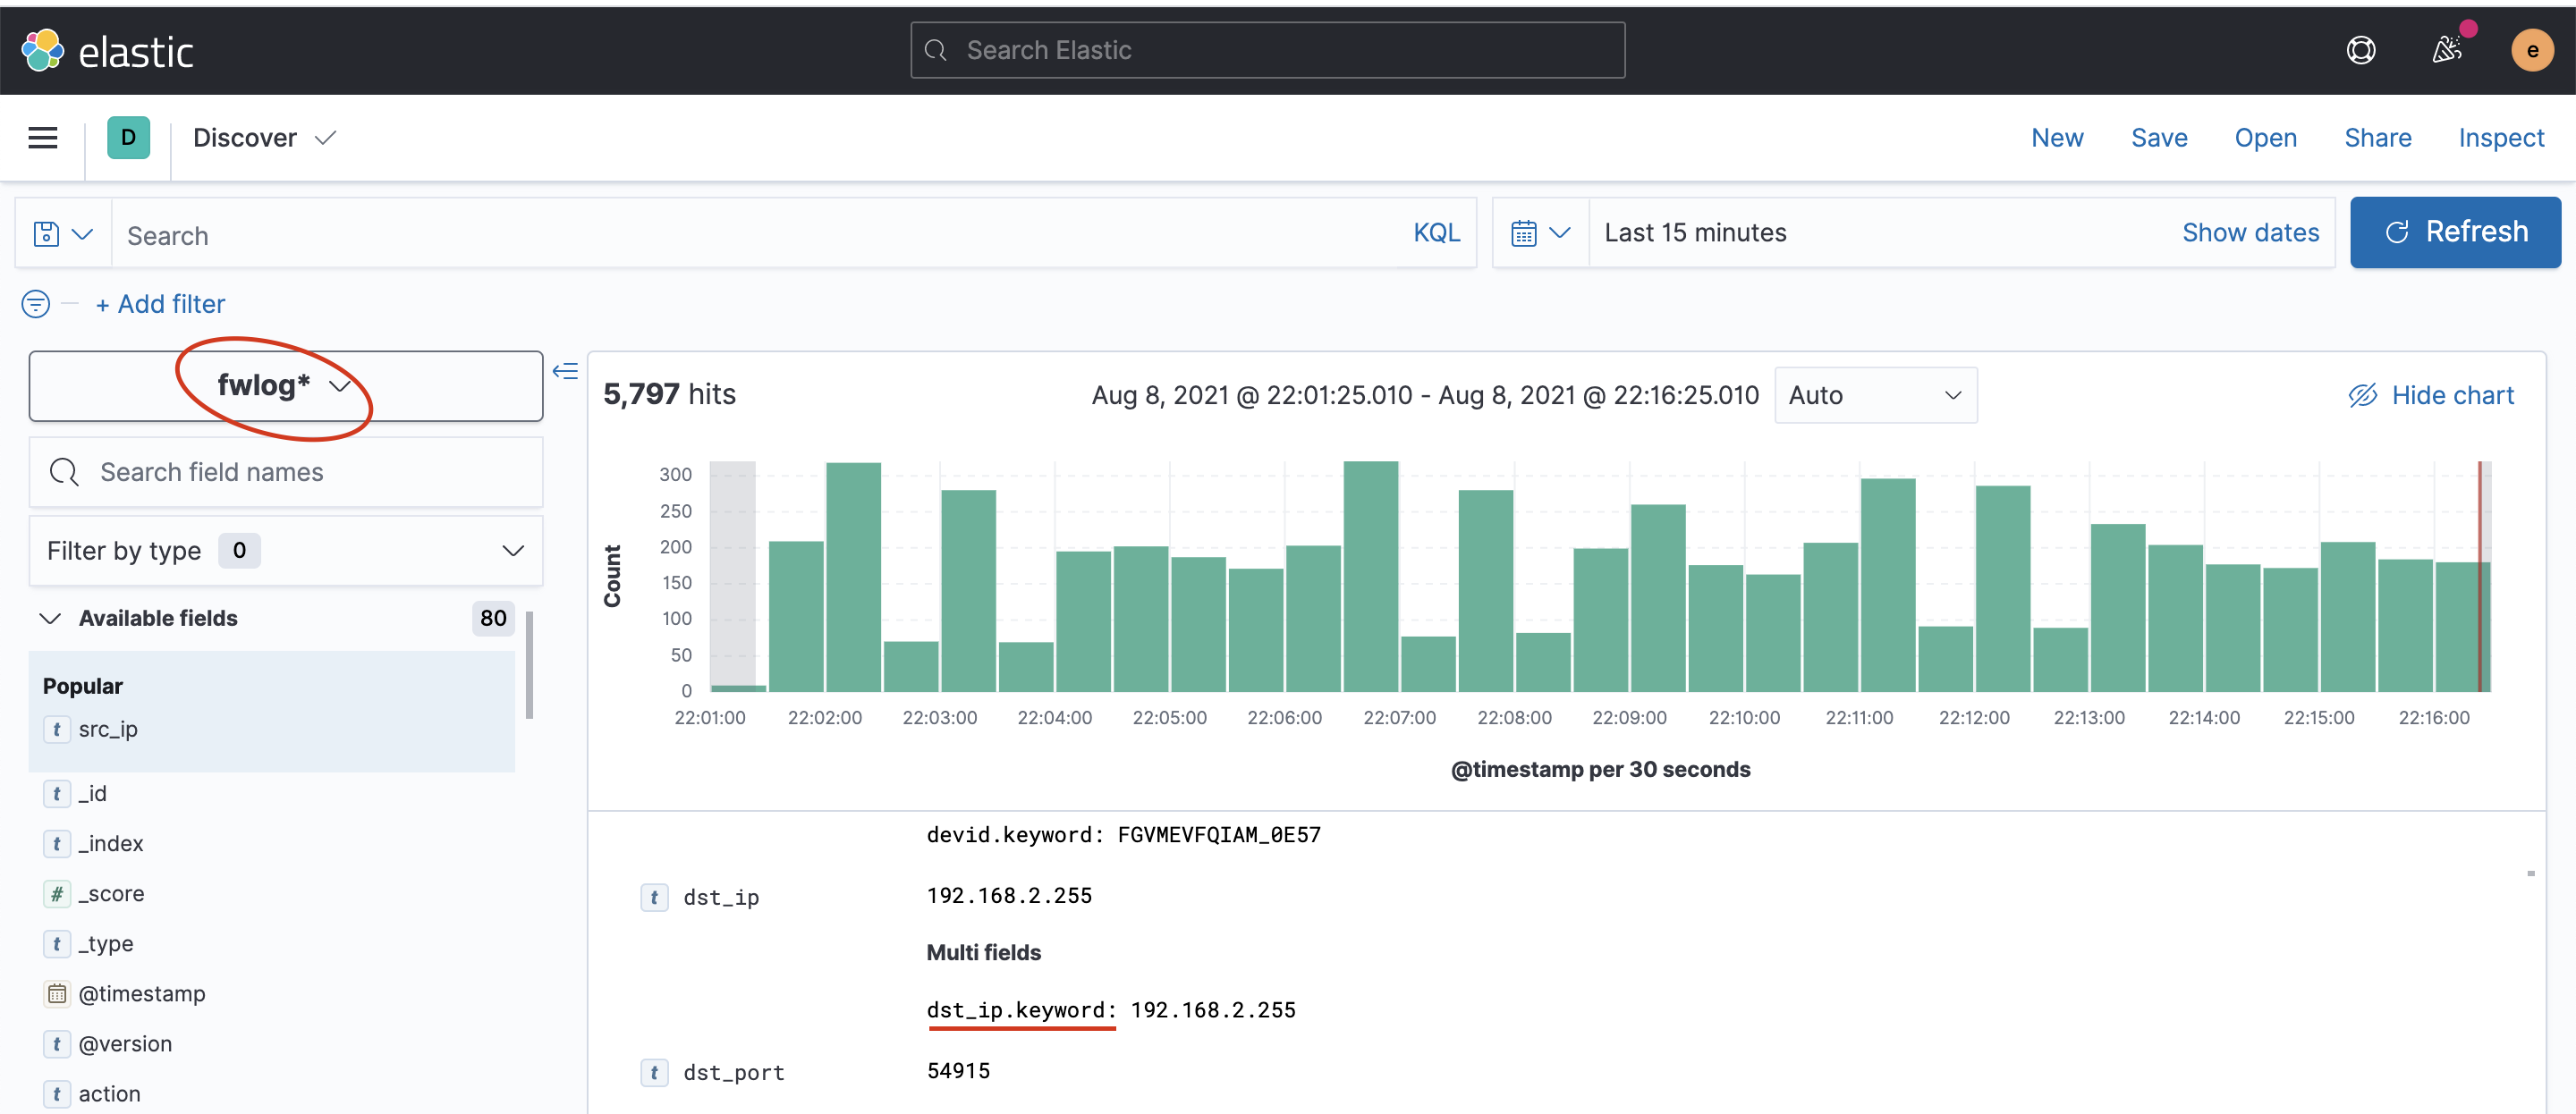
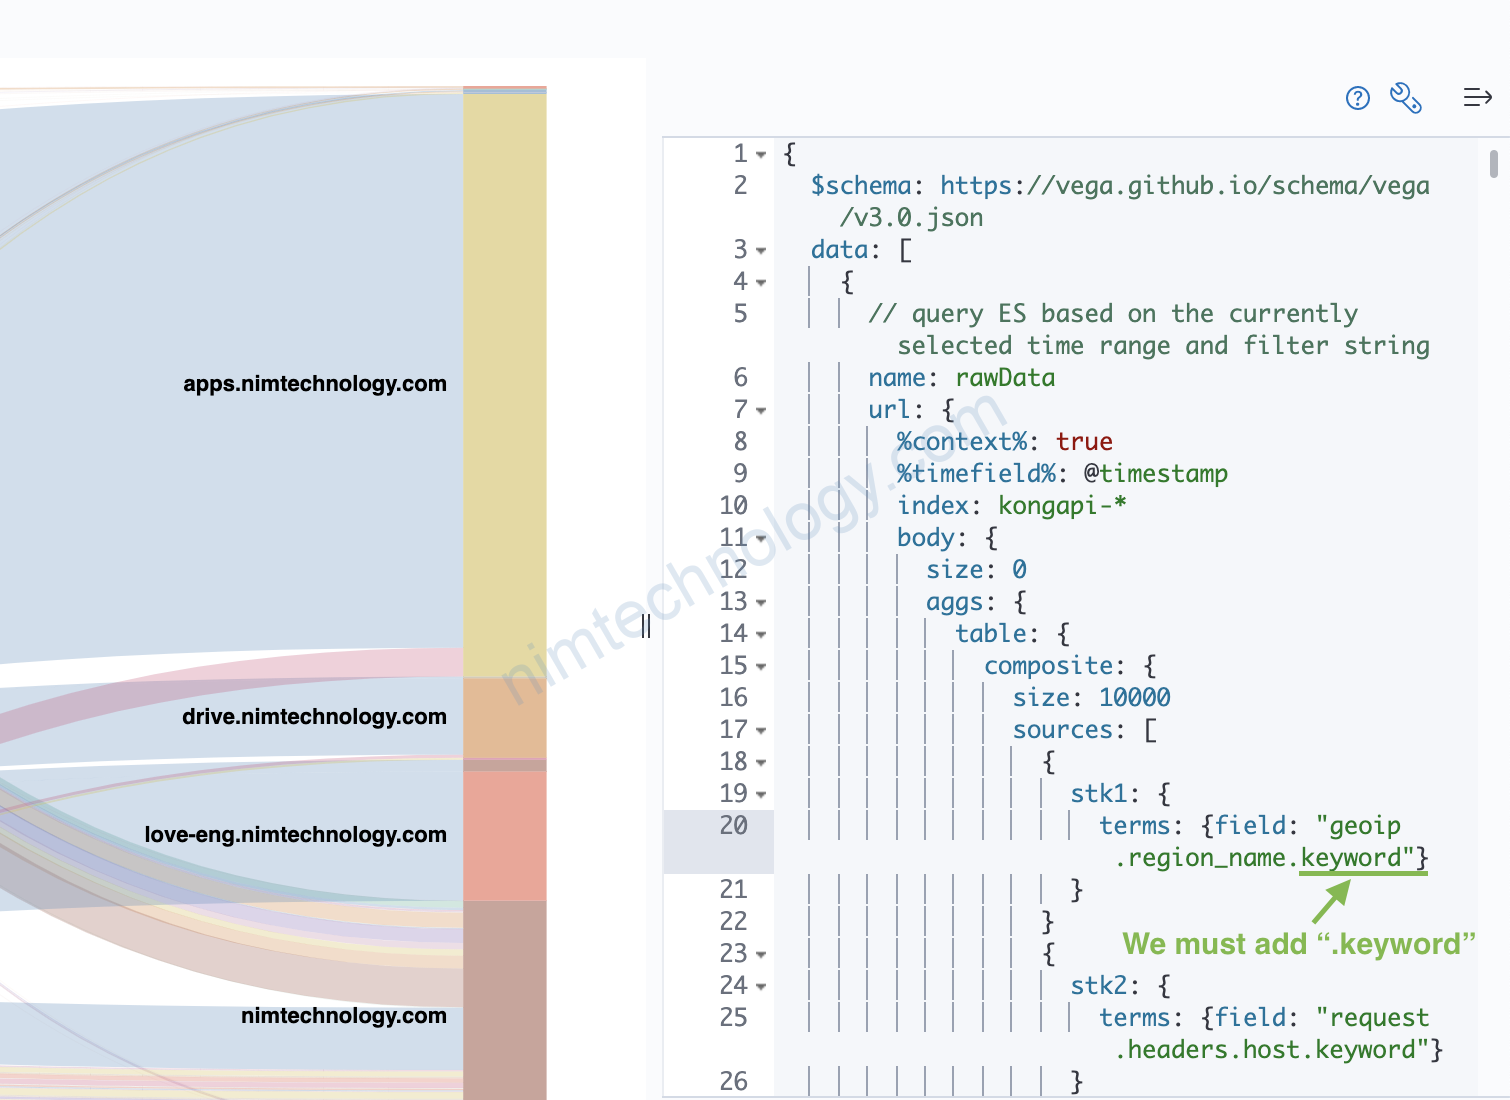
Điều đầu tiên bạn cần phải làm để tránh lỗi ở hình
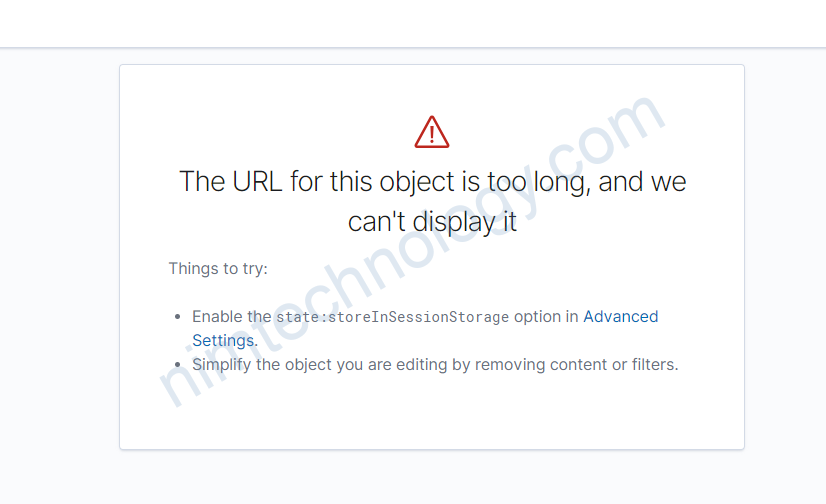
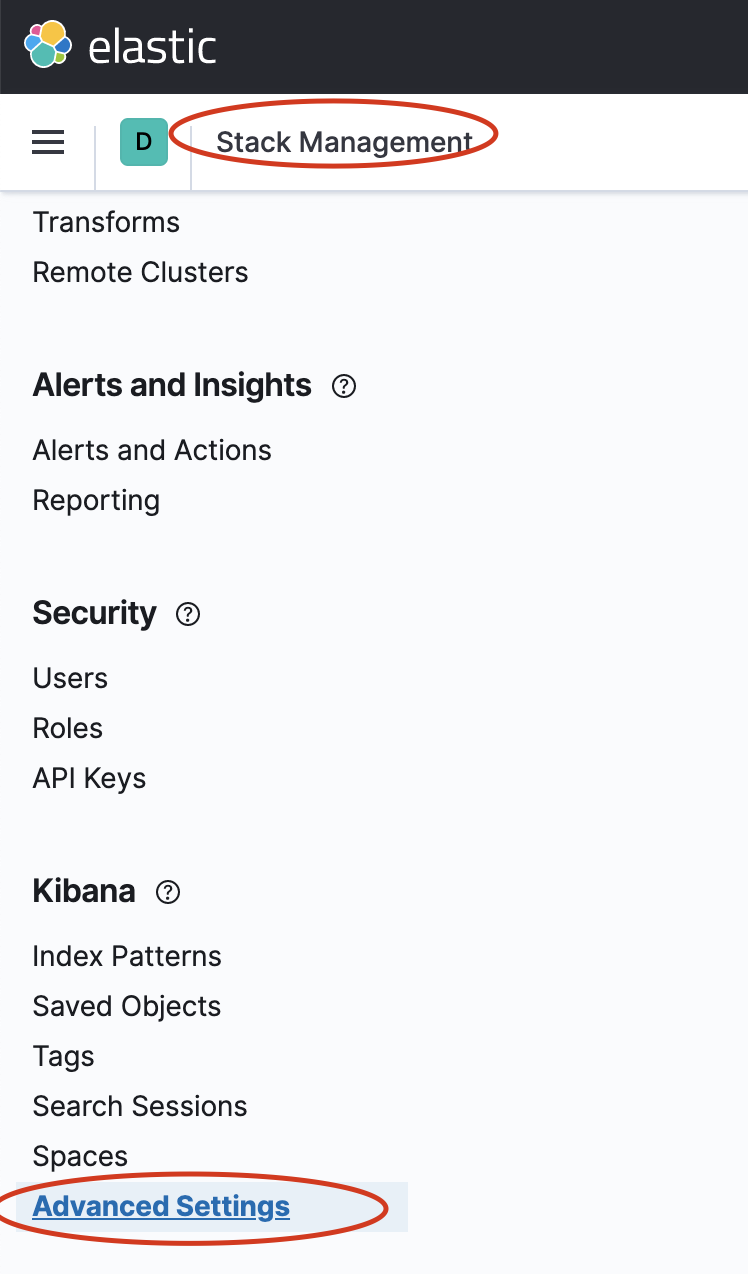
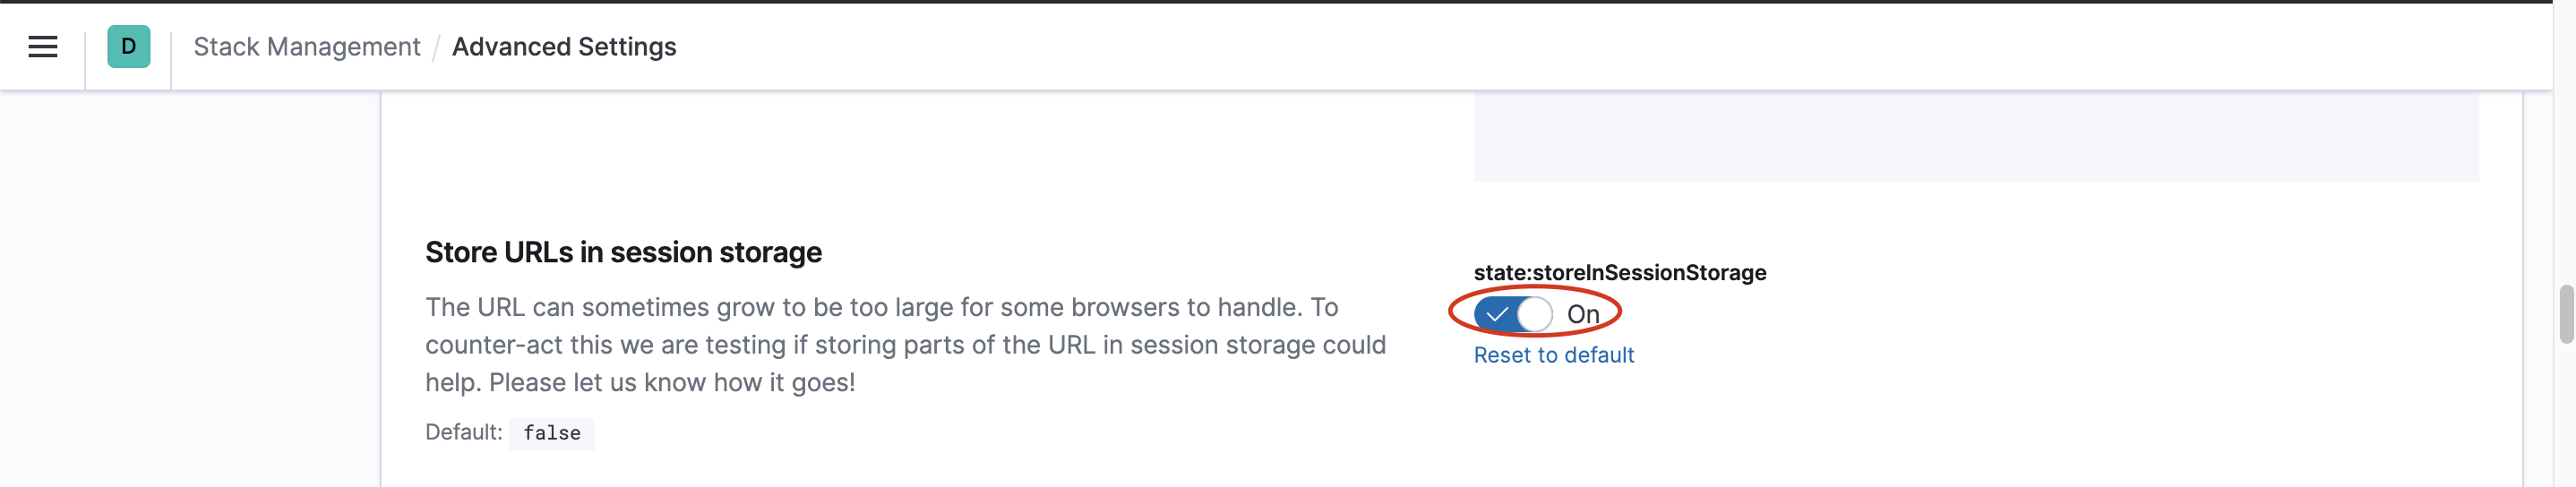
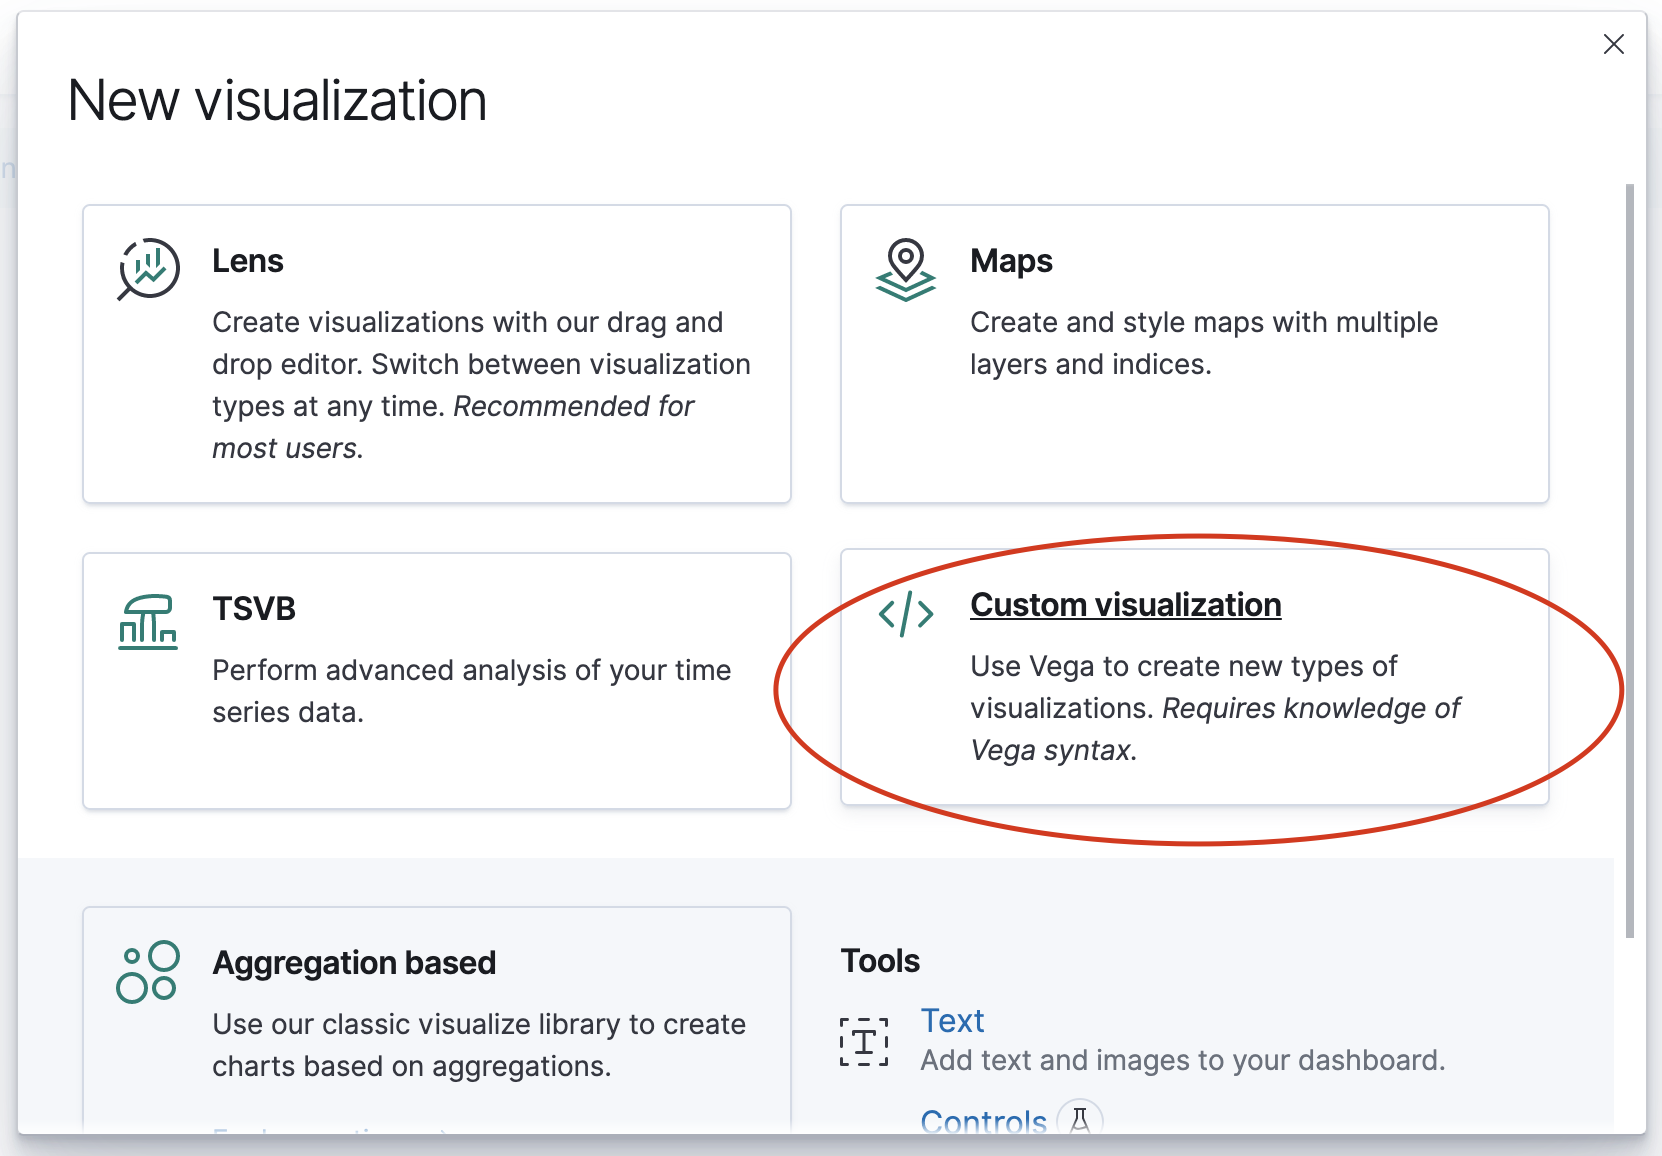
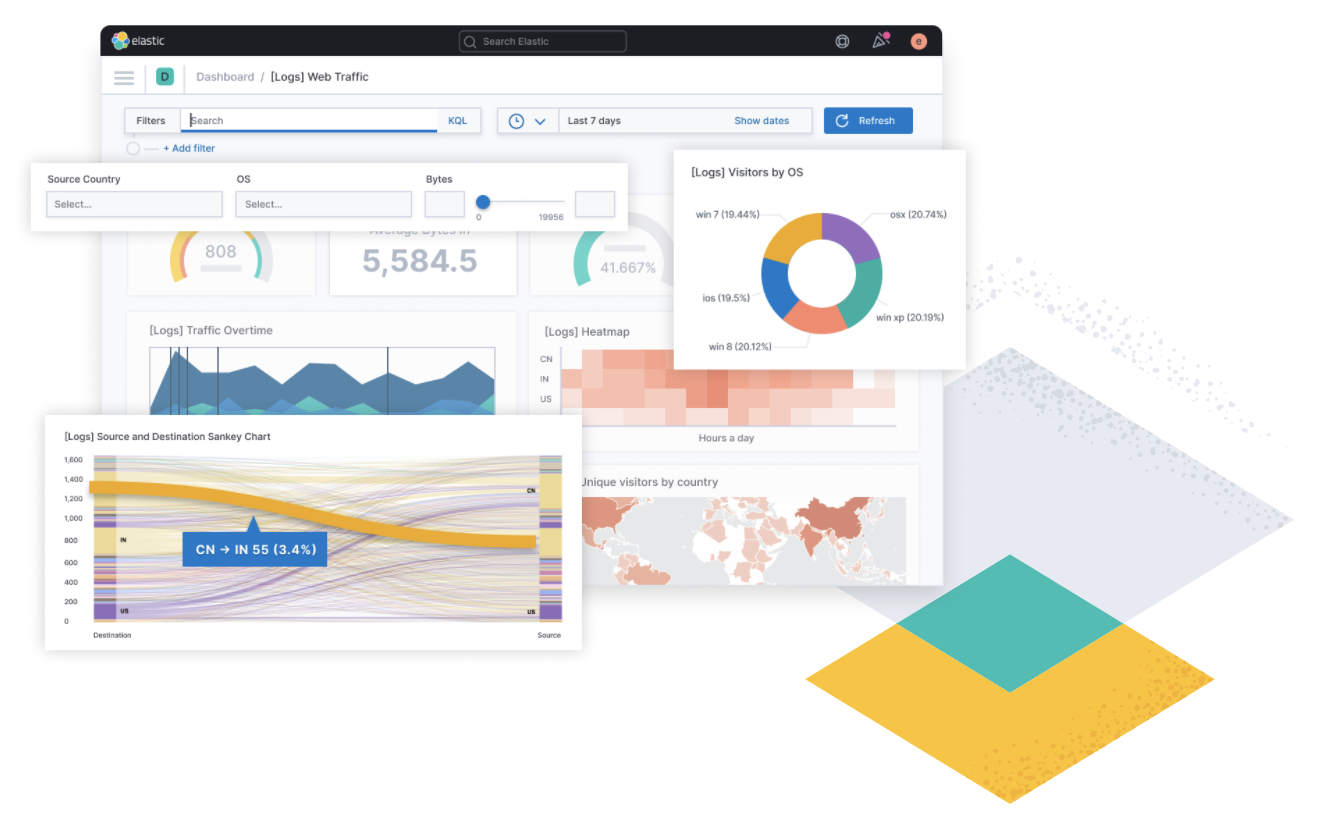
Bạn sẽ thấy 1 example nhứ này
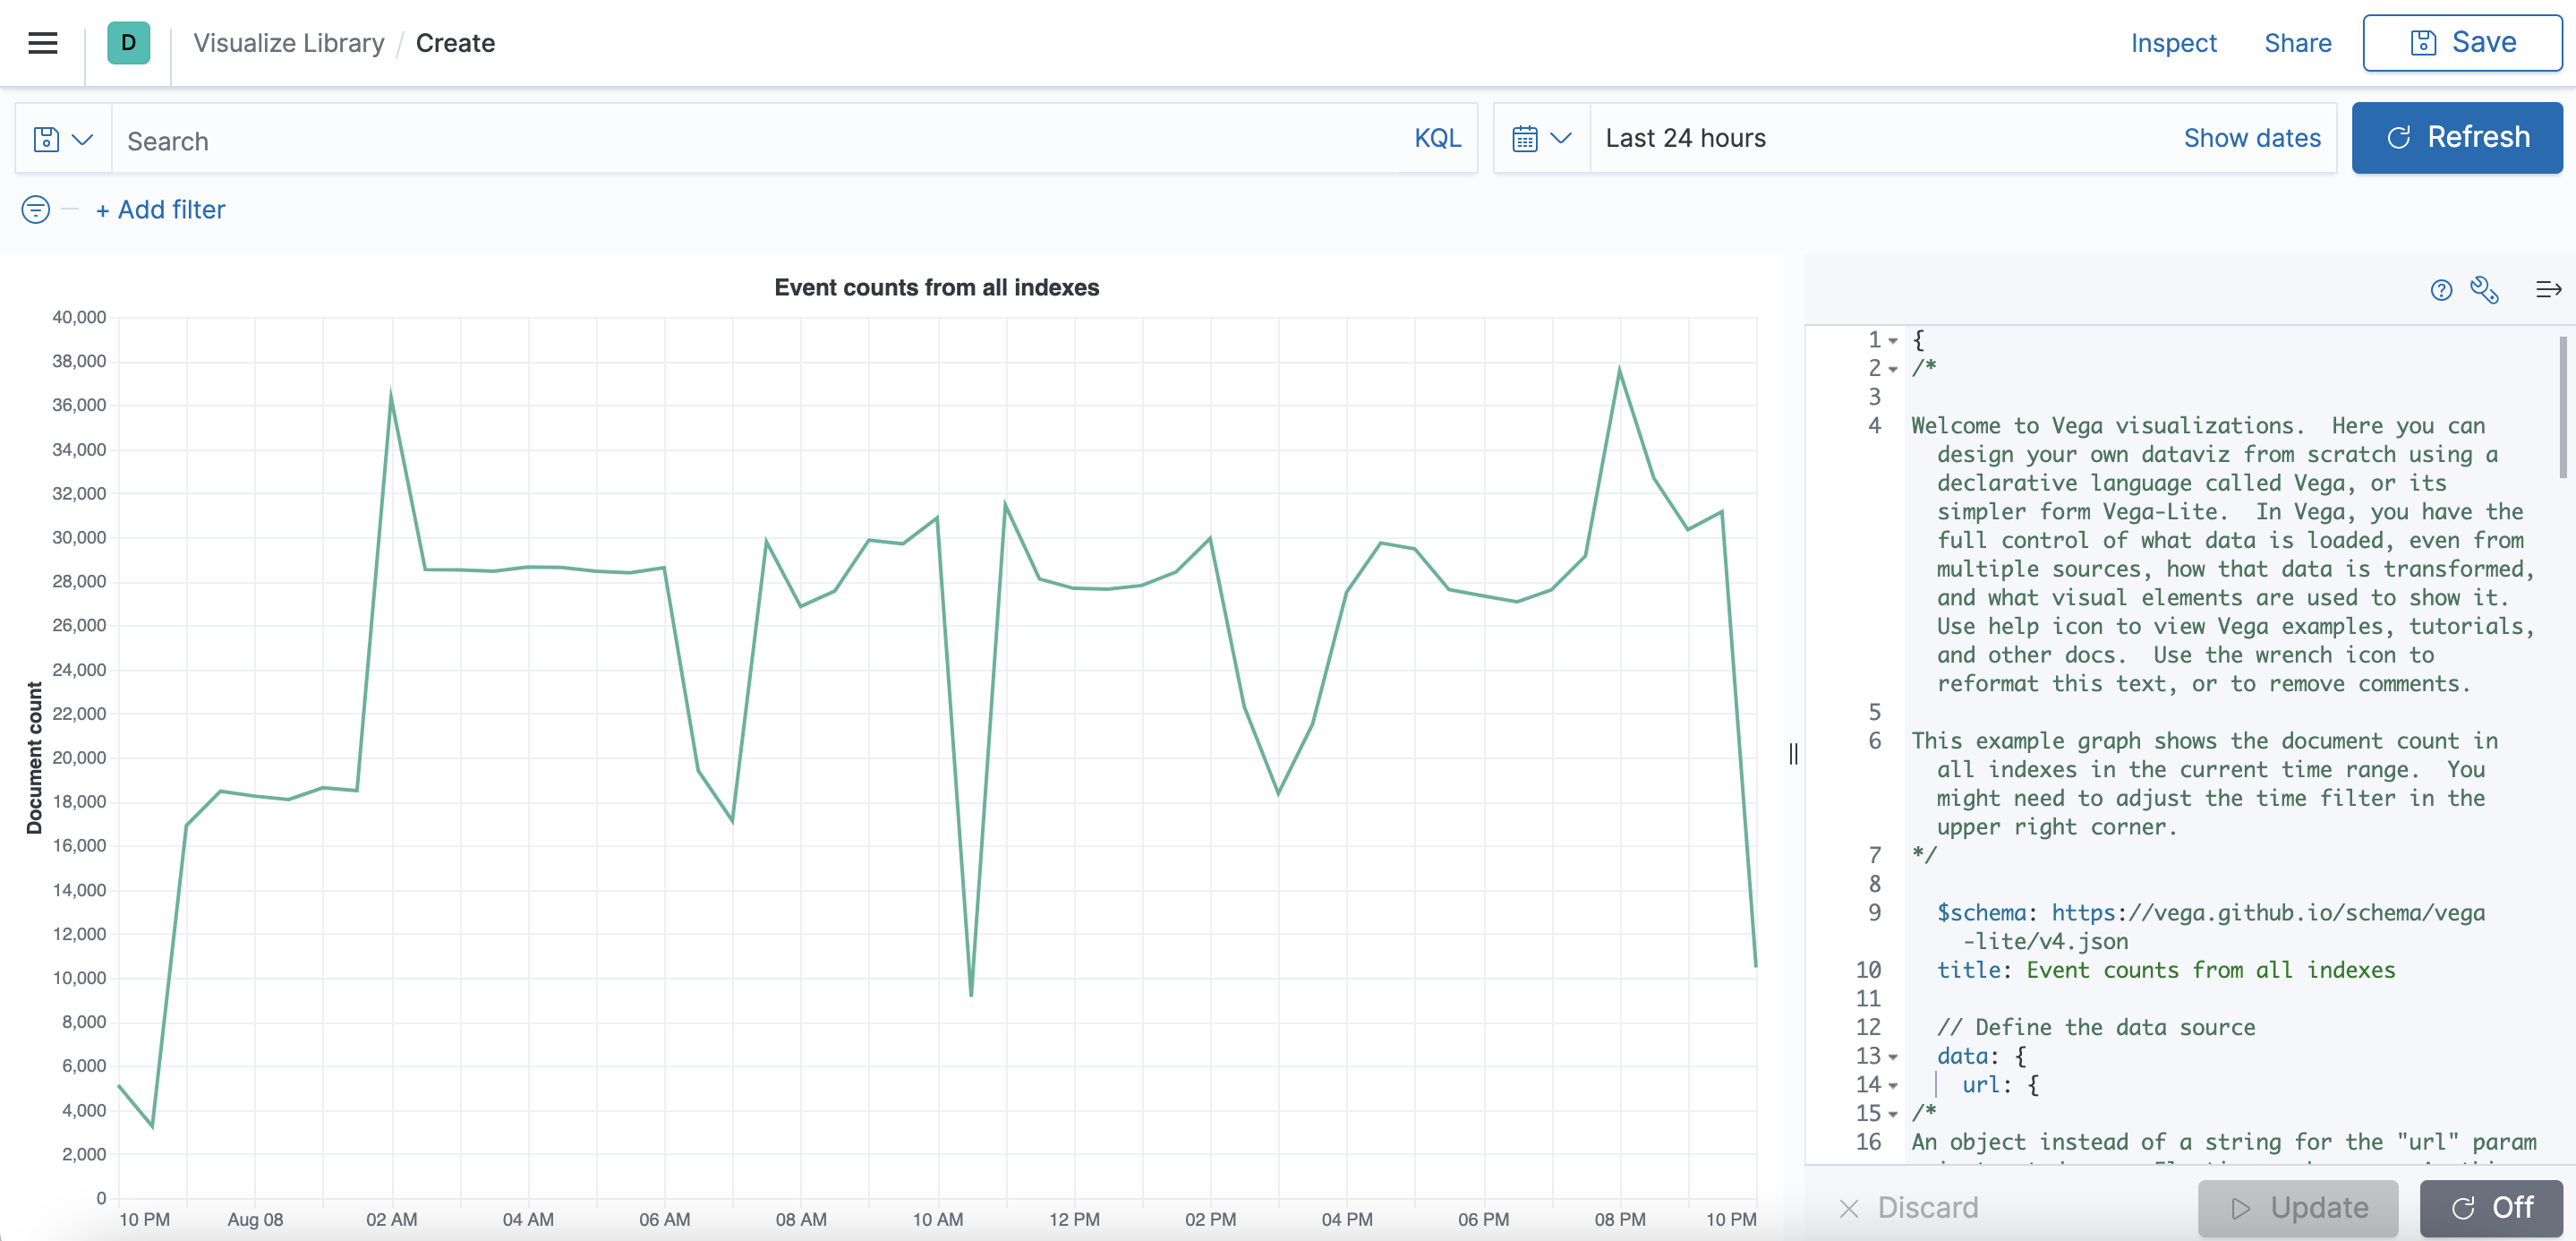
Giờ bạn tìm hiêu json của sankey chart
https://www.elastic.co/blog/sankey-visualization-with-vega-in-kibana
{
$schema: https://vega.github.io/schema/vega/v5.json
data: [
{
// query ES based on the currently selected time range and filter string
name: rawData
url: {
%context%: true
%timefield%: @timestamp
index: logstash-*
body: {
size: 0
aggs: {
table: {
composite: {
size: 10000
sources: [
{
stk1: {
terms: {field: "geo.src"}
}
}
{
stk2: {
terms: {field: "geo.dest"}
}
}
]
}
}
}
}
}
// From the result, take just the data we are interested in
format: {property: "aggregations.table.buckets"}
// Convert key.stk1 -> stk1 for simpler access below
transform: [
{type: "formula", expr: "datum.key.stk1", as: "stk1"}
{type: "formula", expr: "datum.key.stk2", as: "stk2"}
{type: "formula", expr: "datum.doc_count", as: "size"}
]
}
{
name: nodes
source: rawData
transform: [
// when a country is selected, filter out unrelated data
{
type: filter
expr: !groupSelector || groupSelector.stk1 == datum.stk1 || groupSelector.stk2 == datum.stk2
}
// Set new key for later lookups - identifies each node
{type: "formula", expr: "datum.stk1+datum.stk2", as: "key"}
// instead of each table row, create two new rows,
// one for the source (stack=stk1) and one for destination node (stack=stk2).
// The country code stored in stk1 and stk2 fields is placed into grpId field.
{
type: fold
fields: ["stk1", "stk2"]
as: ["stack", "grpId"]
}
// Create a sortkey, different for stk1 and stk2 stacks.
// Space separator ensures proper sort order in some corner cases.
{
type: formula
expr: datum.stack == 'stk1' ? datum.stk1+' '+datum.stk2 : datum.stk2+' '+datum.stk1
as: sortField
}
// Calculate y0 and y1 positions for stacking nodes one on top of the other,
// independently for each stack, and ensuring they are in the proper order,
// alphabetical from the top (reversed on the y axis)
{
type: stack
groupby: ["stack"]
sort: {field: "sortField", order: "descending"}
field: size
}
// calculate vertical center point for each node, used to draw edges
{type: "formula", expr: "(datum.y0+datum.y1)/2", as: "yc"}
]
}
{
name: groups
source: nodes
transform: [
// combine all nodes into country groups, summing up the doc counts
{
type: aggregate
groupby: ["stack", "grpId"]
fields: ["size"]
ops: ["sum"]
as: ["total"]
}
// re-calculate the stacking y0,y1 values
{
type: stack
groupby: ["stack"]
sort: {field: "grpId", order: "descending"}
field: total
}
// project y0 and y1 values to screen coordinates
// doing it once here instead of doing it several times in marks
{type: "formula", expr: "scale('y', datum.y0)", as: "scaledY0"}
{type: "formula", expr: "scale('y', datum.y1)", as: "scaledY1"}
// boolean flag if the label should be on the right of the stack
{type: "formula", expr: "datum.stack == 'stk1'", as: "rightLabel"}
// Calculate traffic percentage for this country using "y" scale
// domain upper bound, which represents the total traffic
{
type: formula
expr: datum.total/domain('y')[1]
as: percentage
}
]
}
{
// This is a temp lookup table with all the 'stk2' stack nodes
name: destinationNodes
source: nodes
transform: [
{type: "filter", expr: "datum.stack == 'stk2'"}
]
}
{
name: edges
source: nodes
transform: [
// we only want nodes from the left stack
{type: "filter", expr: "datum.stack == 'stk1'"}
// find corresponding node from the right stack, keep it as "target"
{
type: lookup
from: destinationNodes
key: key
fields: ["key"]
as: ["target"]
}
// calculate SVG link path between stk1 and stk2 stacks for the node pair
{
type: linkpath
orient: horizontal
shape: diagonal
sourceY: {expr: "scale('y', datum.yc)"}
sourceX: {expr: "scale('x', 'stk1') + bandwidth('x')"}
targetY: {expr: "scale('y', datum.target.yc)"}
targetX: {expr: "scale('x', 'stk2')"}
}
// A little trick to calculate the thickness of the line.
// The value needs to be the same as the hight of the node, but scaling
// size to screen's height gives inversed value because screen's Y
// coordinate goes from the top to the bottom, whereas the graph's Y=0
// is at the bottom. So subtracting scaled doc count from screen height
// (which is the "lower" bound of the "y" scale) gives us the right value
{
type: formula
expr: range('y')[0]-scale('y', datum.size)
as: strokeWidth
}
// Tooltip needs individual link's percentage of all traffic
{
type: formula
expr: datum.size/domain('y')[1]
as: percentage
}
]
}
]
scales: [
{
// calculates horizontal stack positioning
name: x
type: band
range: width
domain: ["stk1", "stk2"]
paddingOuter: 0.05
paddingInner: 0.95
}
{
// this scale goes up as high as the highest y1 value of all nodes
name: y
type: linear
range: height
domain: {data: "nodes", field: "y1"}
}
{
// use rawData to ensure the colors stay the same when clicking.
name: color
type: ordinal
range: category
domain: {data: "rawData", field: "stk1"}
}
{
// this scale is used to map internal ids (stk1, stk2) to stack names
name: stackNames
type: ordinal
range: ["Source", "Destination"]
domain: ["stk1", "stk2"]
}
]
axes: [
{
// x axis should use custom label formatting to print proper stack names
orient: bottom
scale: x
encode: {
labels: {
update: {
text: {scale: "stackNames", field: "value"}
}
}
}
}
{orient: "left", scale: "y"}
]
marks: [
{
// draw the connecting line between stacks
type: path
name: edgeMark
from: {data: "edges"}
// this prevents some autosizing issues with large strokeWidth for paths
clip: true
encode: {
update: {
// By default use color of the left node, except when showing traffic
// from just one country, in which case use destination color.
stroke: [
{
test: groupSelector && groupSelector.stack=='stk1'
scale: color
field: stk2
}
{scale: "color", field: "stk1"}
]
strokeWidth: {field: "strokeWidth"}
path: {field: "path"}
// when showing all traffic, and hovering over a country,
// highlight the traffic from that country.
strokeOpacity: {
signal: !groupSelector && (groupHover.stk1 == datum.stk1 || groupHover.stk2 == datum.stk2) ? 0.9 : 0.3
}
// Ensure that the hover-selected edges show on top
zindex: {
signal: !groupSelector && (groupHover.stk1 == datum.stk1 || groupHover.stk2 == datum.stk2) ? 1 : 0
}
// format tooltip string
tooltip: {
signal: datum.stk1 + ' → ' + datum.stk2 + ' ' + format(datum.size, ',.0f') + ' (' + format(datum.percentage, '.1%') + ')'
}
}
// Simple mouseover highlighting of a single line
hover: {
strokeOpacity: {value: 1}
}
}
}
{
// draw stack groups (countries)
type: rect
name: groupMark
from: {data: "groups"}
encode: {
enter: {
fill: {scale: "color", field: "grpId"}
width: {scale: "x", band: 1}
}
update: {
x: {scale: "x", field: "stack"}
y: {field: "scaledY0"}
y2: {field: "scaledY1"}
fillOpacity: {value: 0.6}
tooltip: {
signal: datum.grpId + ' ' + format(datum.total, ',.0f') + ' (' + format(datum.percentage, '.1%') + ')'
}
}
hover: {
fillOpacity: {value: 1}
}
}
}
{
// draw country code labels on the inner side of the stack
type: text
from: {data: "groups"}
// don't process events for the labels - otherwise line mouseover is unclean
interactive: false
encode: {
update: {
// depending on which stack it is, position x with some padding
x: {
signal: scale('x', datum.stack) + (datum.rightLabel ? bandwidth('x') + 8 : -8)
}
// middle of the group
yc: {signal: "(datum.scaledY0 + datum.scaledY1)/2"}
align: {signal: "datum.rightLabel ? 'left' : 'right'"}
baseline: {value: "middle"}
fontWeight: {value: "bold"}
// only show text label if the group's height is large enough
text: {signal: "abs(datum.scaledY0-datum.scaledY1) > 13 ? datum.grpId : ''"}
}
}
}
{
// Create a "show all" button. Shown only when a country is selected.
type: group
data: [
// We need to make the button show only when groupSelector signal is true.
// Each mark is drawn as many times as there are elements in the backing data.
// Which means that if values list is empty, it will not be drawn.
// Here I create a data source with one empty object, and filter that list
// based on the signal value. This can only be done in a group.
{
name: dataForShowAll
values: [{}]
transform: [{type: "filter", expr: "groupSelector"}]
}
]
// Set button size and positioning
encode: {
enter: {
xc: {signal: "width/2"}
y: {value: 30}
width: {value: 80}
height: {value: 30}
}
}
marks: [
{
// This group is shown as a button with rounded corners.
type: group
// mark name allows signal capturing
name: groupReset
// Only shows button if dataForShowAll has values.
from: {data: "dataForShowAll"}
encode: {
enter: {
cornerRadius: {value: 6}
fill: {value: "#f5f5f5"}
stroke: {value: "#c1c1c1"}
strokeWidth: {value: 2}
// use parent group's size
height: {
field: {group: "height"}
}
width: {
field: {group: "width"}
}
}
update: {
// groups are transparent by default
opacity: {value: 1}
}
hover: {
opacity: {value: 0.7}
}
}
marks: [
{
type: text
// if true, it will prevent clicking on the button when over text.
interactive: false
encode: {
enter: {
// center text in the paren group
xc: {
field: {group: "width"}
mult: 0.5
}
yc: {
field: {group: "height"}
mult: 0.5
offset: 2
}
align: {value: "center"}
baseline: {value: "middle"}
fontWeight: {value: "bold"}
text: {value: "Show All"}
}
}
}
]
}
]
}
]
signals: [
{
// used to highlight traffic to/from the same country
name: groupHover
value: {}
on: [
{
events: @groupMark:mouseover
update: "{stk1:datum.stack=='stk1' && datum.grpId, stk2:datum.stack=='stk2' && datum.grpId}"
}
{events: "mouseout", update: "{}"}
]
}
// used to filter only the data related to the selected country
{
name: groupSelector
value: false
on: [
{
// Clicking groupMark sets this signal to the filter values
events: @groupMark:click!
update: "{stack:datum.stack, stk1:datum.stack=='stk1' && datum.grpId, stk2:datum.stack=='stk2' && datum.grpId}"
}
{
// Clicking "show all" button, or double-clicking anywhere resets it
events: [
{type: "click", markname: "groupReset"}
{type: "dblclick"}
]
update: "false"
}
]
}
]
}
{
$schema: https://vega.github.io/schema/vega/v3.0.json
data: [
{
// query ES based on the currently selected time range and filter string
name: rawData
url: {
%context%: true
%timefield%: @timestamp
index: logstash-*
body: {
size: 0
aggs: {
table: {
composite: {
size: 10000
sources: [
{
stk1: {
terms: {field: "geo.src"}
}
}
{
stk2: {
terms: {field: "geo.dest"}
}
}
]
}
}
}
}
}
// From the result, take just the data we are interested in
format: {property: "aggregations.table.buckets"}
// Convert key.stk1 -> stk1 for simpler access below
transform: [
{type: "formula", expr: "datum.key.stk1", as: "stk1"}
{type: "formula", expr: "datum.key.stk2", as: "stk2"}
{type: "formula", expr: "datum.doc_count", as: "size"}
]
}
{
name: nodes
source: rawData
transform: [
// when a country is selected, filter out unrelated data
{
type: filter
expr: !groupSelector || groupSelector.stk1 == datum.stk1 || groupSelector.stk2 == datum.stk2
}
// Set new key for later lookups - identifies each node
{type: "formula", expr: "datum.stk1+datum.stk2", as: "key"}
// instead of each table row, create two new rows,
// one for the source (stack=stk1) and one for destination node (stack=stk2).
// The country code stored in stk1 and stk2 fields is placed into grpId field.
{
type: fold
fields: ["stk1", "stk2"]
as: ["stack", "grpId"]
}
// Create a sortkey, different for stk1 and stk2 stacks.
// Space separator ensures proper sort order in some corner cases.
{
type: formula
expr: datum.stack == 'stk1' ? datum.stk1+' '+datum.stk2 : datum.stk2+' '+datum.stk1
as: sortField
}
// Calculate y0 and y1 positions for stacking nodes one on top of the other,
// independently for each stack, and ensuring they are in the proper order,
// alphabetical from the top (reversed on the y axis)
{
type: stack
groupby: ["stack"]
sort: {field: "sortField", order: "descending"}
field: size
}
// calculate vertical center point for each node, used to draw edges
{type: "formula", expr: "(datum.y0+datum.y1)/2", as: "yc"}
]
}
{
name: groups
source: nodes
transform: [
// combine all nodes into country groups, summing up the doc counts
{
type: aggregate
groupby: ["stack", "grpId"]
fields: ["size"]
ops: ["sum"]
as: ["total"]
}
// re-calculate the stacking y0,y1 values
{
type: stack
groupby: ["stack"]
sort: {field: "grpId", order: "descending"}
field: total
}
// project y0 and y1 values to screen coordinates
// doing it once here instead of doing it several times in marks
{type: "formula", expr: "scale('y', datum.y0)", as: "scaledY0"}
{type: "formula", expr: "scale('y', datum.y1)", as: "scaledY1"}
// boolean flag if the label should be on the right of the stack
{type: "formula", expr: "datum.stack == 'stk1'", as: "rightLabel"}
// Calculate traffic percentage for this country using "y" scale
// domain upper bound, which represents the total traffic
{
type: formula
expr: datum.total/domain('y')[1]
as: percentage
}
]
}
{
// This is a temp lookup table with all the 'stk2' stack nodes
name: destinationNodes
source: nodes
transform: [
{type: "filter", expr: "datum.stack == 'stk2'"}
]
}
{
name: edges
source: nodes
transform: [
// we only want nodes from the left stack
{type: "filter", expr: "datum.stack == 'stk1'"}
// find corresponding node from the right stack, keep it as "target"
{
type: lookup
from: destinationNodes
key: key
fields: ["key"]
as: ["target"]
}
// calculate SVG link path between stk1 and stk2 stacks for the node pair
{
type: linkpath
orient: horizontal
shape: diagonal
sourceY: {expr: "scale('y', datum.yc)"}
sourceX: {expr: "scale('x', 'stk1') + bandwidth('x')"}
targetY: {expr: "scale('y', datum.target.yc)"}
targetX: {expr: "scale('x', 'stk2')"}
}
// A little trick to calculate the thickness of the line.
// The value needs to be the same as the hight of the node, but scaling
// size to screen's height gives inversed value because screen's Y
// coordinate goes from the top to the bottom, whereas the graph's Y=0
// is at the bottom. So subtracting scaled doc count from screen height
// (which is the "lower" bound of the "y" scale) gives us the right value
{
type: formula
expr: range('y')[0]-scale('y', datum.size)
as: strokeWidth
}
// Tooltip needs individual link's percentage of all traffic
{
type: formula
expr: datum.size/domain('y')[1]
as: percentage
}
]
}
]
scales: [
{
// calculates horizontal stack positioning
name: x
type: band
range: width
domain: ["stk1", "stk2"]
paddingOuter: 0.05
paddingInner: 0.95
}
{
// this scale goes up as high as the highest y1 value of all nodes
name: y
type: linear
range: height
domain: {data: "nodes", field: "y1"}
}
{
// use rawData to ensure the colors stay the same when clicking.
name: color
type: ordinal
range: category
domain: {data: "rawData", field: "stk1"}
}
{
// this scale is used to map internal ids (stk1, stk2) to stack names
name: stackNames
type: ordinal
range: ["Source", "Destination"]
domain: ["stk1", "stk2"]
}
]
axes: [
{
// x axis should use custom label formatting to print proper stack names
orient: bottom
scale: x
encode: {
labels: {
update: {
text: {scale: "stackNames", field: "value"}
}
}
}
}
{orient: "left", scale: "y"}
]
marks: [
{
// draw the connecting line between stacks
type: path
name: edgeMark
from: {data: "edges"}
// this prevents some autosizing issues with large strokeWidth for paths
clip: true
encode: {
update: {
// By default use color of the left node, except when showing traffic
// from just one country, in which case use destination color.
stroke: [
{
test: groupSelector && groupSelector.stack=='stk1'
scale: color
field: stk2
}
{scale: "color", field: "stk1"}
]
strokeWidth: {field: "strokeWidth"}
path: {field: "path"}
// when showing all traffic, and hovering over a country,
// highlight the traffic from that country.
strokeOpacity: {
signal: !groupSelector && (groupHover.stk1 == datum.stk1 || groupHover.stk2 == datum.stk2) ? 0.9 : 0.3
}
// Ensure that the hover-selected edges show on top
zindex: {
signal: !groupSelector && (groupHover.stk1 == datum.stk1 || groupHover.stk2 == datum.stk2) ? 1 : 0
}
// format tooltip string
tooltip: {
signal: datum.stk1 + ' → ' + datum.stk2 + ' ' + format(datum.size, ',.0f') + ' (' + format(datum.percentage, '.1%') + ')'
}
}
// Simple mouseover highlighting of a single line
hover: {
strokeOpacity: {value: 1}
}
}
}
{
// draw stack groups (countries)
type: rect
name: groupMark
from: {data: "groups"}
encode: {
enter: {
fill: {scale: "color", field: "grpId"}
width: {scale: "x", band: 1}
}
update: {
x: {scale: "x", field: "stack"}
y: {field: "scaledY0"}
y2: {field: "scaledY1"}
fillOpacity: {value: 0.6}
tooltip: {
signal: datum.grpId + ' ' + format(datum.total, ',.0f') + ' (' + format(datum.percentage, '.1%') + ')'
}
}
hover: {
fillOpacity: {value: 1}
}
}
}
{
// draw country code labels on the inner side of the stack
type: text
from: {data: "groups"}
// don't process events for the labels - otherwise line mouseover is unclean
interactive: false
encode: {
update: {
// depending on which stack it is, position x with some padding
x: {
signal: scale('x', datum.stack) + (datum.rightLabel ? bandwidth('x') + 8 : -8)
}
// middle of the group
yc: {signal: "(datum.scaledY0 + datum.scaledY1)/2"}
align: {signal: "datum.rightLabel ? 'left' : 'right'"}
baseline: {value: "middle"}
fontWeight: {value: "bold"}
// only show text label if the group's height is large enough
text: {signal: "abs(datum.scaledY0-datum.scaledY1) > 13 ? datum.grpId : ''"}
}
}
}
{
// Create a "show all" button. Shown only when a country is selected.
type: group
data: [
// We need to make the button show only when groupSelector signal is true.
// Each mark is drawn as many times as there are elements in the backing data.
// Which means that if values list is empty, it will not be drawn.
// Here I create a data source with one empty object, and filter that list
// based on the signal value. This can only be done in a group.
{
name: dataForShowAll
values: [{}]
transform: [{type: "filter", expr: "groupSelector"}]
}
]
// Set button size and positioning
encode: {
enter: {
xc: {signal: "width/2"}
y: {value: 30}
width: {value: 80}
height: {value: 30}
}
}
marks: [
{
// This group is shown as a button with rounded corners.
type: group
// mark name allows signal capturing
name: groupReset
// Only shows button if dataForShowAll has values.
from: {data: "dataForShowAll"}
encode: {
enter: {
cornerRadius: {value: 6}
fill: {value: "#f5f5f5"}
stroke: {value: "#c1c1c1"}
strokeWidth: {value: 2}
// use parent group's size
height: {
field: {group: "height"}
}
width: {
field: {group: "width"}
}
}
update: {
// groups are transparent by default
opacity: {value: 1}
}
hover: {
opacity: {value: 0.7}
}
}
marks: [
{
type: text
// if true, it will prevent clicking on the button when over text.
interactive: false
encode: {
enter: {
// center text in the paren group
xc: {
field: {group: "width"}
mult: 0.5
}
yc: {
field: {group: "height"}
mult: 0.5
offset: 2
}
align: {value: "center"}
baseline: {value: "middle"}
fontWeight: {value: "bold"}
text: {value: "Show All"}
}
}
}
]
}
]
}
]
signals: [
{
// used to highlight traffic to/from the same country
name: groupHover
value: {}
on: [
{
events: @groupMark:mouseover
update: "{stk1:datum.stack=='stk1' && datum.grpId, stk2:datum.stack=='stk2' && datum.grpId}"
}
{events: "mouseout", update: "{}"}
]
}
// used to filter only the data related to the selected country
{
name: groupSelector
value: false
on: [
{
// Clicking groupMark sets this signal to the filter values
events: @groupMark:click!
update: "{stack:datum.stack, stk1:datum.stack=='stk1' && datum.grpId, stk2:datum.stack=='stk2' && datum.grpId}"
}
{
// Clicking "show all" button, or double-clicking anywhere resets it
events: [
{type: "click", markname: "groupReset"}
{type: "dblclick"}
]
update: "false"
}
]
}
]
}
Và tìm đến phần này và copy toàn bộ json về sửa 3 chỗ
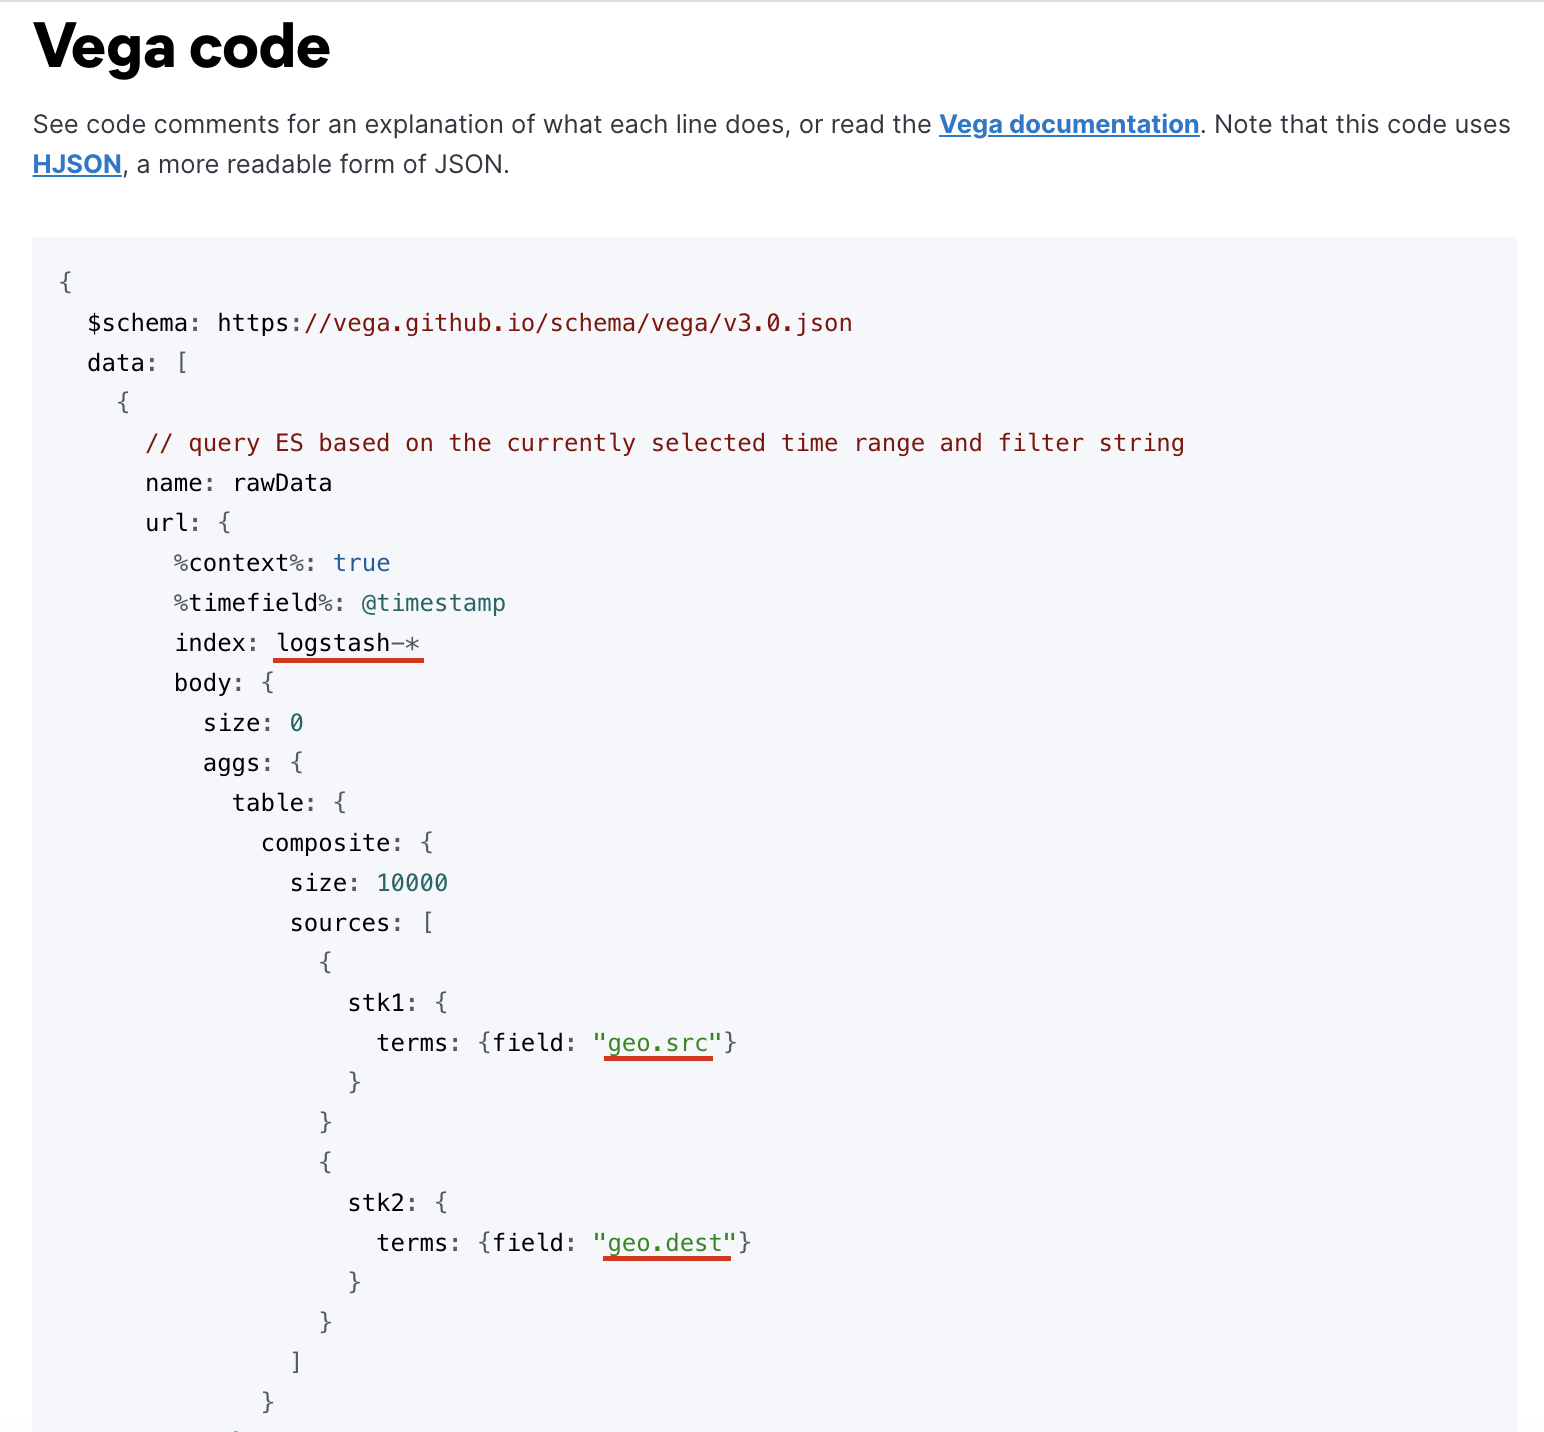
Để dễ biết bạn thay đổi ntn cho đúng
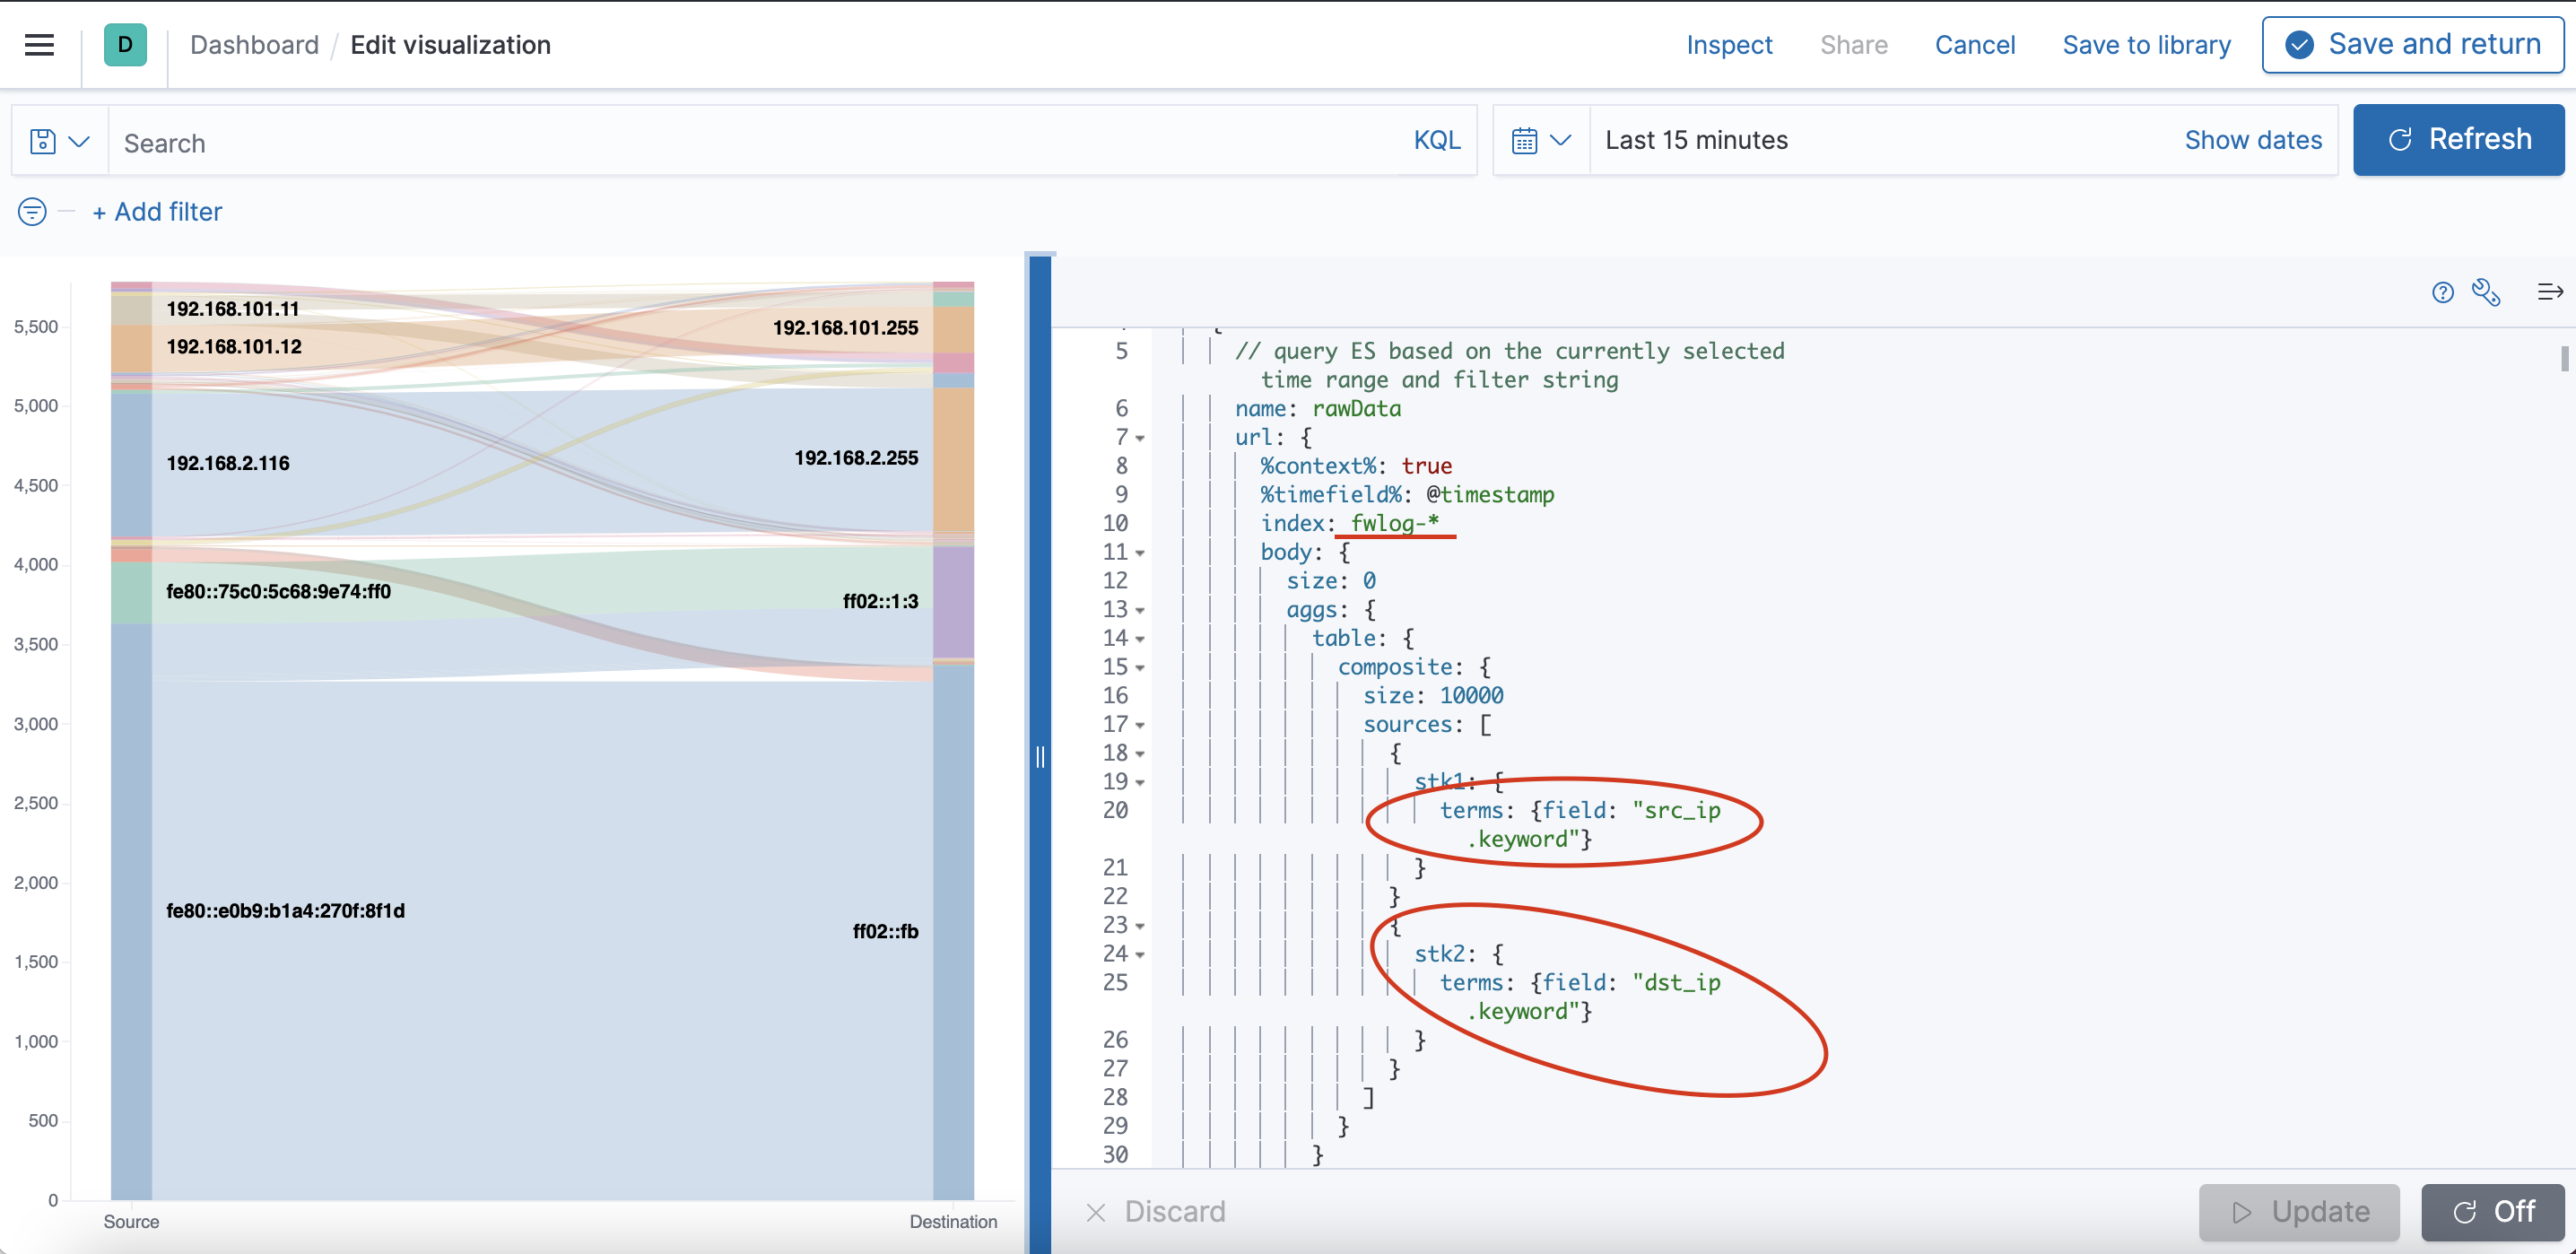
Giờ save và create 1 dashboard thôi
Có 1 lưu ý:
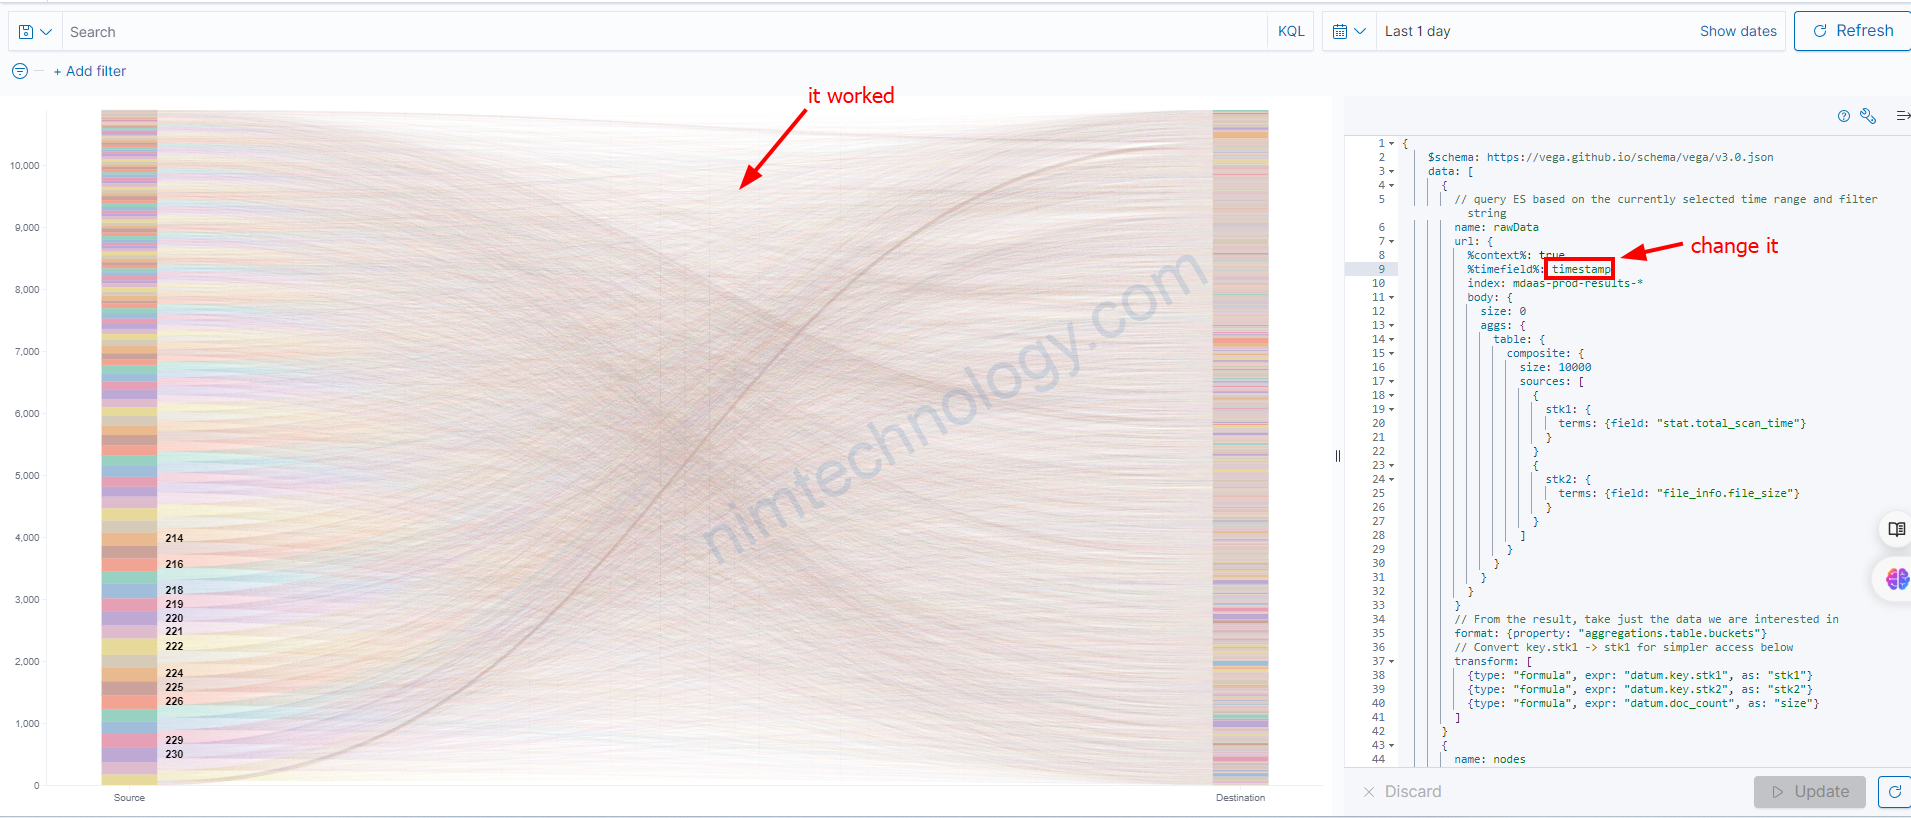
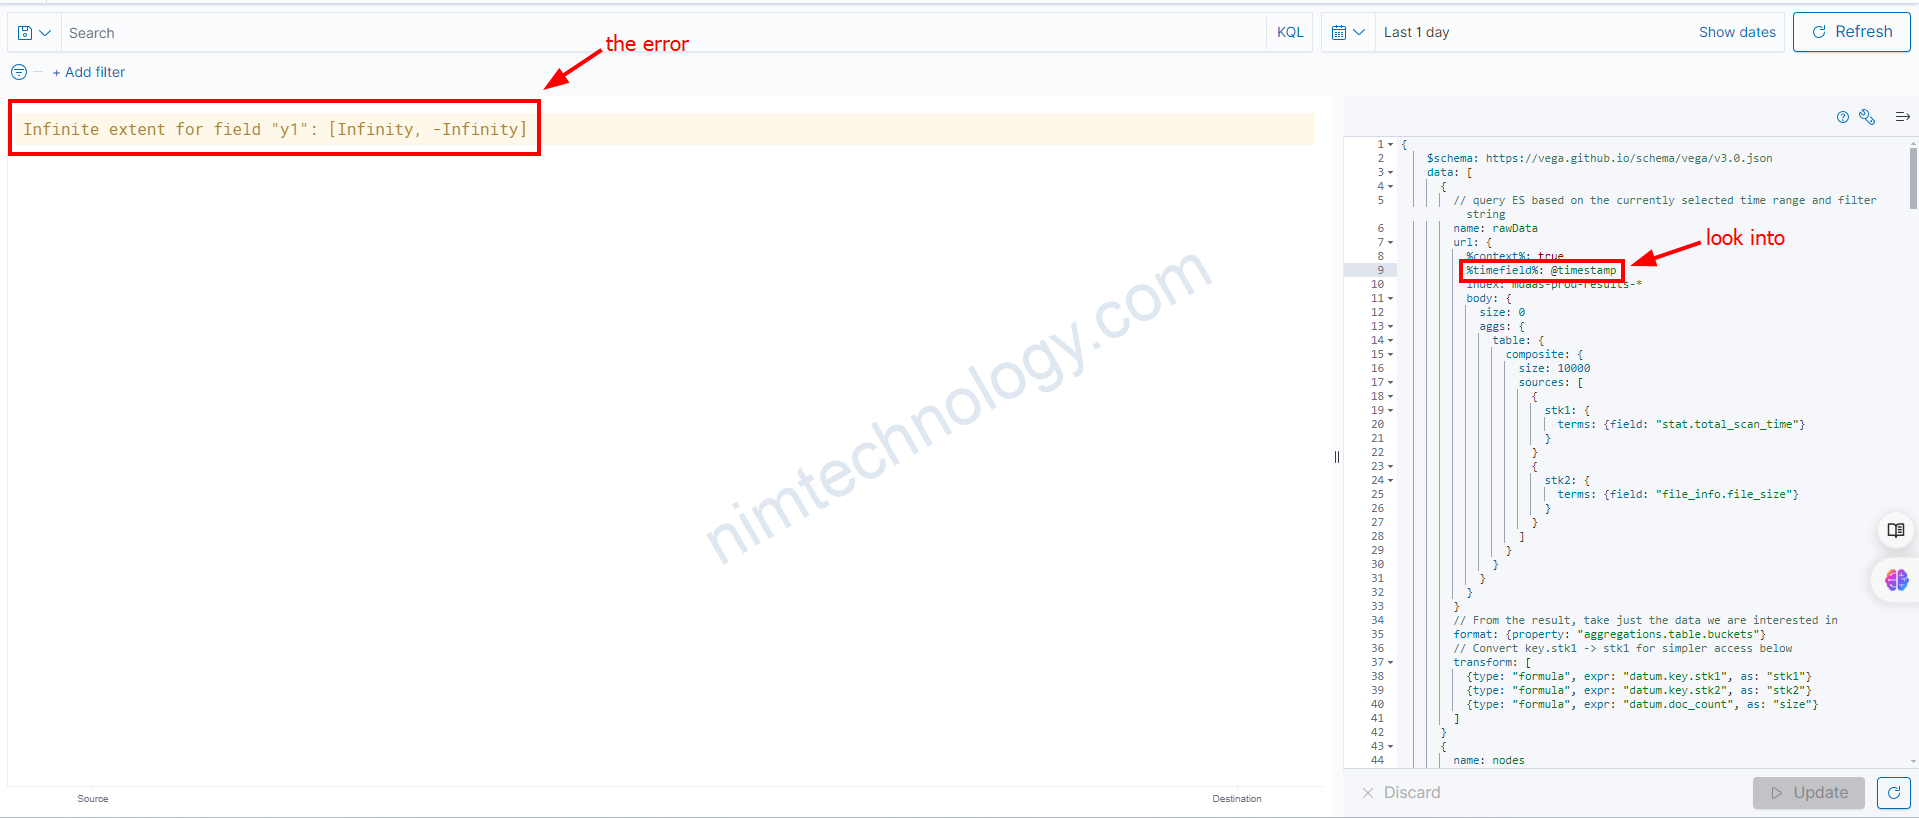
Issue.
Infinite extent for field “y1”: [Infinity, -Infinity]
sau khi tìm hiểu thì theo mình là nó không get được value gì?
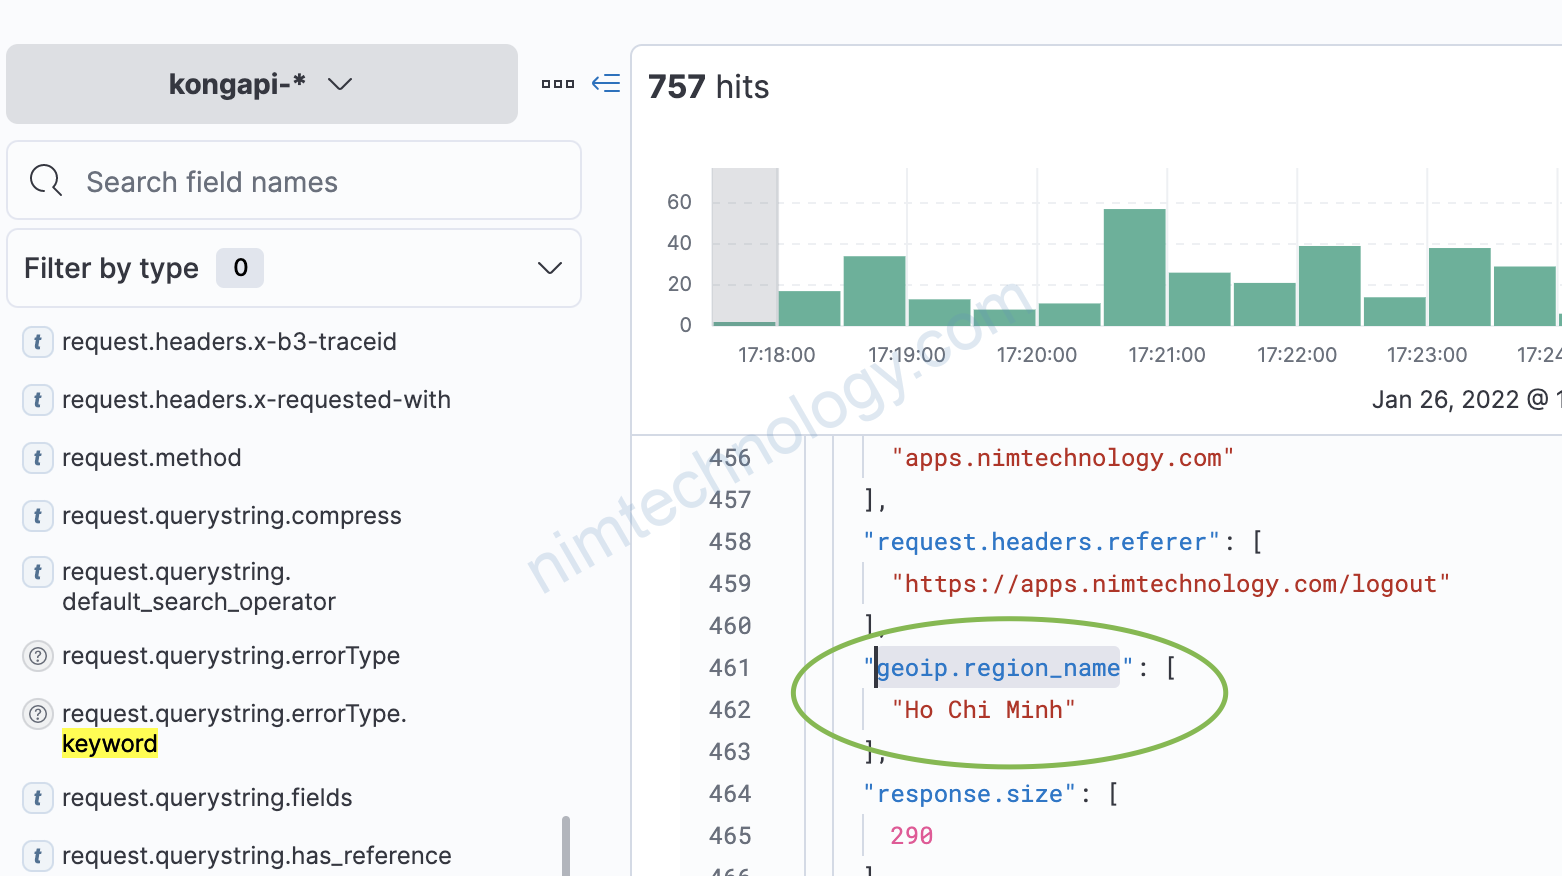
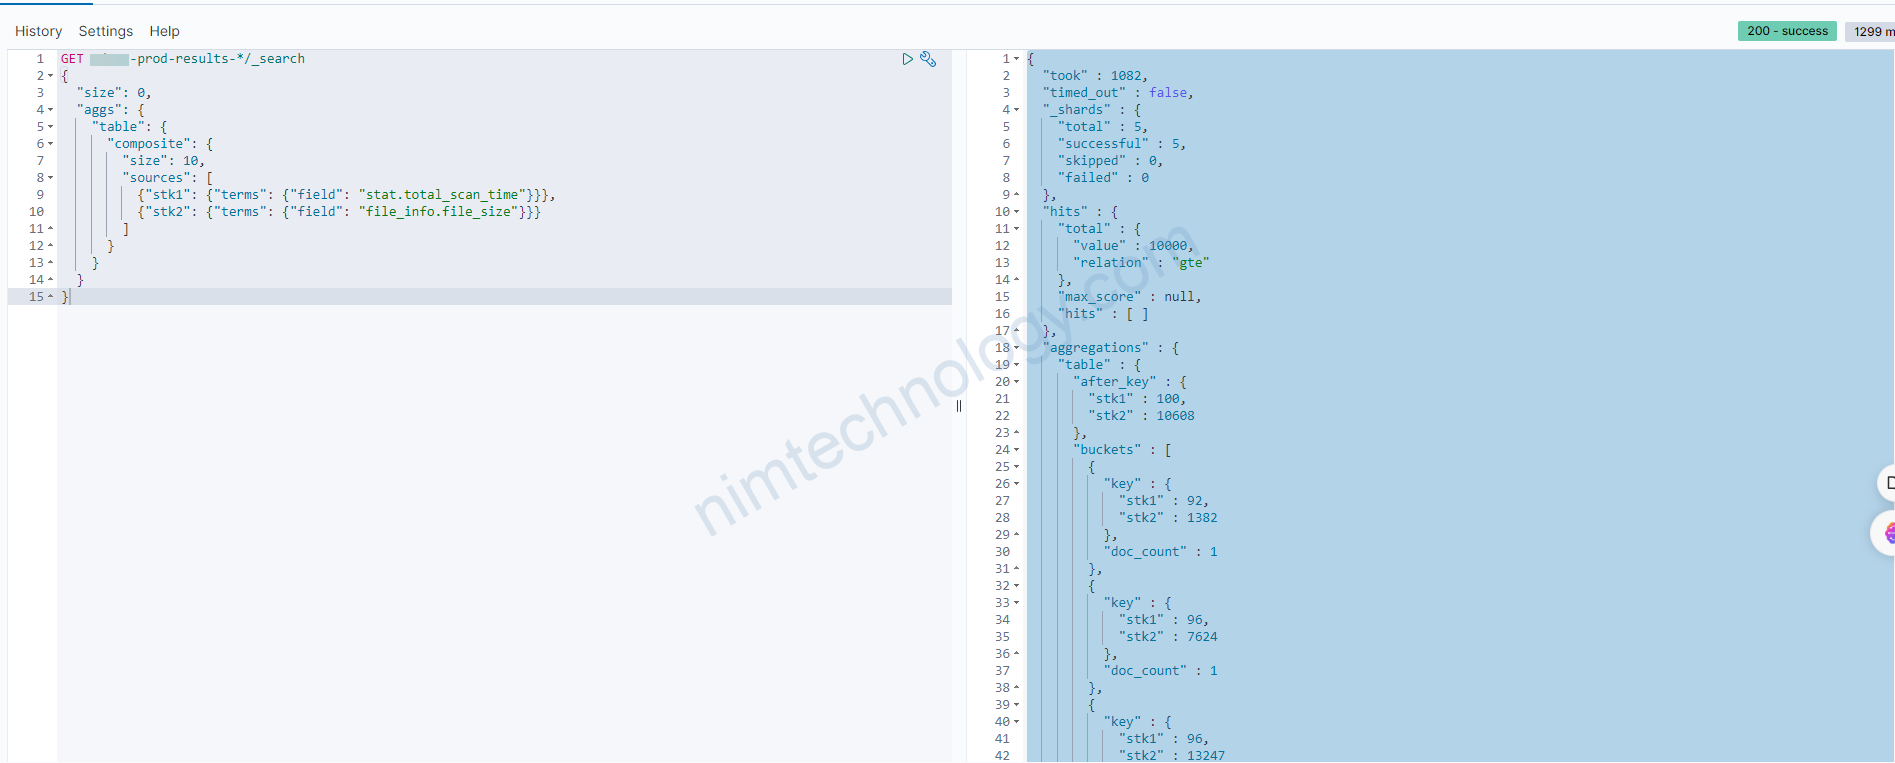
Mình thấy lạ khi mình query trong devtool kết quả vẫn ok:
Mình thắc mặc là trường @timestamp liệu có đúng.
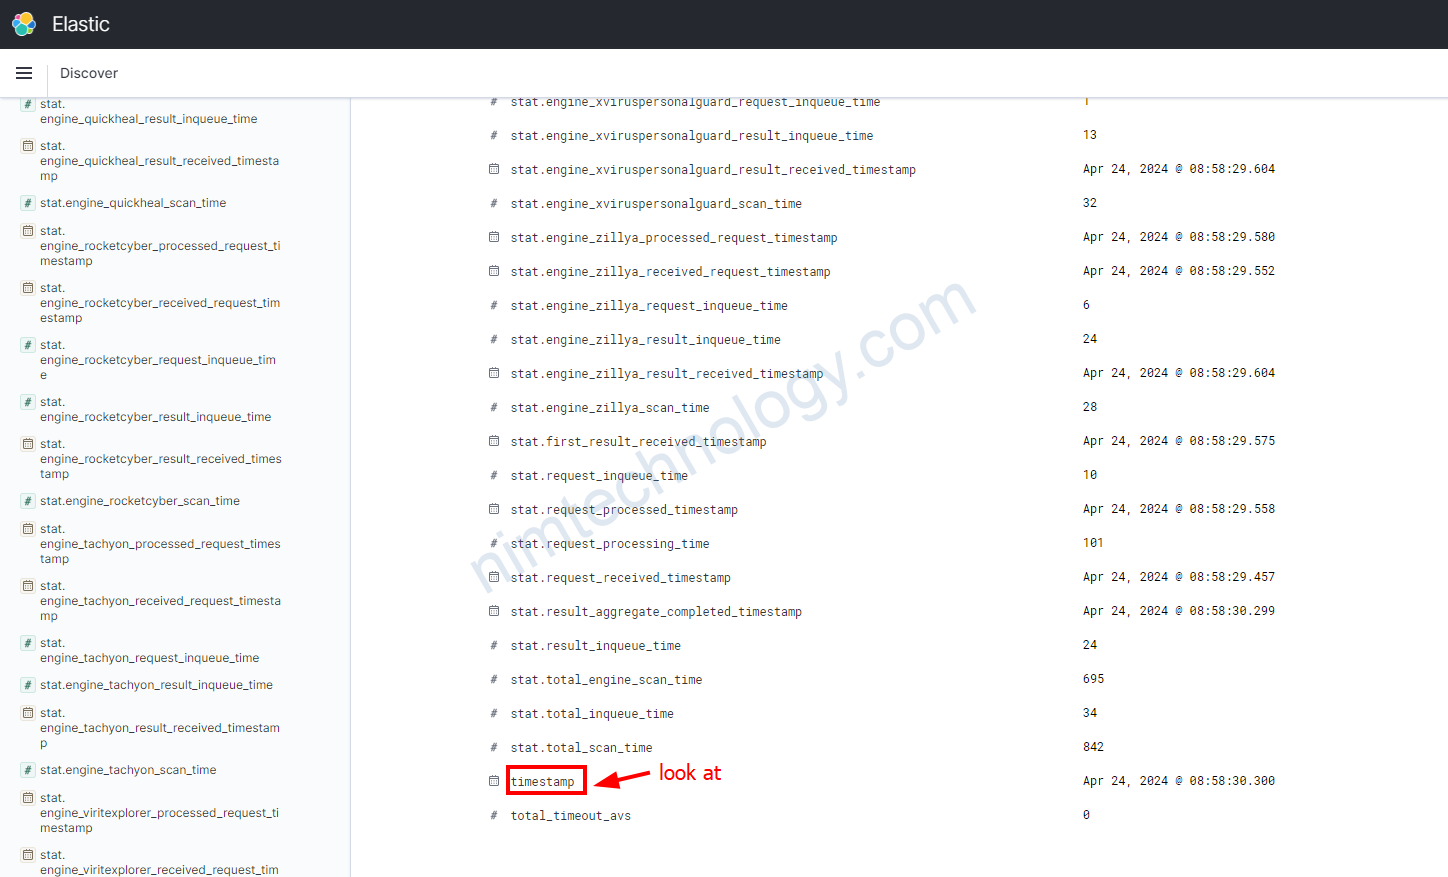
Khi mình discovery trên kibana thì nó chỉ là timestamp không có @
Mình đổi thành timestamp nó đã worked