Từ trước đến giờ chúng ta thưởng sử dụng auto scaling on k8s bằng HPA.
hoặc bạn cài các adapter prometheus rồi tương tác custom metrics feature với HPA.
Bài toán của mình đặt ra auto scaling pods on k8s base on metrics of Cloudwatch.
1) Install Keda on kubernetes.
https://keda.sh/docs/2.8/deploy/#helm
kubectl create namespace keda
helm repo add kedacore https://kedacore.github.io/charts
helm repo update
helm install keda kedacore/keda --namespace keda
2)Keda integrates with kafka.
Sau khi cài xong Keda, chúng ta integrate with kafka/ AWS MSK
https://keda.sh/docs/2.8/scalers/apache-kafka/
Hiện tại mình đang có MSK trên AWS.

Bạn cần tạo secret:
apiVersion: v1
kind: Secret
metadata:
  name: kafka-akhq-secrets
  namespace: xxxx
type: Opaque
data:
  tls: ZW5hYmxl # enable
Bạn cần tạo TriggerAuthentication và nó link tới secret bên trên. :
apiVersion: keda.sh/v1alpha1
kind: TriggerAuthentication
metadata:
  name: kafka-akhq-trigger-auth-credential
  namespace: qa-md-cloud-rest
spec:
  secretTargetRef:
  - parameter: tls
    name: kafka-akhq-secrets
    key: tls
Bạn cần tạo ScaledObject
apiVersion: keda.sh/v1alpha1
kind: ScaledObject
metadata:
  name: kafka-akhq-scaledobject
  namespace: qa-md-cloud-rest
spec:
  maxReplicaCount: 5
  minReplicaCount: 1
  pollingInterval: 10
  scaleTargetRef:
    name: kafka-akhq
  triggers:
    - authenticationRef:
        name: kafka-akhq-trigger-auth-credential
      metadata:
        activationLagThreshold: '3'
        bootstrapServers: b-2.xxx-msk-dev.dlweos.c12.kafka.us-west-2.amazonaws.com:9094
        consumerGroup: 4dbd50d3-008c-4be2-95b4-2aab77e16bcc
        lagThreshold: '100'
        offsetResetPolicy: latest
        topic: results
        #version: 1.37.2 # Version of your Kafka brokers. See IBM/sarama version (Default: 1.0.0, Optional)
      type: kafka
Mà keda sử dụng package này để integrate with kafka:
https://github.com/IBM/sarama
ScaledObject sẽ tạo ra HPA cho k8s

2.1) lagThreshold
Chúng ta sẽ tìm hiểu lagThreshold
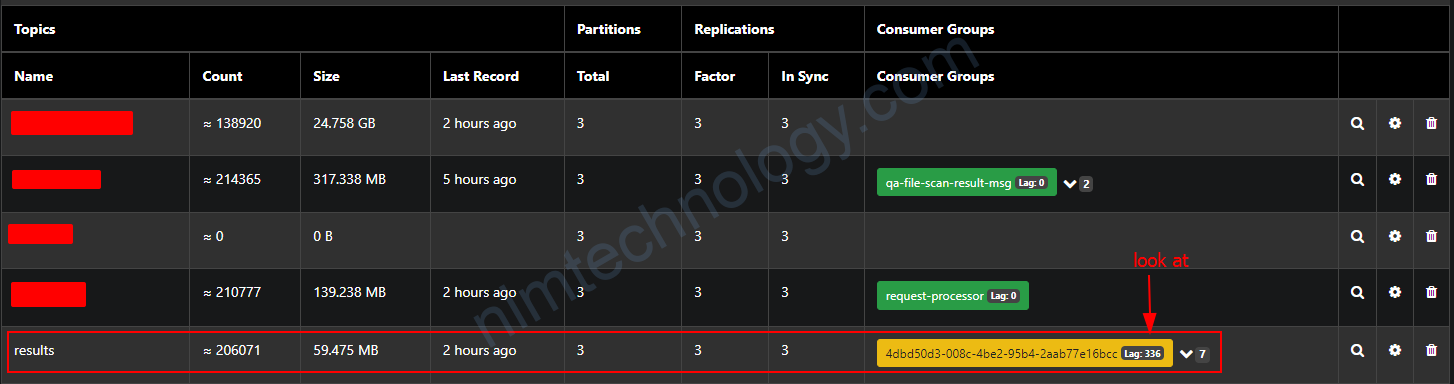


và 336/4 = 84
lagThreshold: bạn có thể hiểu là 1 consumer sẽ có khả năng consume được 100 messages.
SumOffsetLag / (number of pod) > lagThreshold ==> scale up the pods
2.2) allowIdleConsumers
Nhưng các bạn cũng đã biết nếu hoặc chưa biết
Số consumer luôn luôn <= “bé hơn hoặc bằng” số partition của 1 topic.
Nếu số consumer > partition thì số consumer dư là sẽ vào trang thái Idle (Starveling)
và Keda cũng biết điều này.
allowIdleConsumers – When set to true, the number of replicas can exceed the number of partitions on a topic, allowing for idle consumers. (Default: false, Optional)
==> Nếu bạn có nhu cấu số consumer > partition thì chỉnh: allowIdleConsumers: 'true'
Bạn có thể đọc issue này để hiểu hơn
https://github.com/kedacore/keda/issues/2908#issuecomment-1133605509
2.3) pollingInterval
This is the interval to check each trigger on. By default KEDA will check each trigger source on every ScaledObject every 30 seconds.
Nếu bạn muốn cập nhật nhanh hơn chỉnh số thấp.
2.4) Keda encounters the Issue when the topic doesn’t have any message or the offset is null
Mình đang có 1 ticket là observe the resources on k8s.
Mình đang có 1 deployment sử dụng kafka và mình cũng đang apply keda và kafka trigger for scaling to deployment đó.
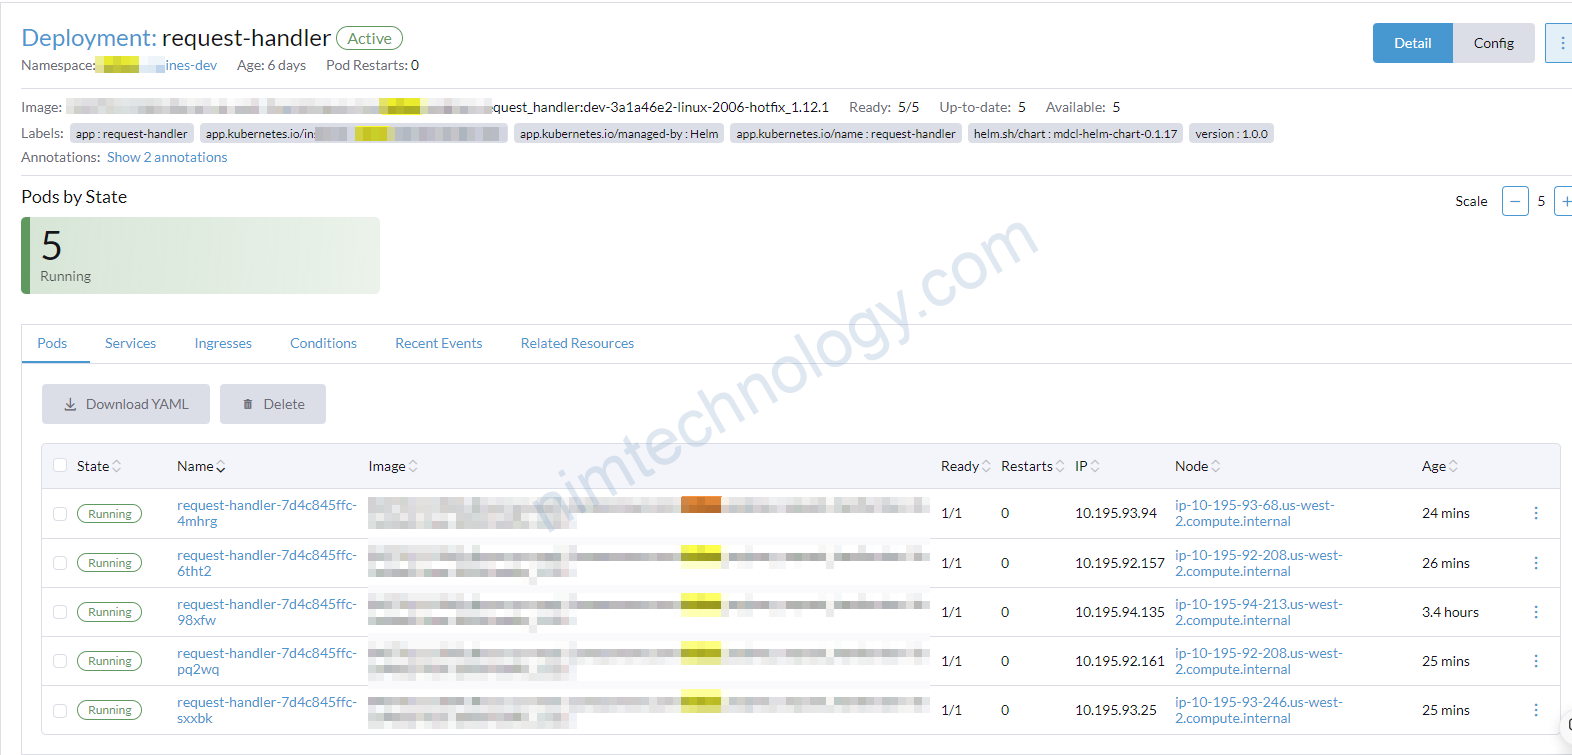
Hiện tại là deployment đang có 5 pods mà theo như mình đánh giá là topic đang không có message vậy tại sao pod này lại scale up như thế
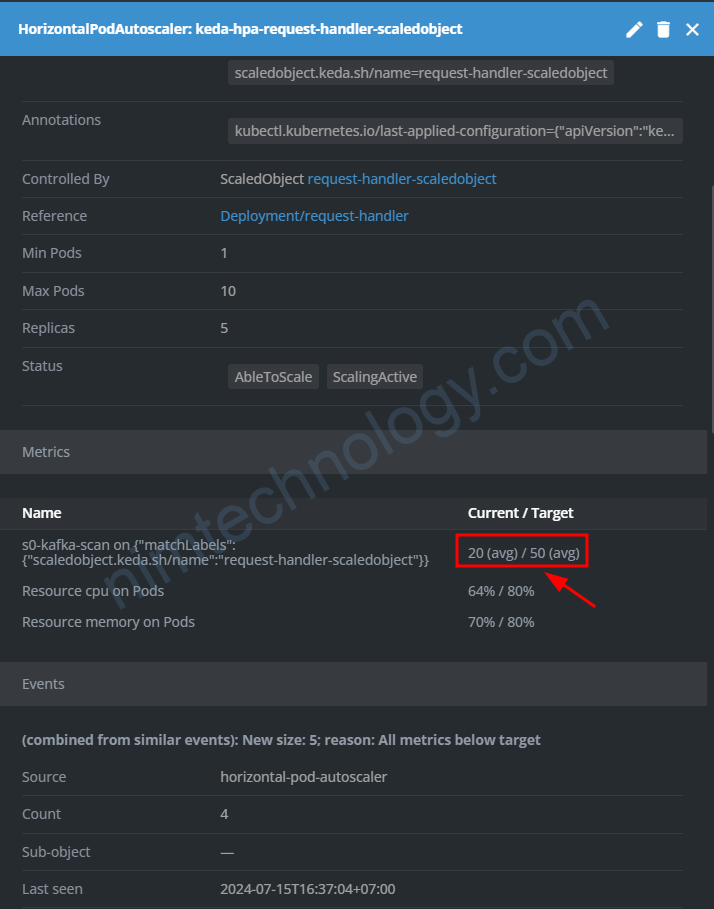
khi describe HPA thì thấy topic đang có lag messages


Nhưng mà topic đang không có message vậy chuyện gì đang sảy ra.

Và mình đã tìm hiểu config này: scaleToZeroOnInvalidOffset: false
When set to true, if a partition’s offset is invalid, the scaler reduces the number of consumers for that partition to zero. This helps avoid unnecessary resource usage when there are no valid offsets to process. If set to false, the scaler maintains a minimum of one consumer for the partition despite the invalid offset. This configuration is crucial for optimizing consumer resources based on partition offset validity.

các offset đang null.
Giờ tôi sẽ apply scaleToZeroOnInvalidOffset: true
và kiểm tra lại HPA:
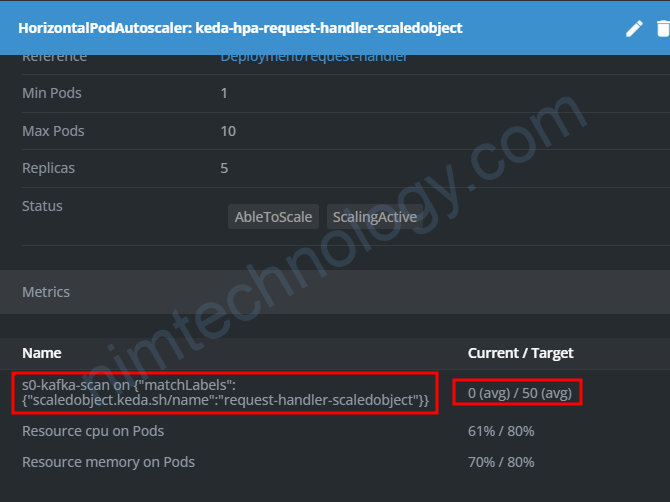

Thông số đã về report đúng
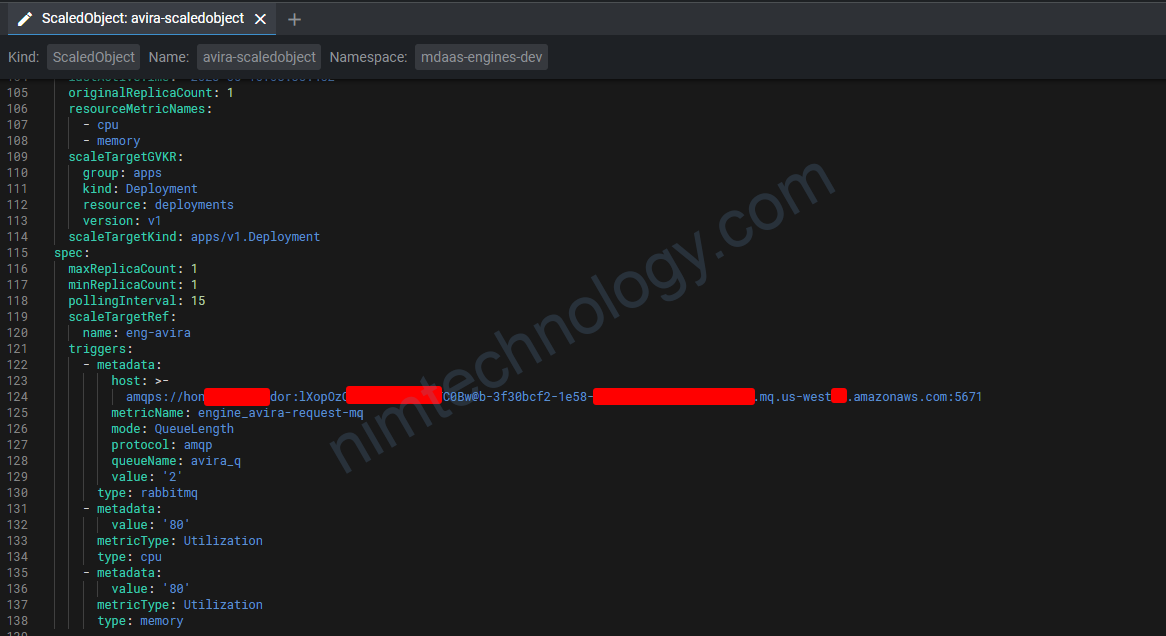
3) Keda integrates with Ram/CPU metrics.
https://keda.sh/docs/2.8/scalers/cpu/
apiVersion: keda.sh/v1alpha1
kind: ScaledObject
metadata:
  name: cpu-scaledobject
  namespace: default
spec:
  scaleTargetRef:
    name: my-deployment
  triggers:
    - metadata:
        value: '80'
      metricType: Utilization
      type: cpu
    - metadata:
        value: '80'
      metricType: Utilization
      type: memory
Parameter list:
type– Type of metric to use. Options areUtilization, orAverageValue.value– Value to trigger scaling actions for:- When using
Utilization, the target value is the average of the resource metric across all relevant pods, represented as a percentage of the requested value of the resource for the pods. - When using
AverageValue, the target value is the target value of the average of the metric across all relevant pods (quantity).
- When using
containerName– Name of the specific container to scale based on its CPU, rather than the entire pod. Defaults to empty if not specified.
4) Keda integrates with RabbitMQ
Ồ dê, Keda cũng có thể đọc thẳng vào queue là lấy ra lượng message chưa được sử lý.
https://keda.sh/docs/2.8/scalers/rabbitmq-queue/
Đây là config của mình:
apiVersion: keda.sh/v1alpha1
kind: ScaledObject
metadata:
  name: workload1-nimtechnology-scaledobject
spec:
  scaleTargetRef:
    name: workload1-nimtechnology
  minReplicaCount: 1
  maxReplicaCount: 4
  pollingInterval: 15
  triggers:
    - type: rabbitmq
      metadata:
        host: amqp://guest:guest@192.168.101.27:5672
        protocol: amqp
        queueName: publisher
        mode: QueueLength
        value: "2"
host– Host of RabbitMQ with format<protocol>://<host>:<port>/vhost. The resolved host should follow a format likeamqp://guest:password@localhost:5672/vhostorhttp://guest:password@localhost:15672/vhost. When using a username/password consider usinghostFromEnvor a TriggerAuthentication.protocol– Protocol to be used for communication. (Values:auto,http,amqp, Default:auto, Optional)queueName– Name of the queue to read message from.mode– QueueLength to trigger on number of messages in the queue. MessageRate to trigger on the publish rate into the queue. (Values:QueueLength,MessageRate)
Ook giờ mình sẽ giải thích một chút
Với config ….mode: QueueLength
value: "2"
Nó sẽ lấy message backlog và bạn có thể hiểu là những message được lấy bới consumers.
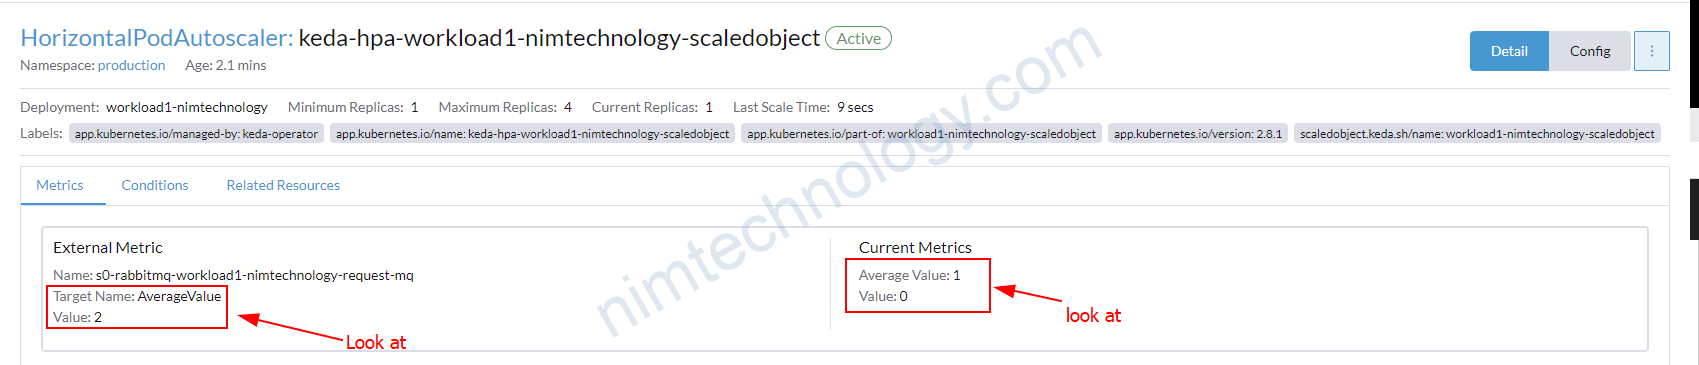
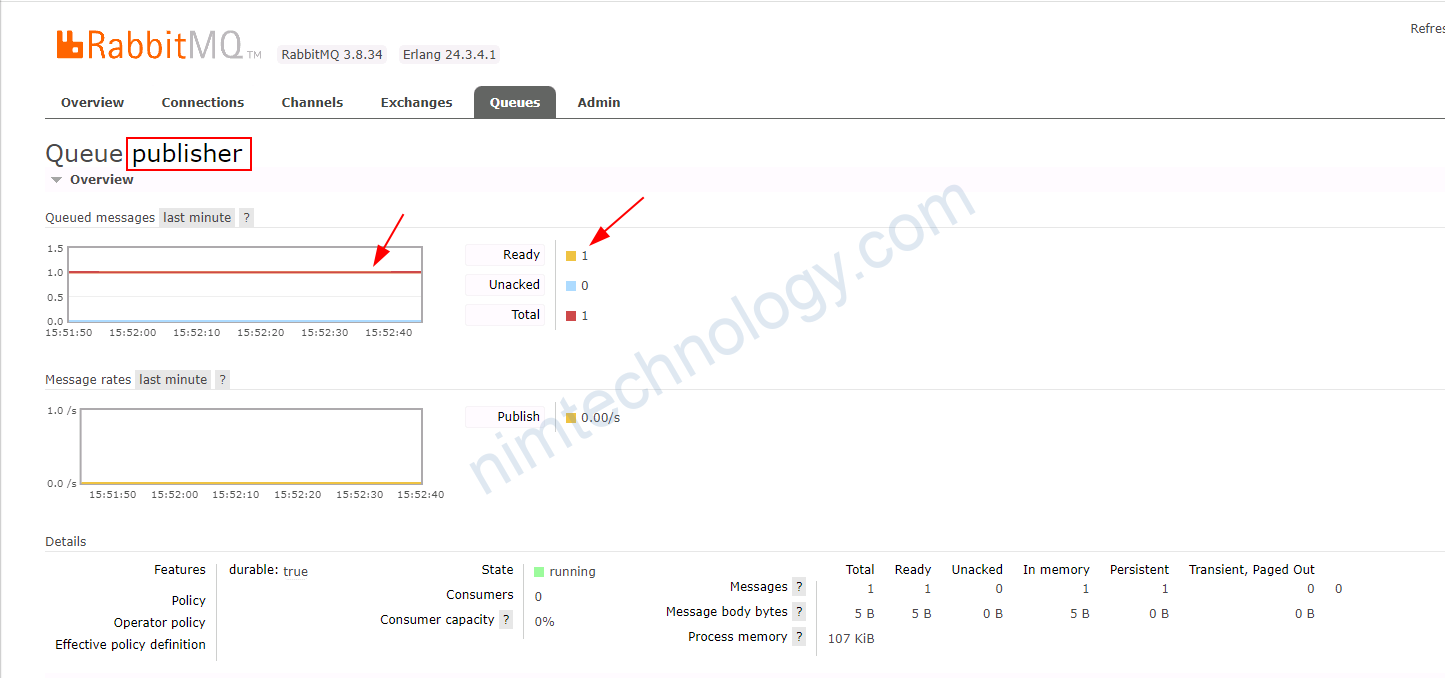
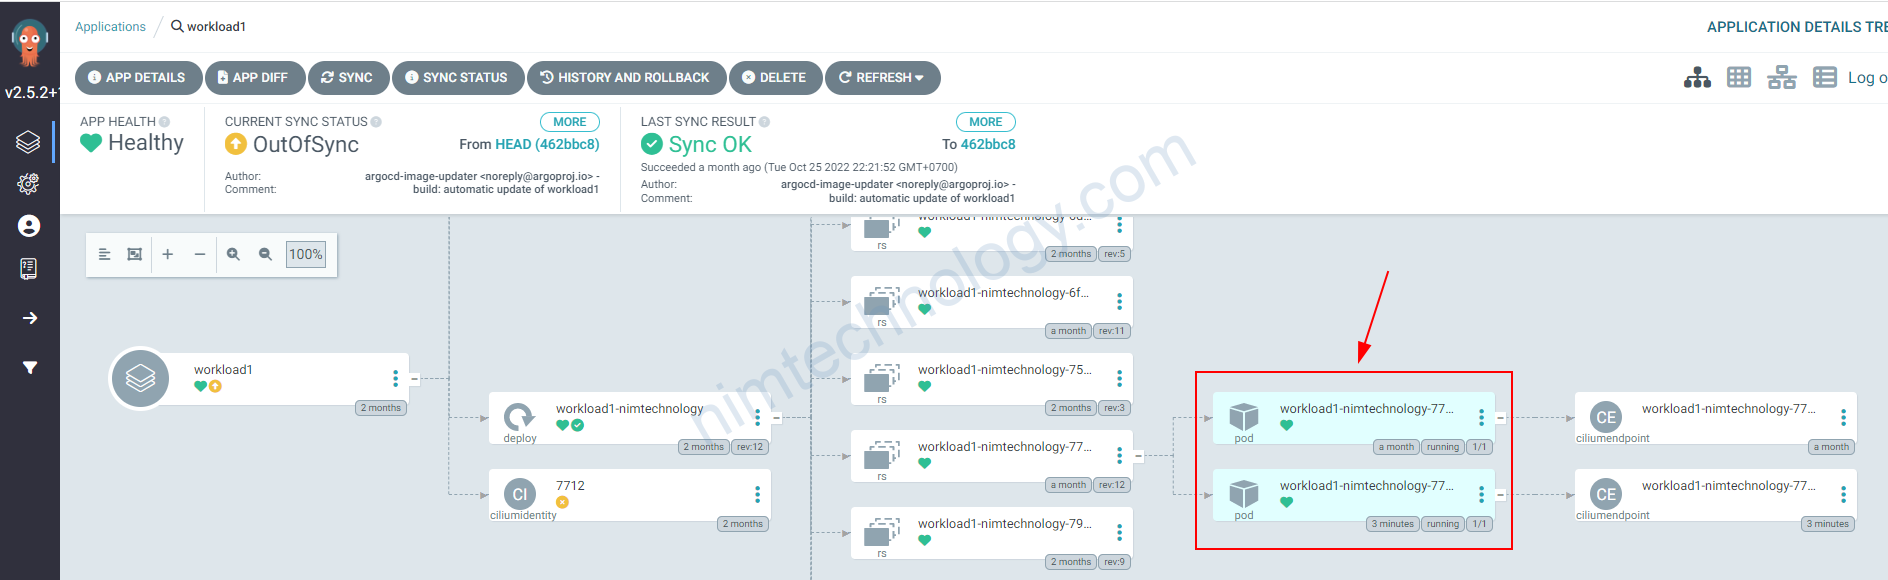
Bạn có thể thấy External Metric có giá trị là 2
Current Metric đang có Average Value là 1 <<<<====Tại sao nhỉ???

Nếu (Totals message in backlog) / (Numbers of Pod) lớn hơn External Metric ===> scale up pods of Deployment
Tiếp theo mình push thêm 2 message vào queue:
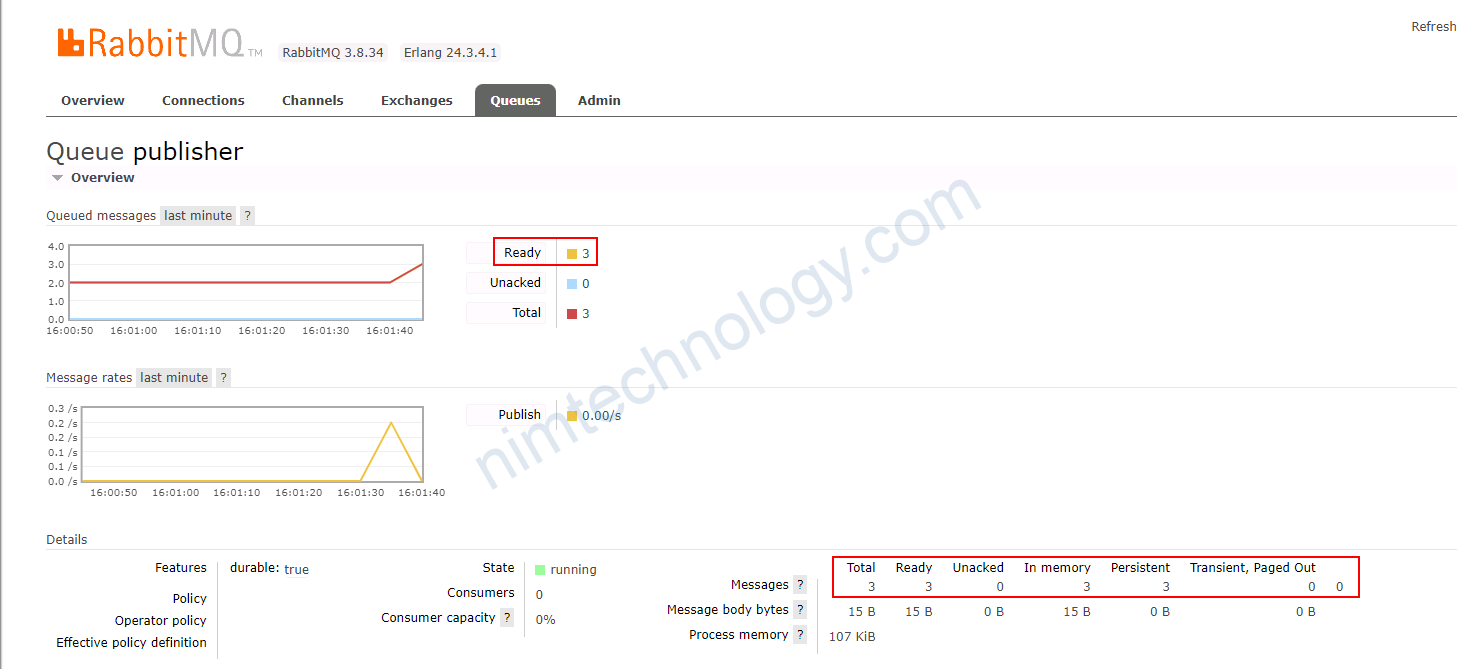
Bạn có thể thấy HPA current metrics đã có sự thay đổi.
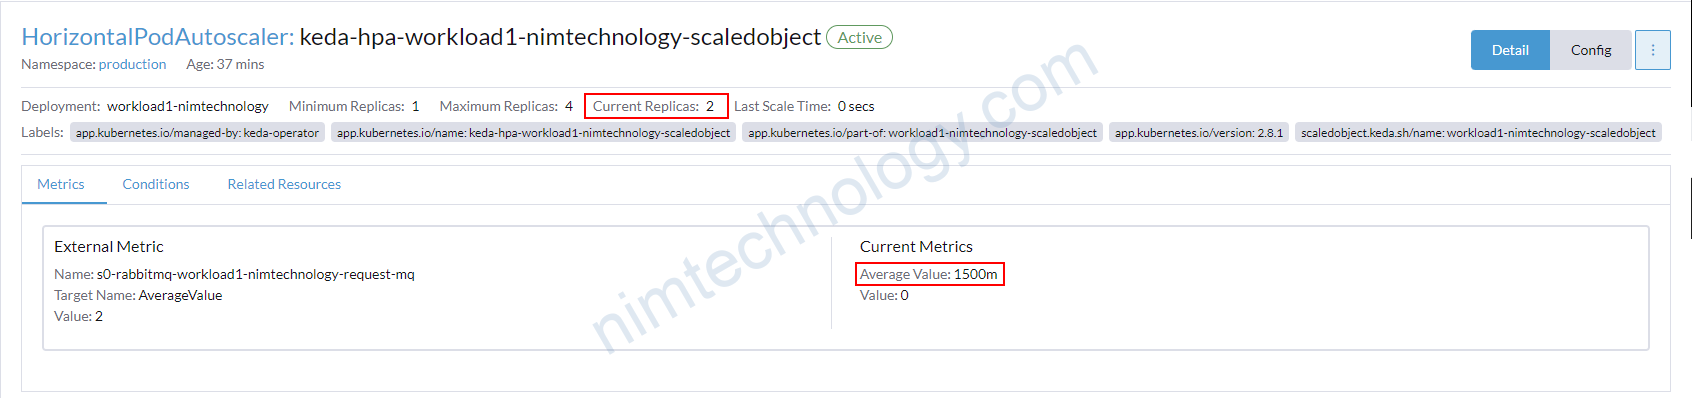
và pod đã tăng lên 2
OK nhé.
Hide the authentication(user/pass) to connect RabbitMQ
Best practice là chúng ta sẽ không để passwork trên github.
Bạn tạo 1 secret chưa host: amqp://guest:password@localhost:5672
apiVersion: v1
kind: Secret
metadata:
  name: keda-rabbitmq-secret
data:
  host: <AMQP URI connection string> # base64 encoded value of format amqp://guest:password@localhost:5672/vhost
Tạo 1 trigger authen để map vào secret trên
apiVersion: keda.sh/v1alpha1
kind: TriggerAuthentication
metadata:
  name: keda-trigger-auth-rabbitmq-conn
  namespace: default
spec:
  secretTargetRef:
    - parameter: host
      name: keda-rabbitmq-secret
      key: host
Sau đó bạn thêm trigger authencation
apiVersion: keda.sh/v1alpha1
kind: ScaledObject
metadata:
  name: rabbitmq-scaledobject
  namespace: default
spec:
  scaleTargetRef:
    name: rabbitmq-deployment
  triggers:
  - type: rabbitmq
    metadata:
      protocol: amqp
      queueName: testqueue
      mode: QueueLength
      value: "20"
      metricName: custom-testqueue # DEPRECATED: This parameter is deprecated as of KEDA v2.10 and will be removed in version `2.12`. optional. Generated value would be `rabbitmq-custom-testqueue`
    authenticationRef:
      name: keda-trigger-auth-rabbitmq-conn ## look at
5) Keda integrates with ActiveMQ (artemis).
apiVersion: keda.sh/v1alpha1
kind: ScaledObject
metadata:
  name: rabbitmq-scaledobject
  namespace: default
spec:
  scaleTargetRef:
    name: rabbitmq-deployment
  triggers:
    - authenticationRef:
        name: trigger-auth-kedartemis
      metadata:
        activationQueueLength: '1'
        queueLength: '1'
        restApiTemplate: >-
          http://active-mq.nim-engines-staging.svc.cluster.local:8161/console/jolokia/read/org.apache.activemq.artemis:broker="0.0.0.0",component=addresses,address="global_timeout",subcomponent=queues,routing-type="multicast",queue="nim-result-handler.sub-global_timeout-nim"/DeliveringCount
      type: artemis-queue
URL Breakdown:
Base URL:
- http://active-mq.nim-engines-staging.svc.cluster.local:8161/console/jolokia/
- Protocol: http
- Hostname: active-mq.nim-engines-staging.svc.cluster.local – This is the domain name of the ActiveMQ Artemis service, typically in a Kubernetes cluster.
- Port: 8161 – The port on which the Jolokia agent is running.
- Path: /console/jolokia/ – The path to the Jolokia endpoint.
Jolokia Operation:
- read – This operation is used to read an attribute of an MBean.
MBean Identifier:
- org.apache.activemq.artemis:broker=”0.0.0.0″,component=addresses,address=”global_timeout”,subcomponent=queues,routing-type=”multicast”,queue=”nim-result-handler.sub-global_timeout-nim”
- Domain: org.apache.activemq.artemis – The domain namespace for ActiveMQ Artemis MBeans.
- broker: “0.0.0.0” – Specifies the broker. The address 0.0.0.0 typically means it listens on all network interfaces.
- component: addresses – This refers to the component type within the broker, specifically addressing.
- address: “global_timeout” – This is likely a specific address or topic configured in the broker.
- subcomponent: queues – This indicates that the subcomponent type being accessed is a queue.
- routing-type: “multicast” – Specifies the routing type of the queue, which in this case is multicast. Multicast routing is used for pub-sub (publish-subscribe) messaging.
- queue: “nim-result-handler.sub-global_timeout-nim” – The name of the queue.
Attribute:
- DeliveringCount
- This attribute typically represents the number of messages that are currently being delivered but not yet acknowledged.
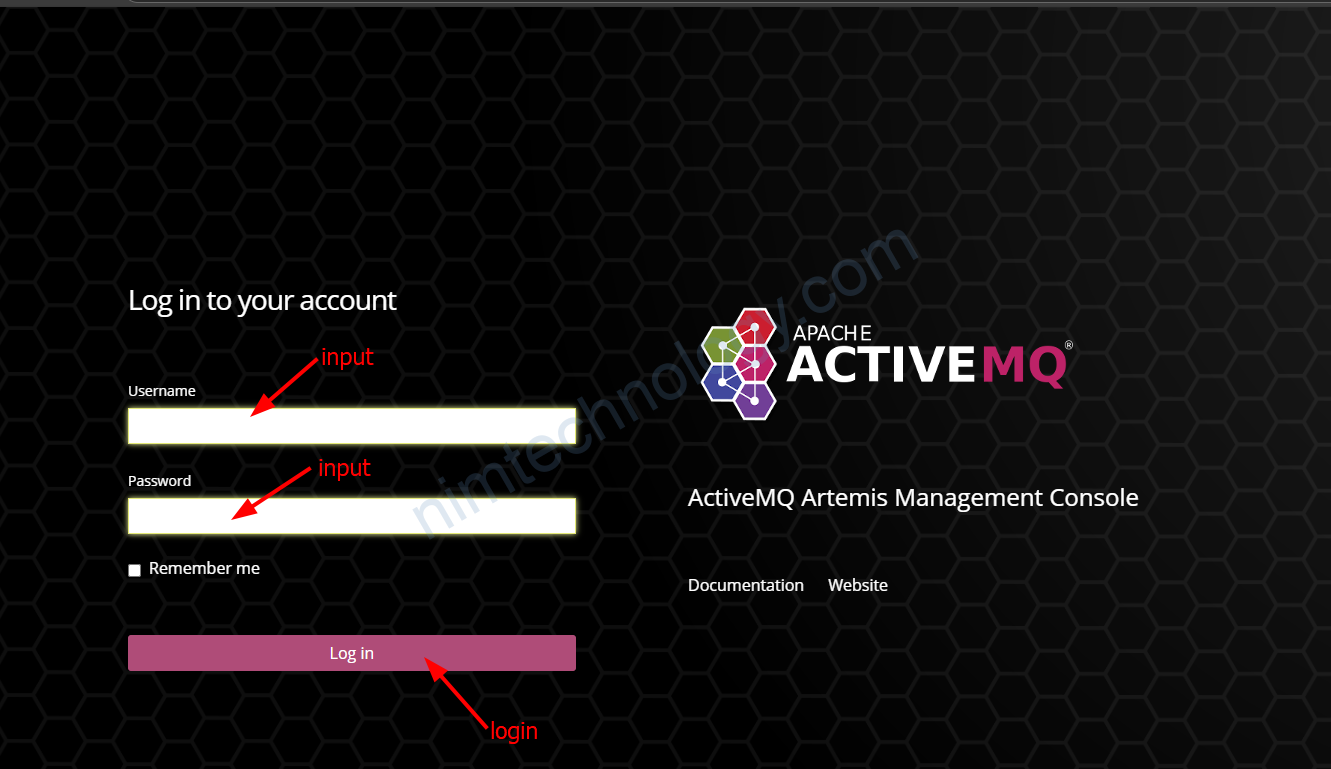
Để dễ dàng tìm ra restApiTemplate bạn có thể đi vào console của artemis:

Bạn click vào phần queue
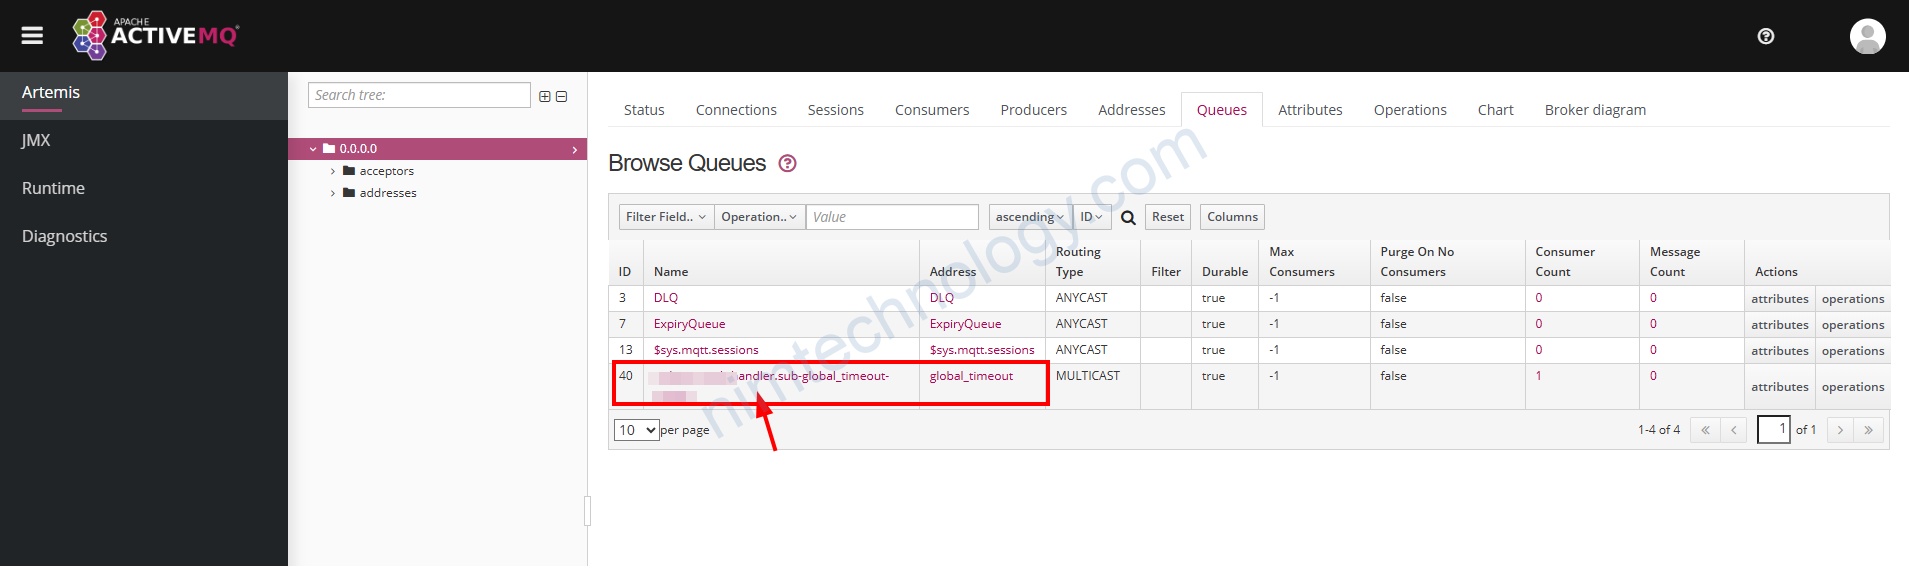
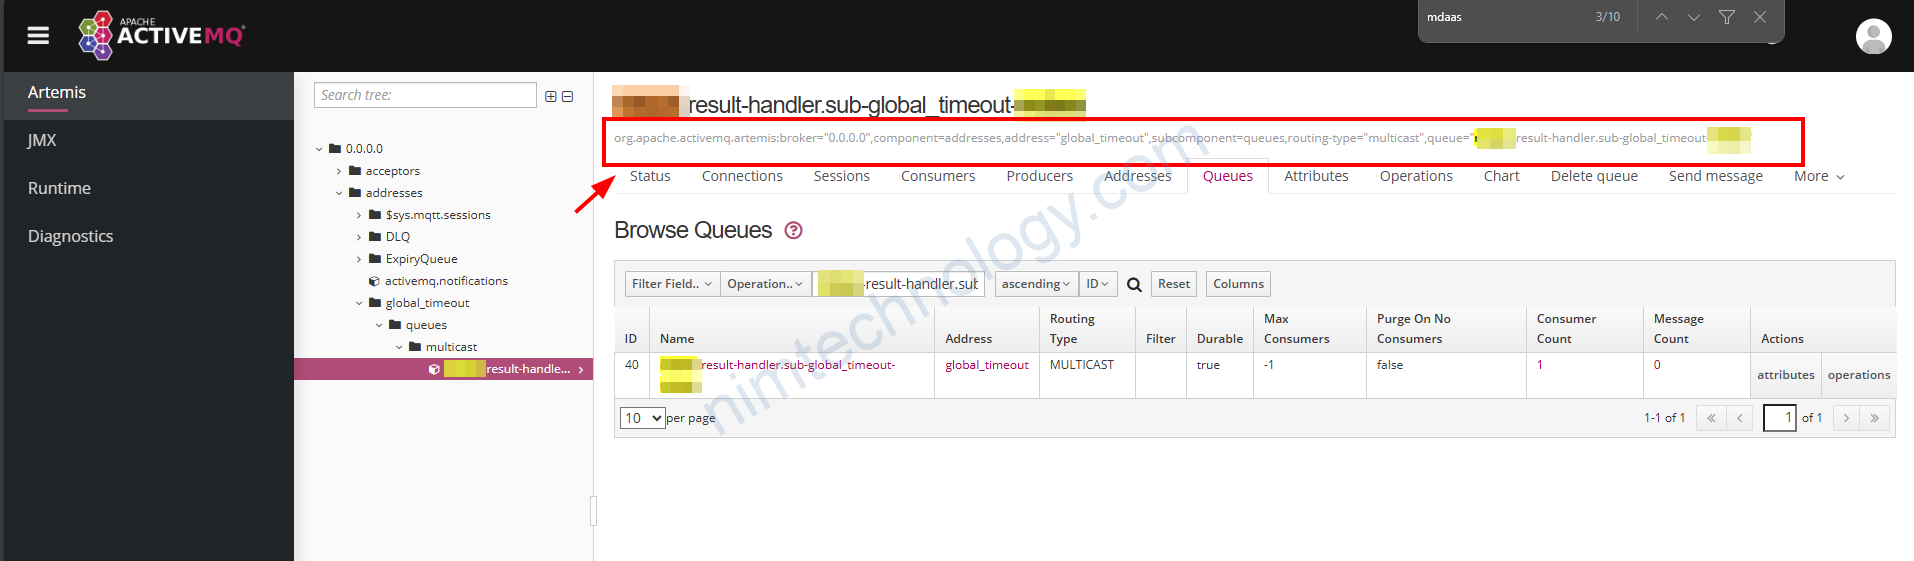
Bạn chú ý cài dòng như ở hình trên và tìm ra điểm chung để thay thế configure
How to reduce connections from KEDA to RabbitMQ
trong 1 số trường hợp bạn được report là Keda đang tạo quá nhiều connection đến rabbitMQ. Đó là nguyên nhân dẫn đến việc RabbitMQ consume nhiều memory.
Vậy làm sao để giảm số lượng connection đến RabbitMQ từ Keda.
Chúng ta sẽ monitor rabbitMQ thông qua Http protocol.
triggers:
- type: rabbitmq
  metadata:
    host: http://guest:password@localhost:15672
    protocol: http
    mode: QueueLength
    value: "100.50"
    activationValue: "10.5"
    queueName: testqueue
    unsafeSsl: true

5) Declare the behavior of HPA in KEDA
Nếu bạn đã làm việc nhiều với HPA bạn sẽ biết trong HPA có 1 feature là Behavior
Mình cũng có 1 bài nói về Behavior trong HPA:
Vậy thì apply cho keda như thế nào?
https://github.com/kedacore/keda-docs/blob/main/content/docs/2.0/concepts/scaling-deployments.md#scaledobject-spec
apiVersion: keda.sh/v1alpha1
kind: ScaledObject
metadata:
  name: {scaled-object-name}
spec:
  scaleTargetRef:
    apiVersion:    {api-version-of-target-resource}  # Optional. Default: apps/v1
    kind:          {kind-of-target-resource}         # Optional. Default: Deployment
    name:          {name-of-target-resource}         # Mandatory. Must be in the same namespace as the ScaledObject
    envSourceContainerName: {container-name}         # Optional. Default: .spec.template.spec.containers[0]
  pollingInterval: 30                                # Optional. Default: 30 seconds
  cooldownPeriod:  300                               # Optional. Default: 300 seconds
  minReplicaCount: 0                                 # Optional. Default: 0
  maxReplicaCount: 100                               # Optional. Default: 100
  advanced:                                          # Optional. Section to specify advanced optionsapiVersion: keda.sh/v1alpha1
kind: ScaledObject
metadata:
  name: {scaled-object-name}
spec:
  scaleTargetRef:
    apiVersion:    {api-version-of-target-resource}  # Optional. Default: apps/v1
    kind:          {kind-of-target-resource}         # Optional. Default: Deployment
    name:          {name-of-target-resource}         # Mandatory. Must be in the same namespace as the ScaledObject
    envSourceContainerName: {container-name}         # Optional. Default: .spec.template.spec.containers[0]
  pollingInterval: 30                                # Optional. Default: 30 seconds
  cooldownPeriod:  300                               # Optional. Default: 300 seconds
  minReplicaCount: 0                                 # Optional. Default: 0
  maxReplicaCount: 100                               # Optional. Default: 100
  advanced:                                          # Optional. Section to specify advanced options
    restoreToOriginalReplicaCount: true/false        # Optional. Default: false
    horizontalPodAutoscalerConfig:                   # Optional. Section to specify HPA related options
      behavior:                                     # Optional. Use to modify HPA's scaling behavior
        scaleUp:
          stabilizationWindowSeconds: 0
          selectPolicy: Max
          policies:
            - type: Pods
              value: 4
              periodSeconds: 15
            - type: Percent
              value: 100
              periodSeconds: 15
        scaleDown:
          stabilizationWindowSeconds: 10
          selectPolicy: Max
          policies:
            - type: Pods
              value: 1
              periodSeconds: 20
  triggers:
  # {list of triggers to activate scaling of the target resource}
    restoreToOriginalReplicaCount: true/false        # Optional. Default: false
    horizontalPodAutoscalerConfig:                   # Optional. Section to specify HPA related options
      behavior:                                     # Optional. Use to modify HPA's scaling behavior
        scaleUp:
      stabilizationWindowSeconds: 0
      selectPolicy: Max
      policies:
        - type: Pods
          value: 4
          periodSeconds: 15
        - type: Percent
          value: 100
          periodSeconds: 15
    scaleDown:
      stabilizationWindowSeconds: 10
      selectPolicy: Max
      policies:
        - type: Pods
          value: 1
          periodSeconds: 20
  triggers:
  # {list of triggers to activate scaling of the target resource}
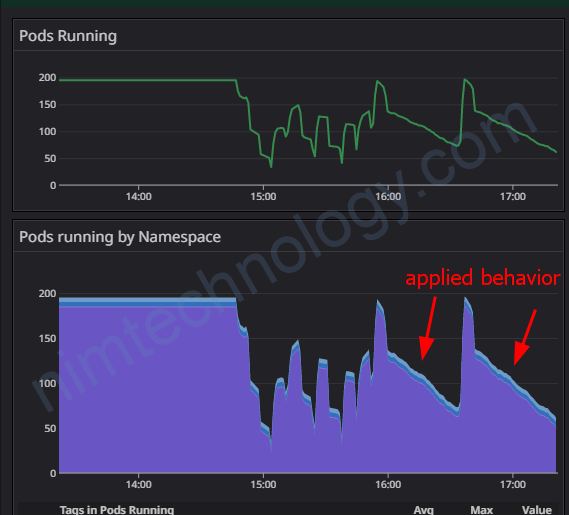
scaling up so fast
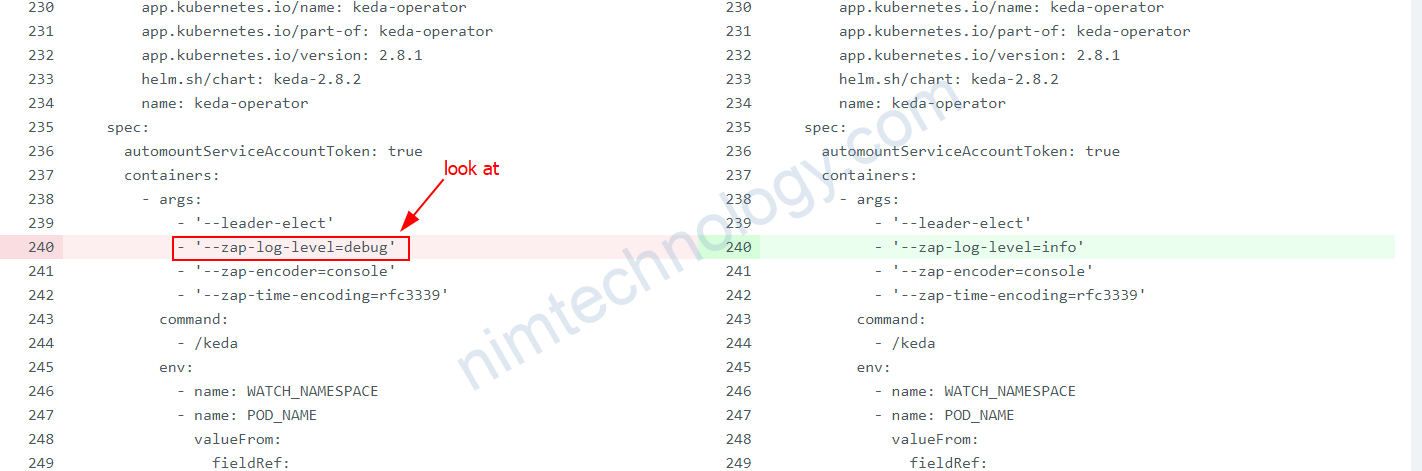
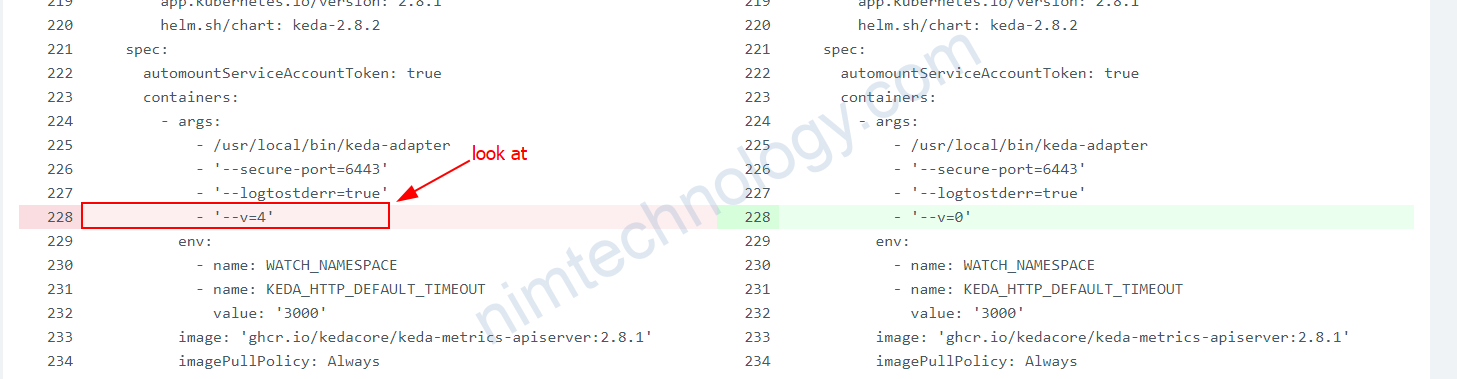
Debug on Keda
Nếu bạn muốn debug trên Keda thì bạn cần chỉnh
https://github.com/kedacore/keda/blob/main/BUILD.md#setting-log-levels
Deployment: keda-operator
deployment: keda-operator-metrics-apiserver
KEDA might break existing deployment on cluster which already has another External Metrics Adapter installed
Các bạn cần lưu ý điều này.
https://github.com/kedacore/keda/issues/470
Edit the objects belong to KEDA
Bạn muốn sửa ScaledObject:
kubectl edit scaledobject.keda.sh/<name> -n <namespace>Enable metrics of Keda.
strong value helm bạn cần thêm như sau:
prometheus:
  metricServer:
    enabled: true
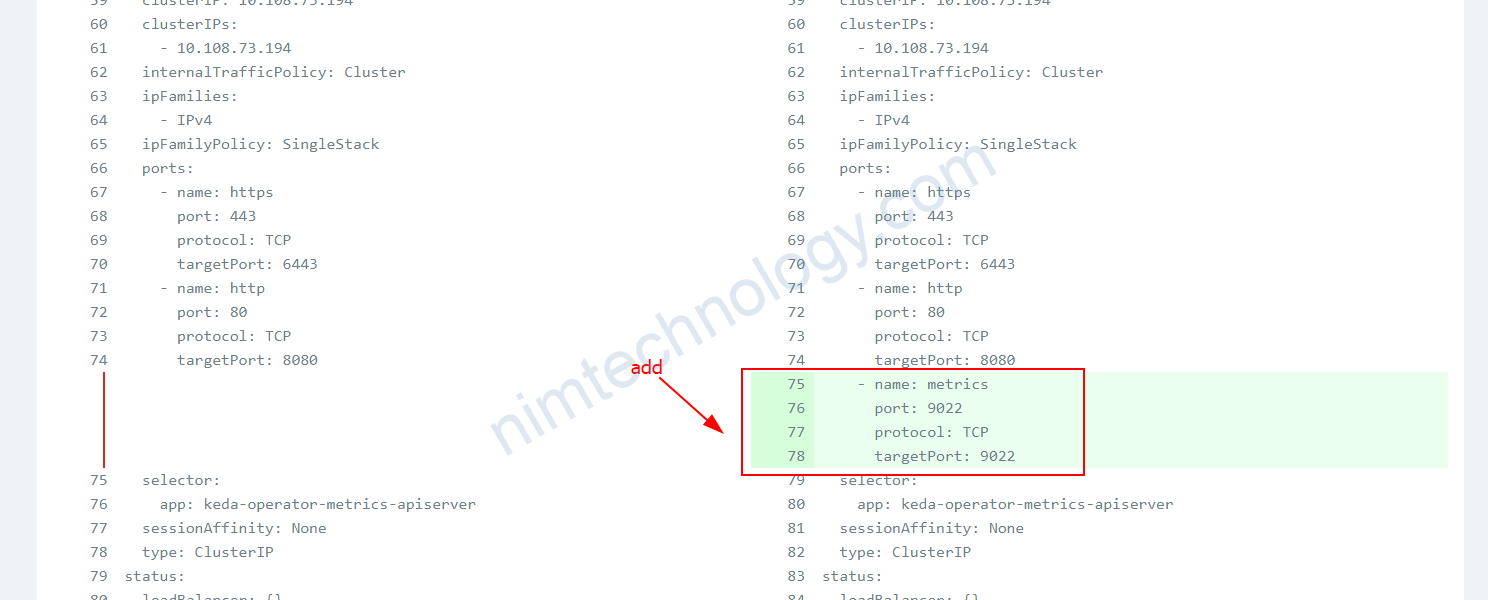
Cách thử 2 bạn sửa deployment và service
Service: keda-operator-metrics-apiserver
spec:
  ports:
    - name: https
      port: 443
      protocol: TCP
      targetPort: 6443
    - name: http
      port: 80
      protocol: TCP
      targetPort: 8080
    - name: metrics
      port: 9022
      protocol: TCP
      targetPort: 9022
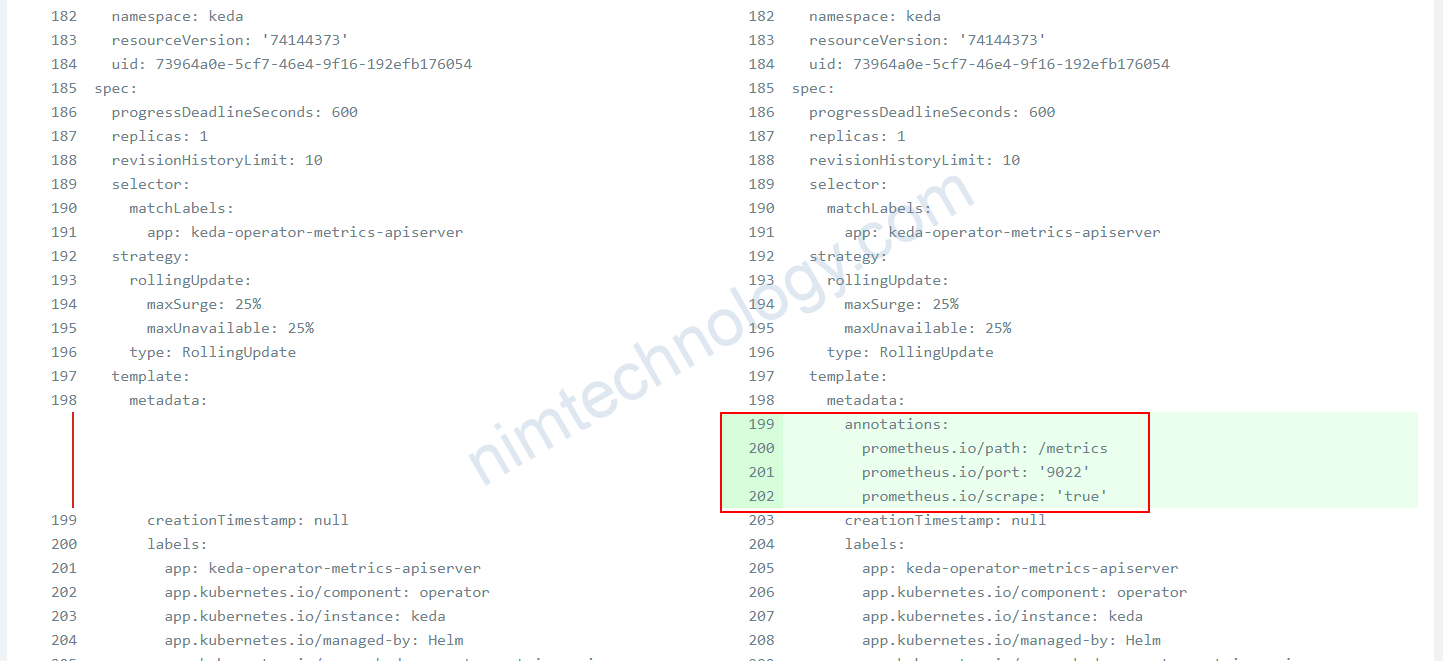
Deployment: keda-operator-metrics-apiserver
  template:
    metadata:
      annotations:
        prometheus.io/path: /metrics
        prometheus.io/port: '9022'
        prometheus.io/scrape: 'true'
    spec:
      automountServiceAccountToken: true
      containers:
        - args:
            - /usr/local/bin/keda-adapter
            - '--secure-port=6443'
            - '--logtostderr=true'
            - '--metrics-port=9022'
            - '--metrics-path=/metrics'
            - '--v=0'

name: keda-operator-metrics-apiserver
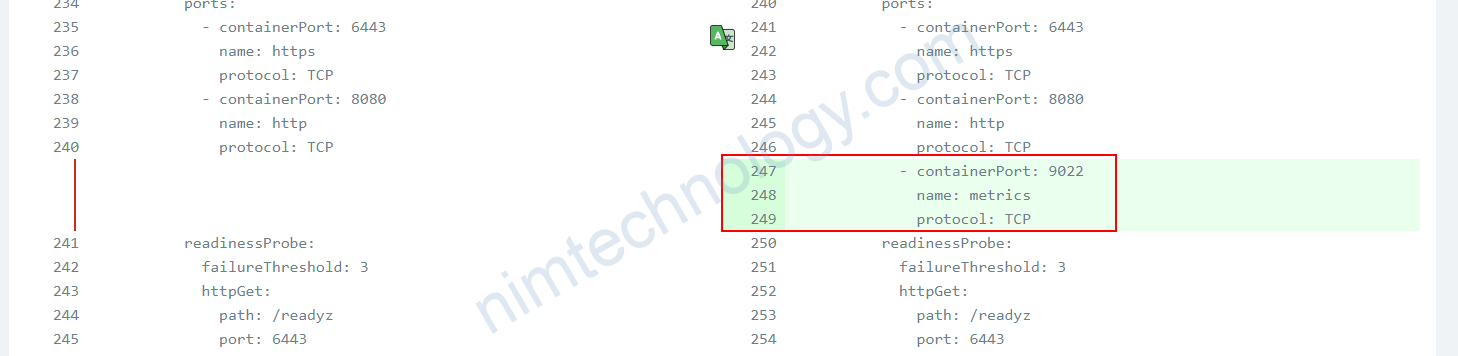
ports:
- containerPort: 6443
name: https
protocol: TCP
- containerPort: 8080
name: http
protocol: TCP
- containerPort: 9022
name: metrics
protocol: TCP
readinessProbe:
httpGet:
path: /readyz
port: 6443
scheme: HTTPS
How to scale the component to 0 from N by Keda
Trong 1 số trường bạn sẽ cần scale down số pod xuống 0

Nhưng nếu chỉnh maxReplicaCount, minReplicaCount xuống 0 ngày thì sẽ gặp lỗi:
2024-07-19T07:36:47.256100422Z 2024-07-19T07:36:47Z ERROR Reconciler error {"controller": "scaledobject", "controllerGroup": "keda.sh", "controllerKind": "ScaledObject", "ScaledObject": {"name":"archive-ikarus-scaledobject","namespace":"nim-engines-dev"}, "namespace": "nim-engines-dev", "name": "archive-ikarus-scaledobject", "reconcileID": "e80d1f5d-6f78-430f-9baa-52f518613cf2", "error": "MinReplicaCount=1 must be less than MaxReplicaCount=0"}Và bạn BananaSorcery đã chỉ mình như sau:
Đầu tiên bạn phải để cho ScaleObject tạo được HPA

Sau đó bạn chỉnh maxReplicaCount, minReplicaCount xuống 0 thì HPA sẽ được chỉnh xuống 0
Issues when provisioning Keda.
keda-operator error creating kafka client: kafka: client has run out of available brokers
Gần đây bên SRE có báo mình là ScaledObject bị lỗi false và trong describe:
Warning  KEDAScalerFailed  85s (x3629 over 41d)  keda-operator  error creating kafka client: kafka: client has run out of available brokers to talk to: 3 errors occurred:                                                        │
│            * unexpected EOF                                                                                                                                                                                                         │
│            * unexpected EOF                                                                                                                                                                                                         │
│            * unexpected EOF                                                                                                                                                                                                         │
│   Warning  ScaledObjectCheckFailed  85s (x3629 over 41d)  keda-operator  Failed to ensure HPA is correctly created for ScaledObject
Bạn cần kiểm tra lại ScaledObject, TriggerAuthentication, Secret đã được tạo đầy đủ hay chưa?
https://github.com/kedacore/keda/discussions/2636
Scaling is not performed because triggers are not active.
Keda 2.12+
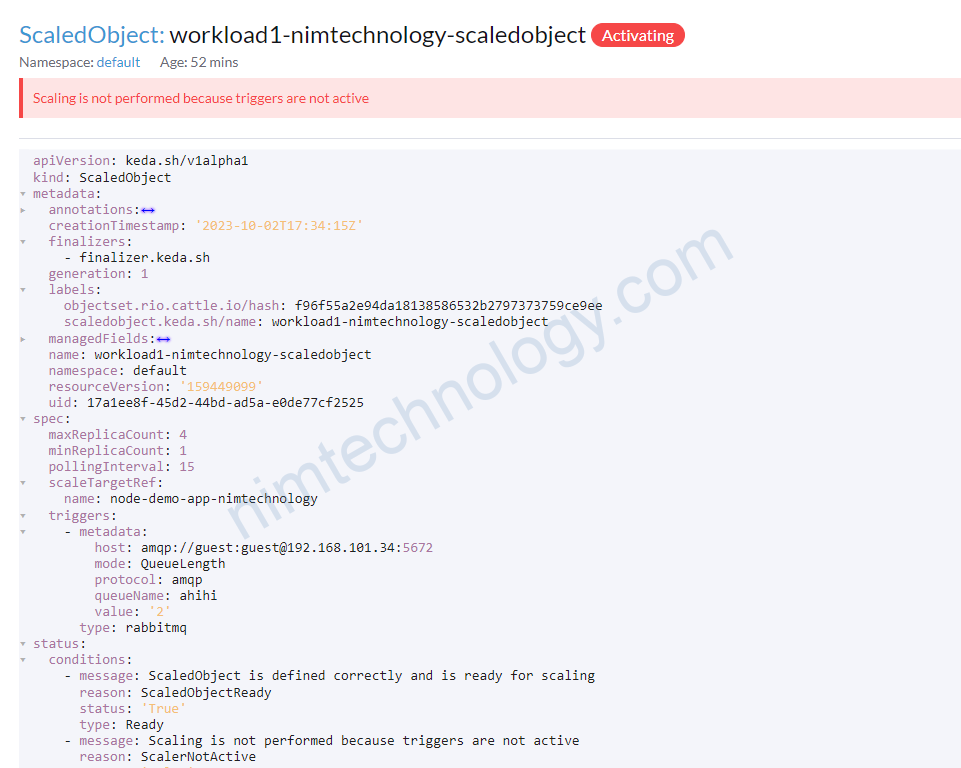
Bạn sẽ thấy ScaleObject báo lỗi này:
– status: Activating
– Scaling is not performed because triggers are not active
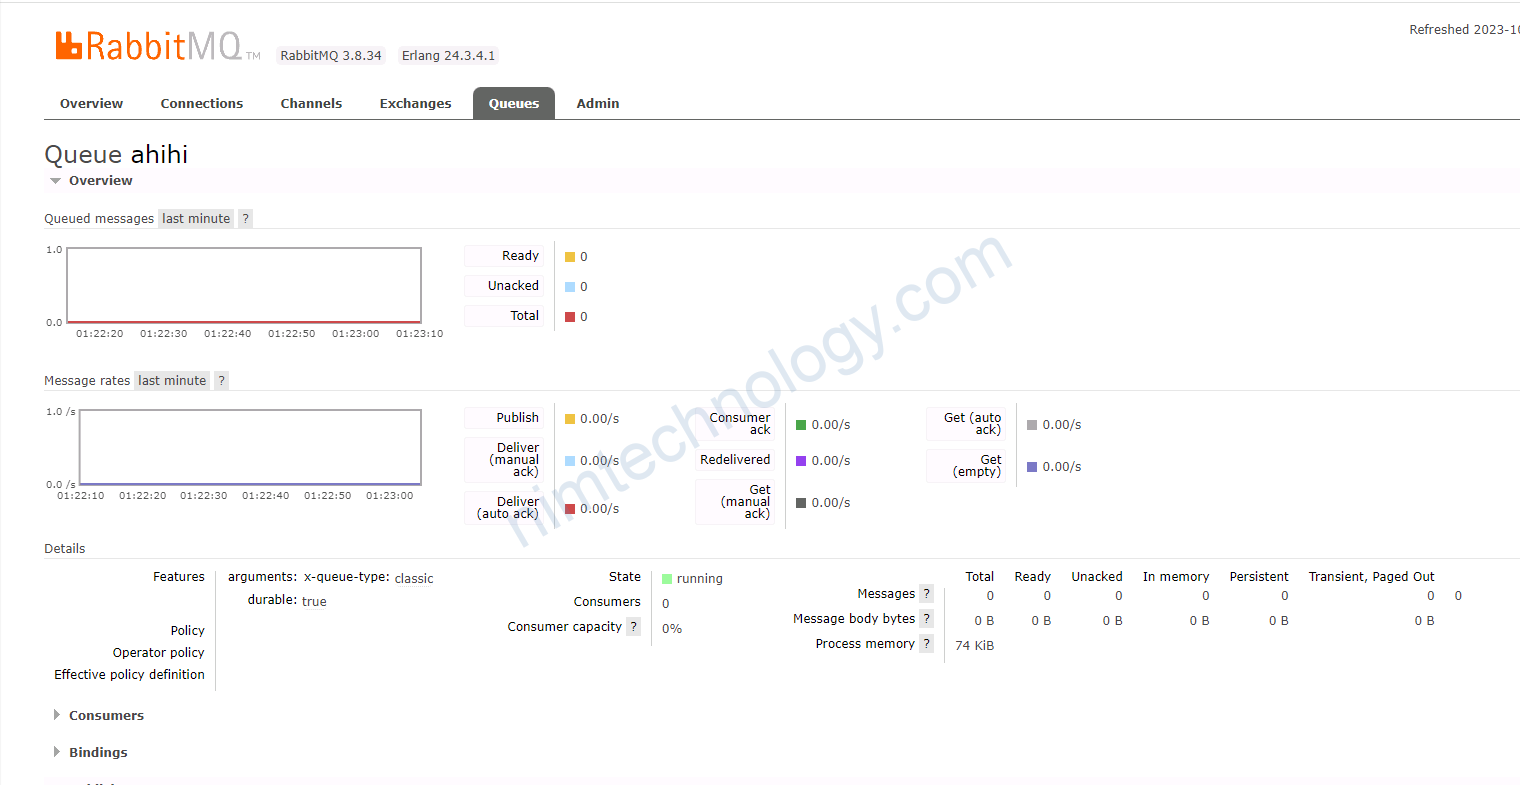
Lúc này queue ko có message nào cả:
Sau đó mình thử push 1 message vào
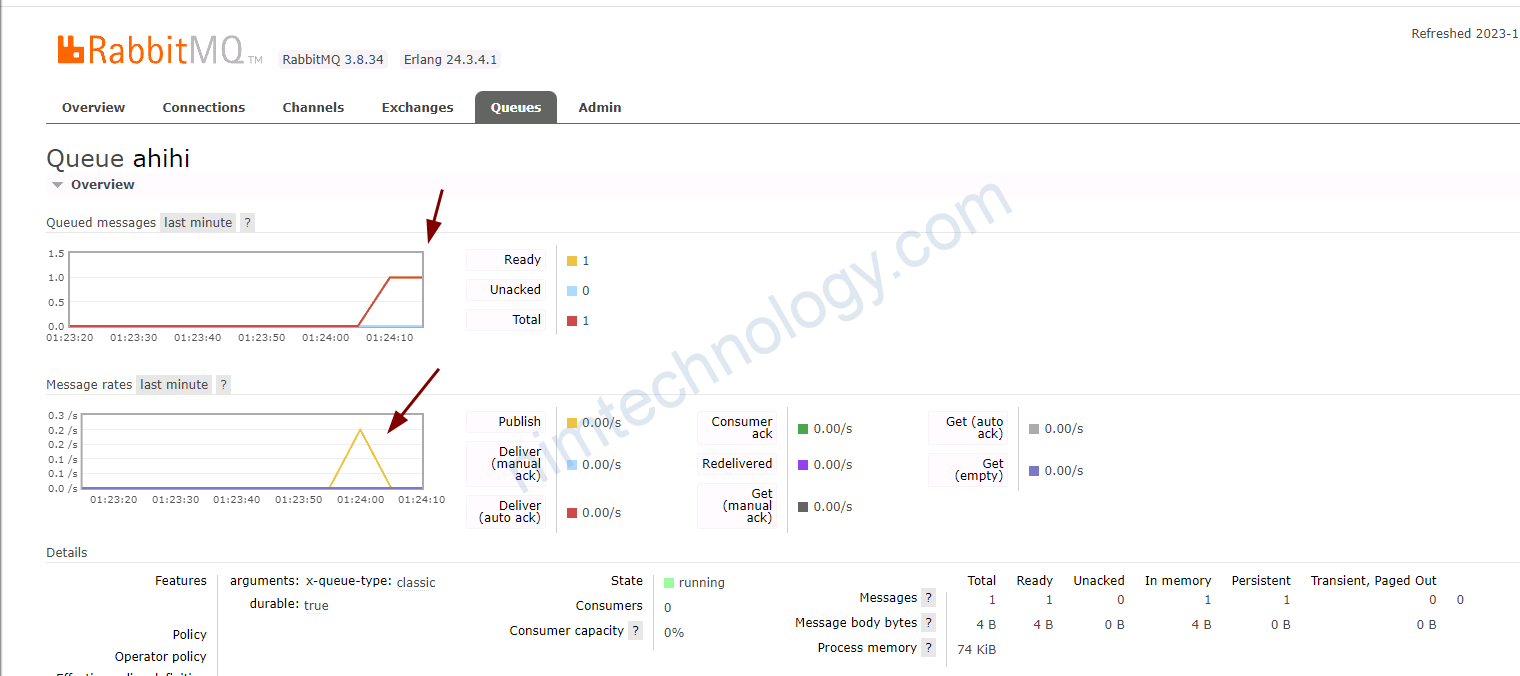
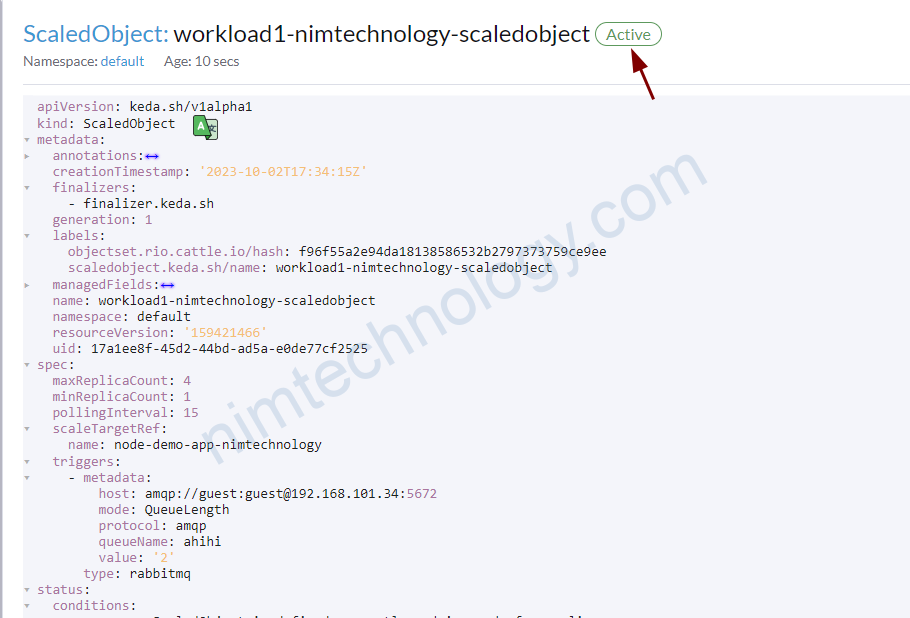
thi scaleObject đã work ok.
===> nếu keda get value = 0 thì nó sẽ hiện Scaling is not performed because triggers are not active
Unable to delete the scale object of Keda.

Lúc này bạn sẽ đúng ở đây mãi mãi và chỉ có thể nhấn clt + C để thoát ra ngoài.
#!/bin/bash

# Enable debugging
set -x

# Function to delete a specific ScaledObject
delete_scaledobject() {
    local namespace="$1"
    local name="$2"

    # Check if the resource exists
    if kubectl get scaledobject "$name" -n "$namespace" > /dev/null 2>&1; then
        # Print the patch command to remove finalizer and mark for deletion
        echo "Removing finalizer from resource: $name in namespace: $namespace"
        kubectl patch scaledobject "$name" -n "$namespace" -p '{"metadata":{"finalizers":null}}' --type=merge
    else
        echo "Resource $name not found in namespace $namespace."
    fi
}

# Function to delete all ScaledObjects
delete_all_scaledobjects() {
    kubectl get scaledobjects -A -o jsonpath='{range .items[*]}{.metadata.namespace}{" "}{.metadata.name}{"\n"}{end}' | while read -r line; do
        # Extract namespace and name
        namespace=$(echo "$line" | cut -d' ' -f1)
        name=$(echo "$line" | cut -d' ' -f2)

        # Call the delete function for each ScaledObject
        delete_scaledobject "$namespace" "$name"
    done
}

# Check if user wants to delete all or a specific resource
if [ "$1" == "all" ]; then
    # Delete all ScaledObjects
    echo "Removing finalizers for all ScaledObjects in the cluster..."
    delete_all_scaledobjects
elif [ -n "$1" ] && [ -n "$2" ]; then
    # Delete a specific ScaledObject
    echo "Removing finalizer for specific ScaledObject: $1 in namespace: $2"
    delete_scaledobject "$2" "$1"
else
    echo "Usage: $0 all                  # To remove finalizers from all ScaledObjects"
    echo "       $0 <name> <namespace>    # To remove finalizer from a specific ScaledObject"
    exit 1
fi
Để delete all scaleObject:
./script.sh allĐể detele 1 scaleObject cụ thể bằng name và namespace:
./script.sh <name> <namespace>Sau đây là đoạn nim chạy:
root@work-space-u20:~/mylab-scrpit# bash delete-scaleobject.sh normal-result-handler-scaledobject elearning
+ '[' normal-result-handler-scaledobject == all ']'
+ '[' -n normal-result-handler-scaledobject ']'
+ '[' -n elearning ']'
+ echo 'Removing finalizer for specific ScaledObject: normal-result-handler-scaledobject in namespace: elearning'
Removing finalizer for specific ScaledObject: normal-result-handler-scaledobject in namespace: elearning
+ delete_scaledobject elearning normal-result-handler-scaledobject
+ local namespace=elearning
+ local name=normal-result-handler-scaledobject
+ kubectl get scaledobject normal-result-handler-scaledobject -n elearning
+ echo 'Removing finalizer from resource: normal-result-handler-scaledobject in namespace: elearning'
Removing finalizer from resource: normal-result-handler-scaledobject in namespace: elearning
+ kubectl patch scaledobject normal-result-handler-scaledobject -n elearning -p '{"metadata":{"finalizers":null}}' --type=merge
Error from server (NotFound): admission webhook "vscaledobject.kb.io" denied the request: Deployment.apps "normal-result-handler" not found
Bạn có thể thấy nó xuất hiện lỗi:
Error from server (NotFound): admission webhook “vscaledobject.kb.io” denied the request: Deployment.apps “normal-result-handler” not found
Giờ bạn cần tạo 1 deployment với tên normal-result-handler và có request ram/cpu
rồi run lại câu lệnh này là ok
apiVersion: apps/v1
kind: Deployment
metadata:
  name: normal-result-handler
spec:
  replicas: 1
  selector:
    matchLabels:
      app: normal-result-handler
  template:
    metadata:
      labels:
        app: normal-result-handler
    spec:
      containers:
        - name: normal-result-handler
          image: nginx:latest
          resources:
            requests:
              memory: "111Mi"
              cpu: "111m"
và chạy lại câu lệnh log như này là ok:
root@work-space-u20:~/mylab-scrpit# bash delete-scaleobject.sh normal-result-handler-scaledobject elearning
+ '[' normal-result-handler-scaledobject == all ']'
+ '[' -n normal-result-handler-scaledobject ']'
+ '[' -n elearning ']'
+ echo 'Removing finalizer for specific ScaledObject: normal-result-handler-scaledobject in namespace: elearning'
Removing finalizer for specific ScaledObject: normal-result-handler-scaledobject in namespace: elearning
+ delete_scaledobject elearning normal-result-handler-scaledobject
+ local namespace=elearning
+ local name=normal-result-handler-scaledobject
+ kubectl get scaledobject normal-result-handler-scaledobject -n elearning
+ echo 'Removing finalizer from resource: normal-result-handler-scaledobject in namespace: elearning'
Removing finalizer from resource: normal-result-handler-scaledobject in namespace: elearning
+ kubectl patch scaledobject normal-result-handler-scaledobject -n elearning -p '{"metadata":{"finalizers":null}}' --type=merge
scaledobject.keda.sh/normal-result-handler-scaledobject patched
How to scale a pod down to zero when using KEDA.
Nếu bạn đã sử dụng keda và muốn scale các pod xuông không cho mục đích testing hay mục đích gì đó và gặp lỗi.
message: "An error occurred: Failed to update ScaleObject: {\"type\":\"error\",\"links\":{},\"code\":\"Forbidden\",\"message\":\"admission webhook \\\"vscaledobject.kb.io\\\" denied the request: scaledobject has only cpu/memory triggers AND minReplica is 0 (scale to zero doesn't work in this case)\",\"status\":403,\"type\":\"error\"}\nPhân tích 1 chút là ScaleObject này chỉ đang monitor RAM và CPU của con pod.
Nên nó sẽ không cho phép scale pod xuống không được.
Vì không pod thì làm gì còn CPU, RAM mà based trên đó.
Có 2 cách để scale được pod xuống không!
Dùng annotation apply vào scaleObject:
apiVersion: keda.sh/v1alpha1
kind: ScaledObject
metadata:
  name: my-app
  namespace: default
  annotations:
    autoscaling.keda.sh/paused-replicas: "0"   # ⬅ scale to 0 and pause
spec:
  scaleTargetRef:
    name: my-app
  # …rest of your KEDA spec…
Cách tiếp theo thì có thể là hơi cheat.
Bạn có thể add thêm trigger thứ 3 nhưng mà không ảnh hưởng đến behavior
spec:
  minReplicaCount: 0
  triggers:
    - type: cpu
      metricType: Utilization
      metadata:
        value: "70"
    - type: cron
      metadata:
        start: "0 8 * * *"   # 08:00
        end:   "0 18 * * *"   # 18:00
        timezone: "Asia/Ho_Chi_Minh"
        desiredReplicas: "1"
Bạn có thể điều chỉnh giờ của cron sao cho không ảnh hưởng đến Business.