Nếu công ty của bạn giàu và yêu cầu bạn phải sử dụng datadog thì Let’s do it.
1) Install DataDog on Kubernetes.
Install DataDog via helm.
helm repo add datadog https://helm.datadoghq.com
helm repo update
Value file:
datadog:
  site: datadoghq.com
  apiKey: 5d6c38e260bea6229c2916fc7eaXXXXX
  logs:
    enabled: true
    containerCollectAll: true
Vì để datadog chất nhận data của bạn gửi lên datadog.
thì apiKey là thử quan trong nhất.

Và các bạn có thể tham khảo full value của nó ở đây.
https://github.com/DataDog/helm-charts/blob/main/charts/datadog/values.yaml
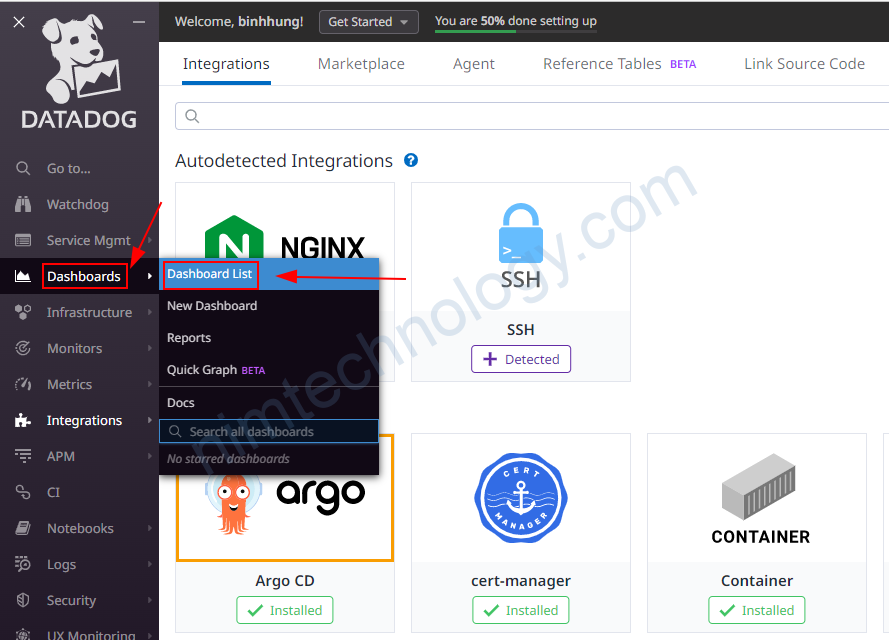
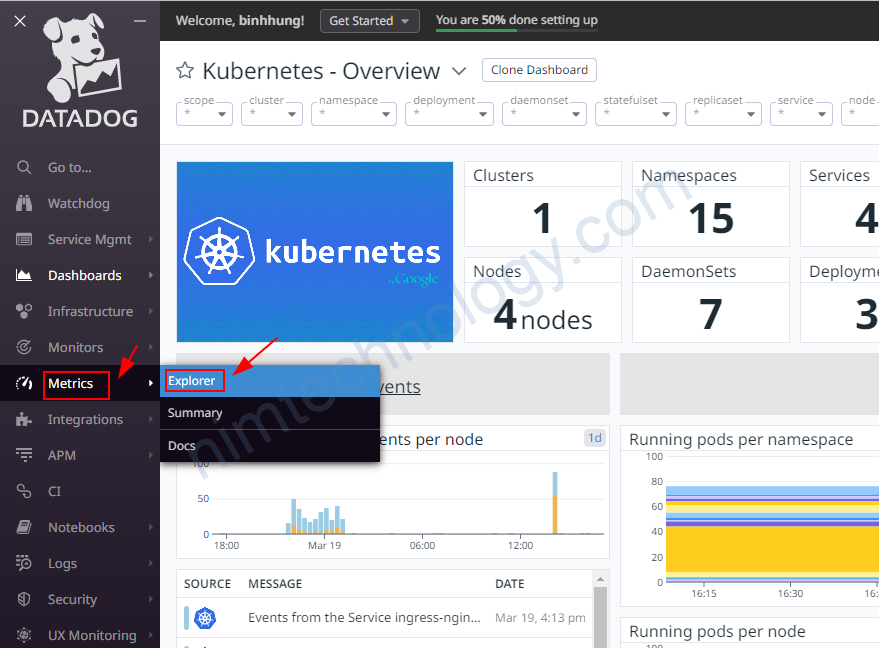
2) How will Datadog monitor your cluster or service?
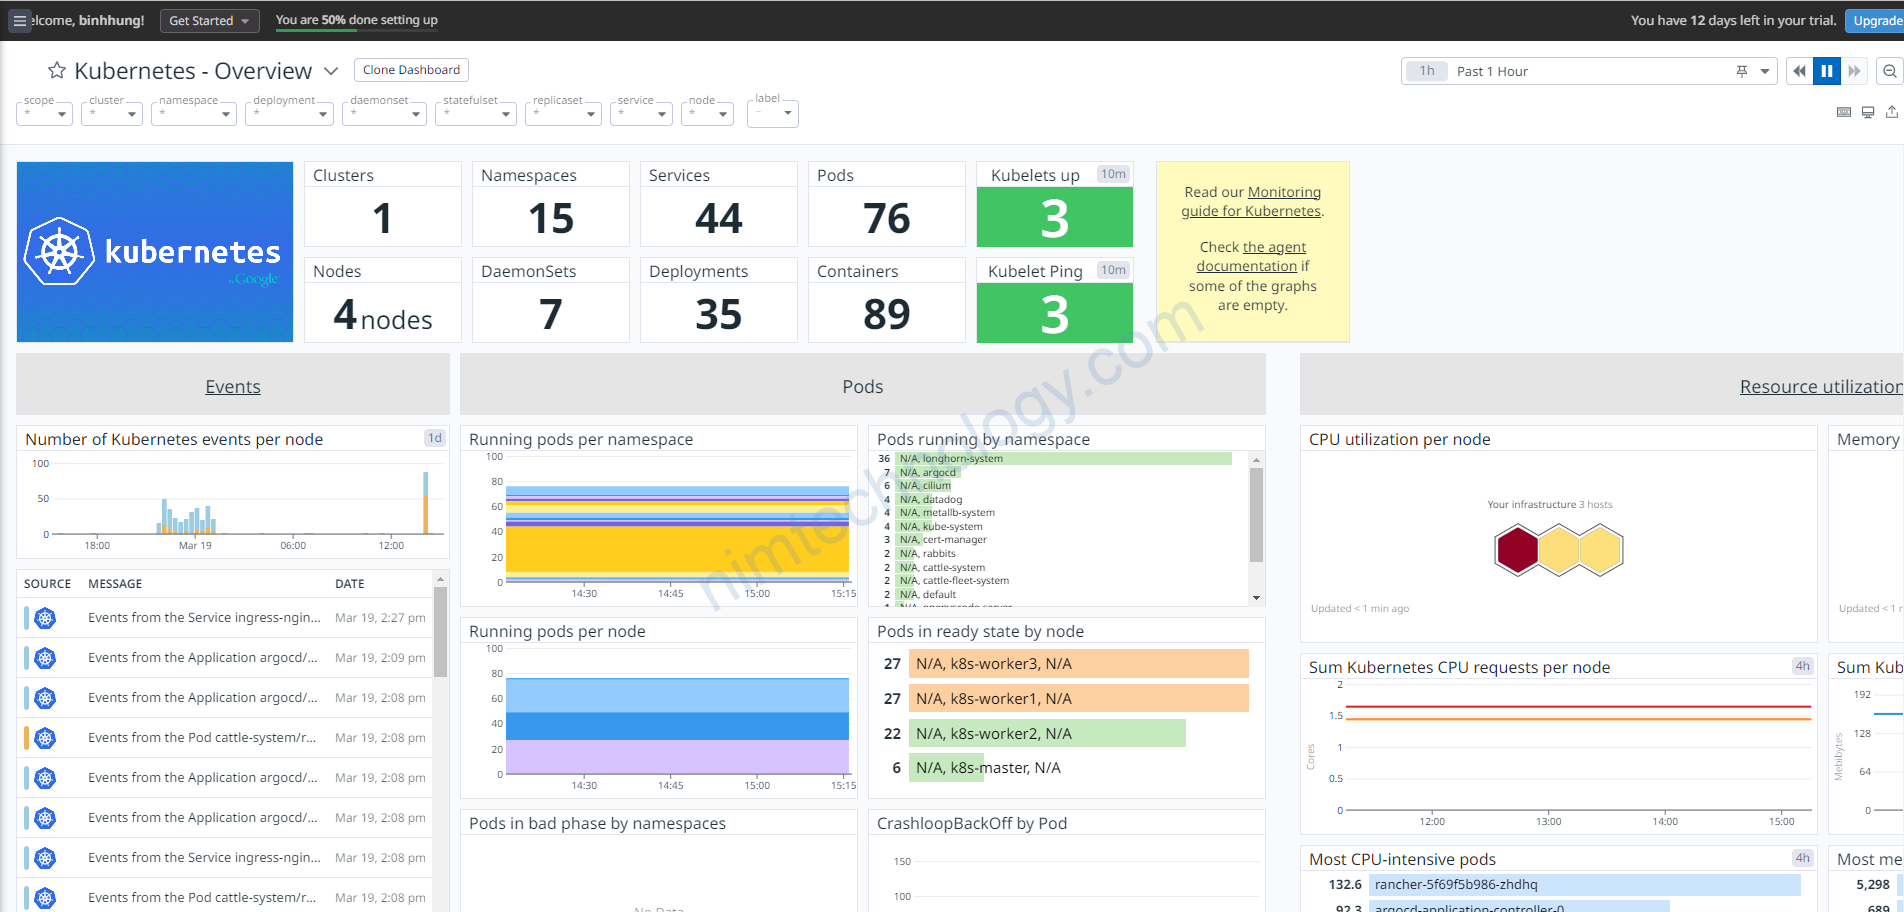
Sau khi bạn cài đặt datadog trên cluster k8s của bạn, bạn sẽ thấy chúng tự động collect metrics và data trong cluster của bạn tự động nhất 1 các có thể.

Sau khi cài đặt mình bặt đầu rút ra thứ hấp dẫn của Datadog.
2.1) Collect data based on packages that are designed by DataDog.
Theo mình nghĩ do chúng ta trả tiền cho datadog. Thì chúng ta sẽ không cần lo lắng về store metrics ở đâu.
Còn 1 cái hay nữa là bạn sẽ được cung cấp dashboard mà nó được vẽ bởi datadog.
Bạn có thể vào repo: https://github.com/DataDog/integrations-core
2.1.1) Monitor RabbitMQ by DataDog on Kubernetes.
Yeah, Datadog có hỗ trợ
https://github.com/DataDog/integrations-core/tree/master/rabbitmq
Enable monitoring on RabbitMQ.
RabbitMQ exposes metrics in two ways: the RabbitMQ Management Plugin and the Rabbitmq Prometheus Plugin.
Bạn sẽ cần thêm 2 plugins sau: rabbitmq_management, rabbitmq_prometheus
port manager: 5672 or 15672
port metrics: 15692
Thường thì prometheus sẽ collect ở 15692
Và bạn sửa file values như dưới.
datadog:
  logs:
    enabled: true
    containerCollectAll: true
  confd:
    rabbitmq.yaml: |-
      instances:
        - rabbitmq_api_url: http://<rabbit_service_name>.<namespace>:5672/api/
          rabbitmq_user: "<YOUR_RABBITMQ_USERNAME>"
          rabbitmq_pass: "<YOUR_RABBITMQ_PASSWORD>"
lúc này bạn sẽ cần exec vào pod
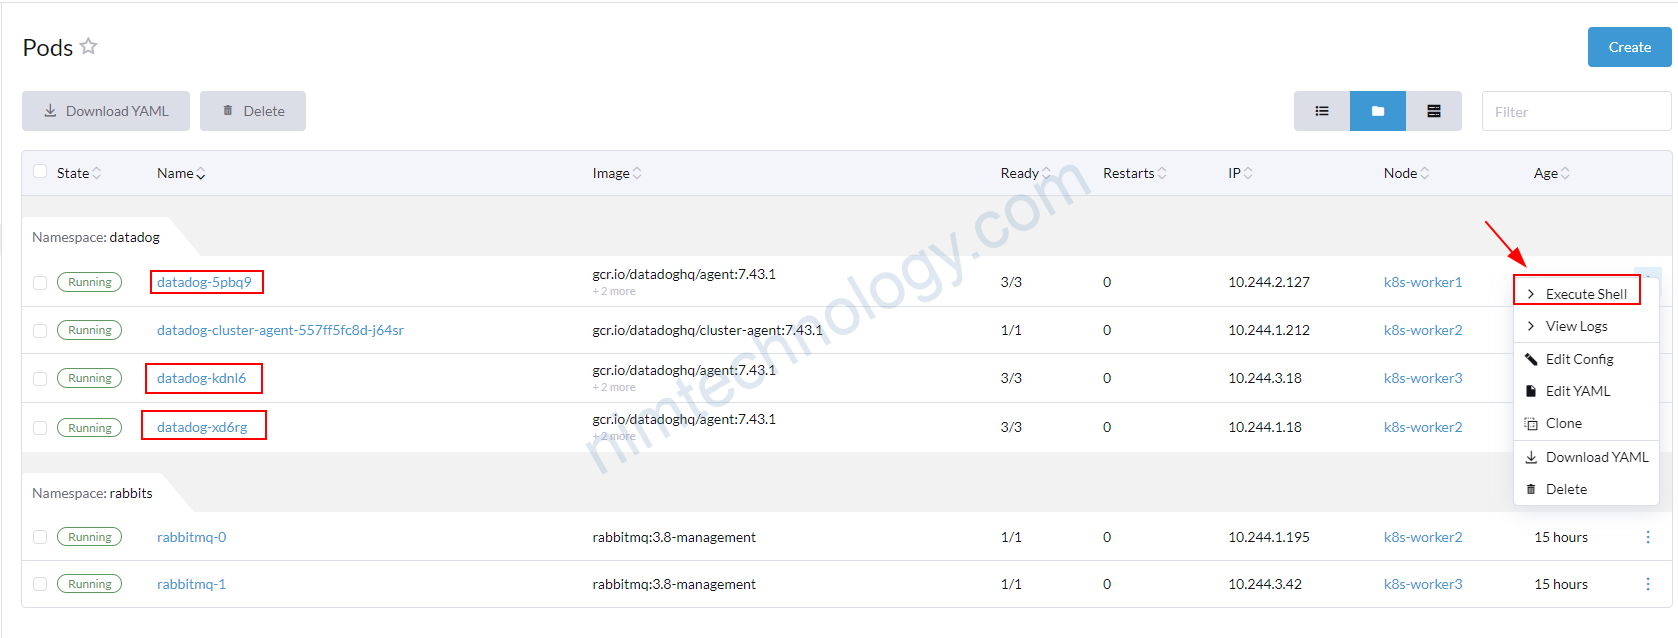
apt update -y && apt install vim -y
agent status >> debug.txt

vim debug.txt
Và nếu bạn thấy rabbit như bên dưới thì ok
    rabbitmq (3.4.0)
    ----------------
      Instance ID: rabbitmq:15b01df4a0b63830 [OK]
      Configuration Source: file:/etc/datadog-agent/conf.d/rabbitmq.yaml
      Total Runs: 3,502
      Metric Samples: Last Run: 1,328, Total: 4,650,650
      Events: Last Run: 0, Total: 0
      Service Checks: Last Run: 1, Total: 3,502
      Average Execution Time : 134ms
      Last Execution Date : 2023-03-19 08:45:08 UTC (1679215508000)
      Last Successful Execution Date : 2023-03-19 08:45:08 UTC (1679215508000)
Datadog cũng có thể collect metrics như prometheus.
datadog:
  logs:
    enabled: true
    containerCollectAll: true
  confd:
    rabbitmq.yaml: |-
      instances:
        - prometheus_plugin:
            url: "http://rabbitmq.rabbits:15692"
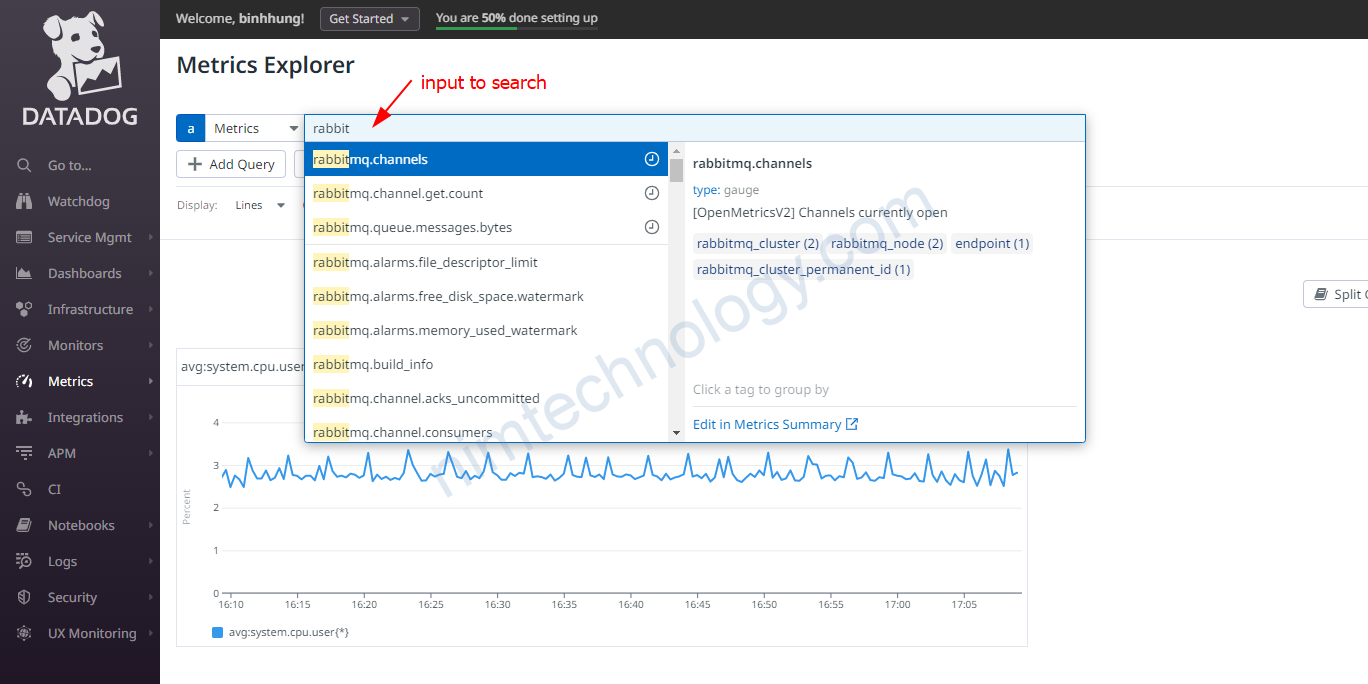
Lúc này bạn quay lại dataDog để query.
2.2) Kubernetes Integrations Autodiscovery
Mình đã sử dụng prometheus và mình rất thích tính năng Auto Discovery.
Nhưng tin bùn là tính năng này bị remove trên rất nhiều package của Datadog.
https://github.com/DataDog/integrations-core/pull/13919
Nếu bạn muốn monitor cái gì thì bạn phải nói với ông controll Datadog nhé.
2.3) Install the Datadog window to monitor K8s windows and Windows Pods
Có 1 cái hơi chướng là bên mình có chạy windows pod trên k8s.
Nêu bạn chưa biết dựng k8s windows như thế nào thì tham khảo bài sau:
Đây là doc của datadog hướng dẫn cài agent trên windows k8s
https://docs.datadoghq.com/agent/troubleshooting/windows_containers/
Mình có get được valuefile ở đây.
https://github.com/DataDog/helm-charts/issues/955
Về nguyên tắc thì bạn sẽ cài 1 full datadog on linux k8s.
Tiếp đến là bạn cài agent datadog windows và join datadog windows vào datadog linux.
targetSystem: windows
existingClusterAgent:
  join: true
  serviceName: "datadog-cluster-agent" # from the first Datadog Helm chart
  tokenSecretName: "<EXISTING_DCA_SECRET_NAME>" # from the first Datadog Helm chart


# Disable datadogMetrics deployment since it should have been already deployed with the first chart.
datadog-crds:
  crds:
    datadogMetrics: false

# Disable kube-state-metrics deployment
datadog:
  kubeStateMetricsEnabled: false
  apiKey: "ahihi"
  clusterName: "ahihi"
  dogstatsd:
    useHostPort: true

clusterAgent:
  image:
    doNotCheckTag: true

agents:
  image:
    doNotCheckTag: true
  priorityClassName: system-node-critical
  tolerations:
  - effect: NoSchedule
    key: os
    operator: Equal
    value: windows
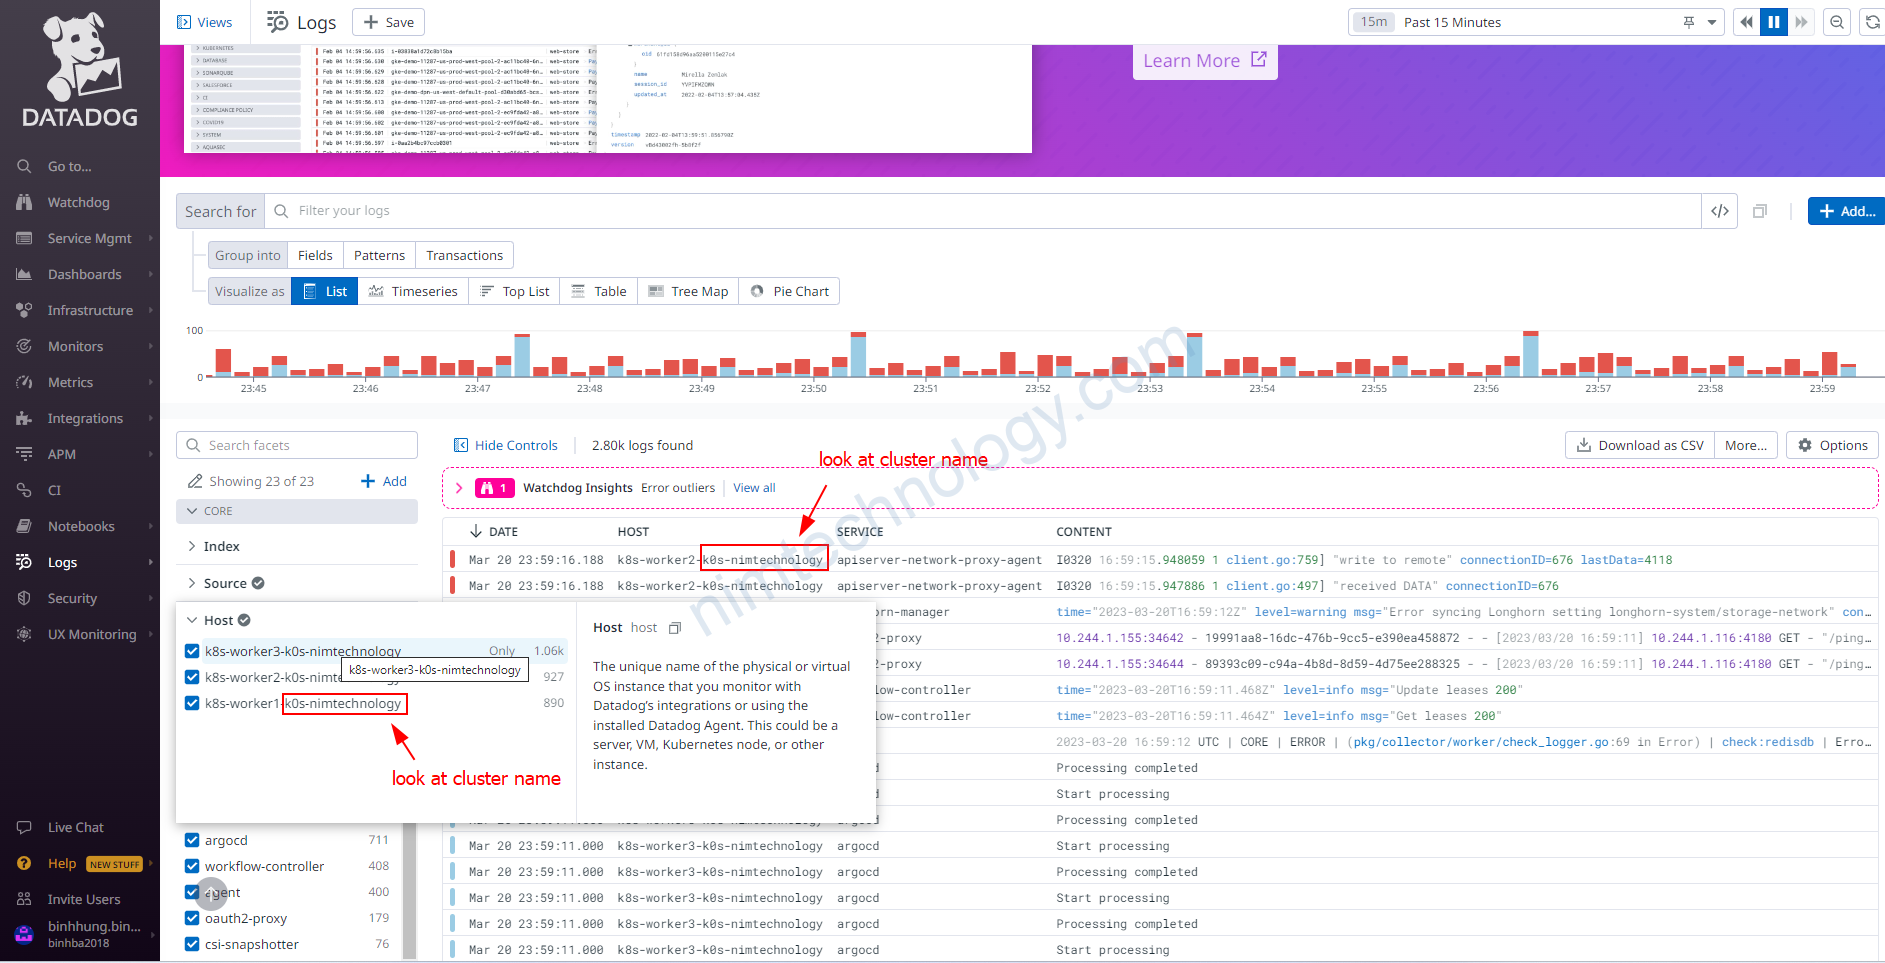
3) Signed to isolate the logs or metrics about each Cluster or Environment
Chúng ta có rất nhiều clusters và rất nhiều dịch vụ gửi metrics hoặc log về Datadog
và đôi khi các dịch vụ đó trùng tên nhau
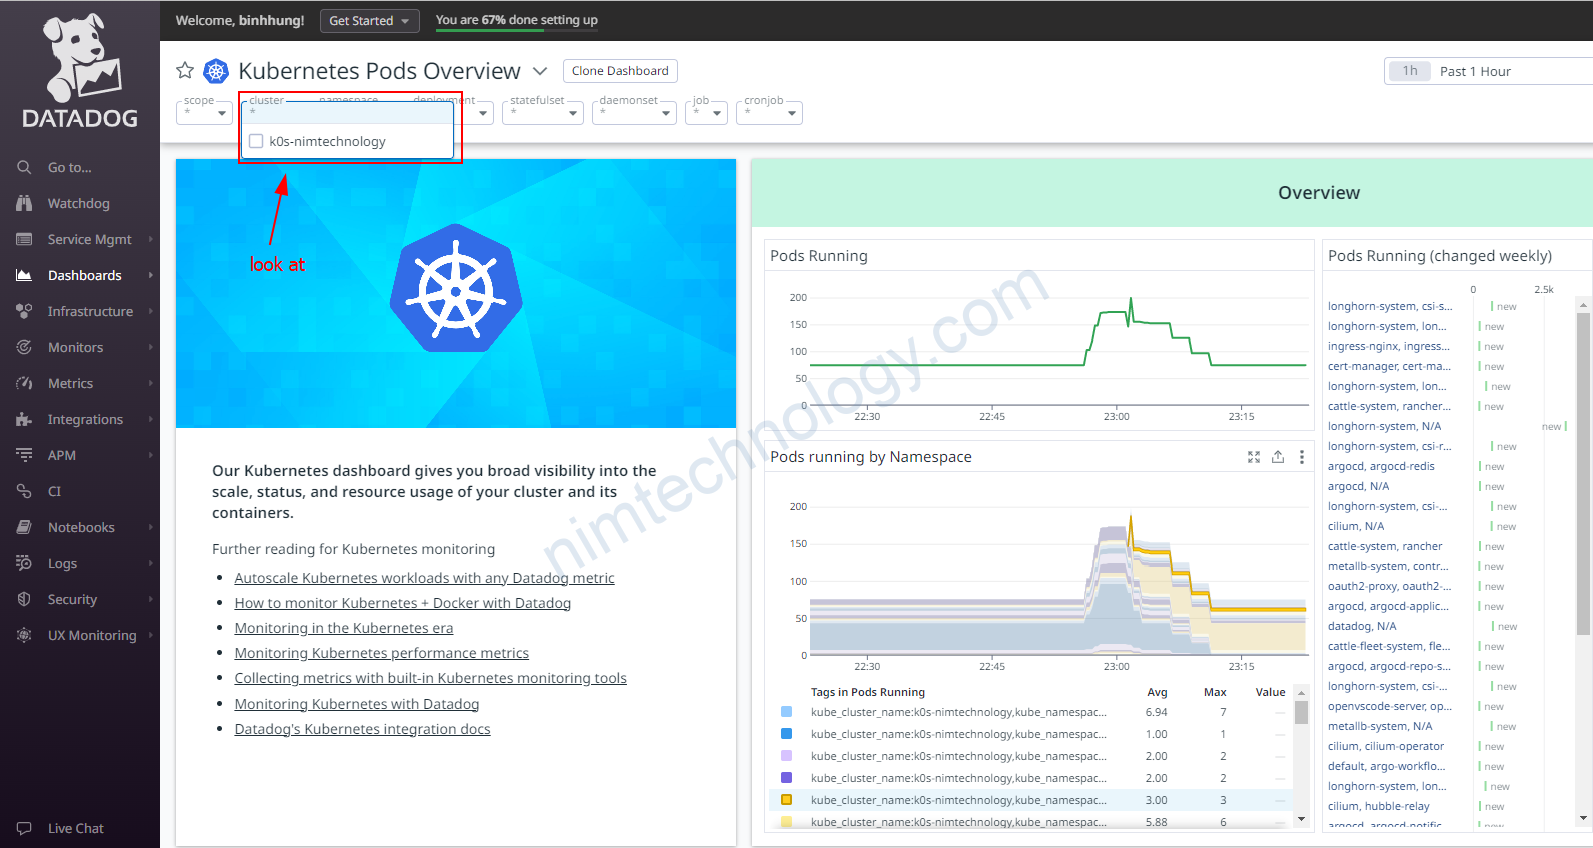
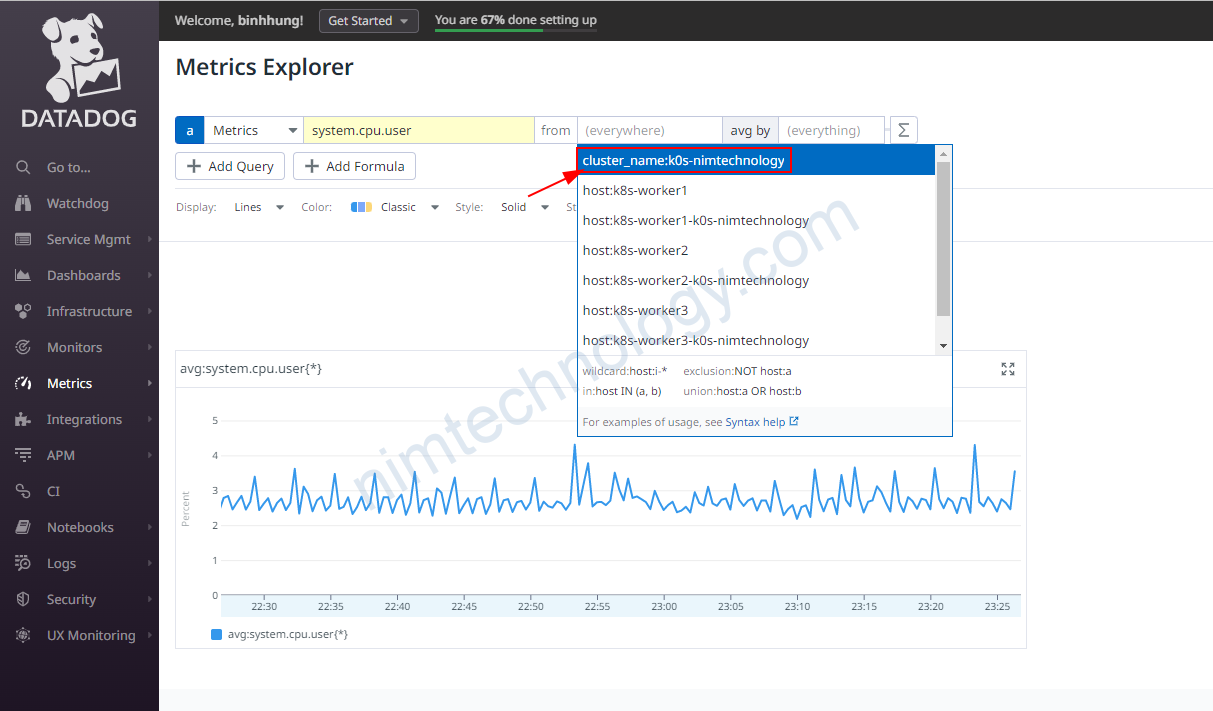
Vd: như là trên các cluster khách nhau thì bạn đều cài ingress-nginx vậy làm sao để biêt ingress này trên cluster nào.
với Kubernetes thì bạn chỉ cần ghi tên cluster trong values:
datadog:
  ...
  clusterName: k0s-nimtechnology
  ...
....
4) Collect all logs/stdout of pods on Datadog
4.1) Collect all logs of all pods in Kubernetes Cluster.
datadog:
  logs:
    enabled: true
    containerCollectAll: true
4.2) Collect the logs of the specific pods
Vì viêc collect logs của tất cả các pods trong k8s sẽ gây ra 1 vấn đề là chúng ta sẽ tốn rât nhiều tiền.
ở đây chúng ta sẽ dụng feature Autodiscovery trong việc collect logs.
chỉ collect log của một số deployment, StatefulSets, …
Đầu tiên chỉnh values helm
datadog:
  logs:
    enabled: true
Tiếp theo bạn sẽ cần add annotation vào deployment.
apiVersion: apps/v1
kind: Deployment
metadata:
  name: nginx-deployment
  labels:
    app: nginx
spec:
  replicas: 3
  selector:
    matchLabels:
      app: nginx
  template:
    metadata:
      labels:
        app: nginx
      annotations:
        ad.datadoghq.com/<CONTAINER_NAME>.logs: '[{"source": "<SOURCE_NAME>", "service": "<SERVICE_NAME>"}]'
    spec:
      containers:
      - name: <CONTAINER_NAME>
        image: nginx:1.21.1
        ports:
        - containerPort: 80
Bạn cần để ý là trong deployment sẽ có nhiều containers.
Bạn cần lấy logs của container nào thì khái name của container đó.
ví dụ.
apiVersion: apps/v1
kind: Deployment
metadata:
  name: nginx-deployment
  labels:
    app: nginx
spec:
  replicas: 3
  selector:
    matchLabels:
      app: nginx
  template:
    metadata:
      labels:
        app: nginx
      annotations:
        ad.datadoghq.com/nginx.logs: '[{"source": "nginx", "service": "nginx-service"}]'
    spec:
      containers:
      - name: nginx
        image: nginx:1.21.1
        ports:
        - containerPort: 80
In this example, we have a simple Nginx deployment with three replicas. We’ve added the ad.datadoghq.com/nginx.logs annotation under the metadata section of the template. This annotation tells Datadog to collect logs from the “nginx” container with the “nginx” source and associate them with the “nginx-service” service.
You can customize this example by changing the container image, container name, source, and service values according to your needs.
Bạn cũng có thể collect logs của nhiều container trong 1 pod
apiVersion: v1
kind: Pod
# (...)
metadata:
  name: '<POD_NAME>'
  annotations:
    ad.datadoghq.com/<CONTAINER_IDENTIFIER_1>.logs: '[<LOG_CONFIG_1>]'
    # (...)
    ad.datadoghq.com/<CONTAINER_IDENTIFIER_2>.logs: '[<LOG_CONFIG_2>]'
spec:
  containers:
    - name: '<CONTAINER_IDENTIFIER_1>'
    # (...)
    - name: '<CONTAINER_IDENTIFIER_2>'
# (...)