1) the preparing before install Prometheus Operator
Đầu tiên thì bạn cần cài đặt trước các CustomResourceDefinition
REPO URL: https://prometheus-community.github.io/helm-charts
CHART: prometheus-operator-crds:2.0.0
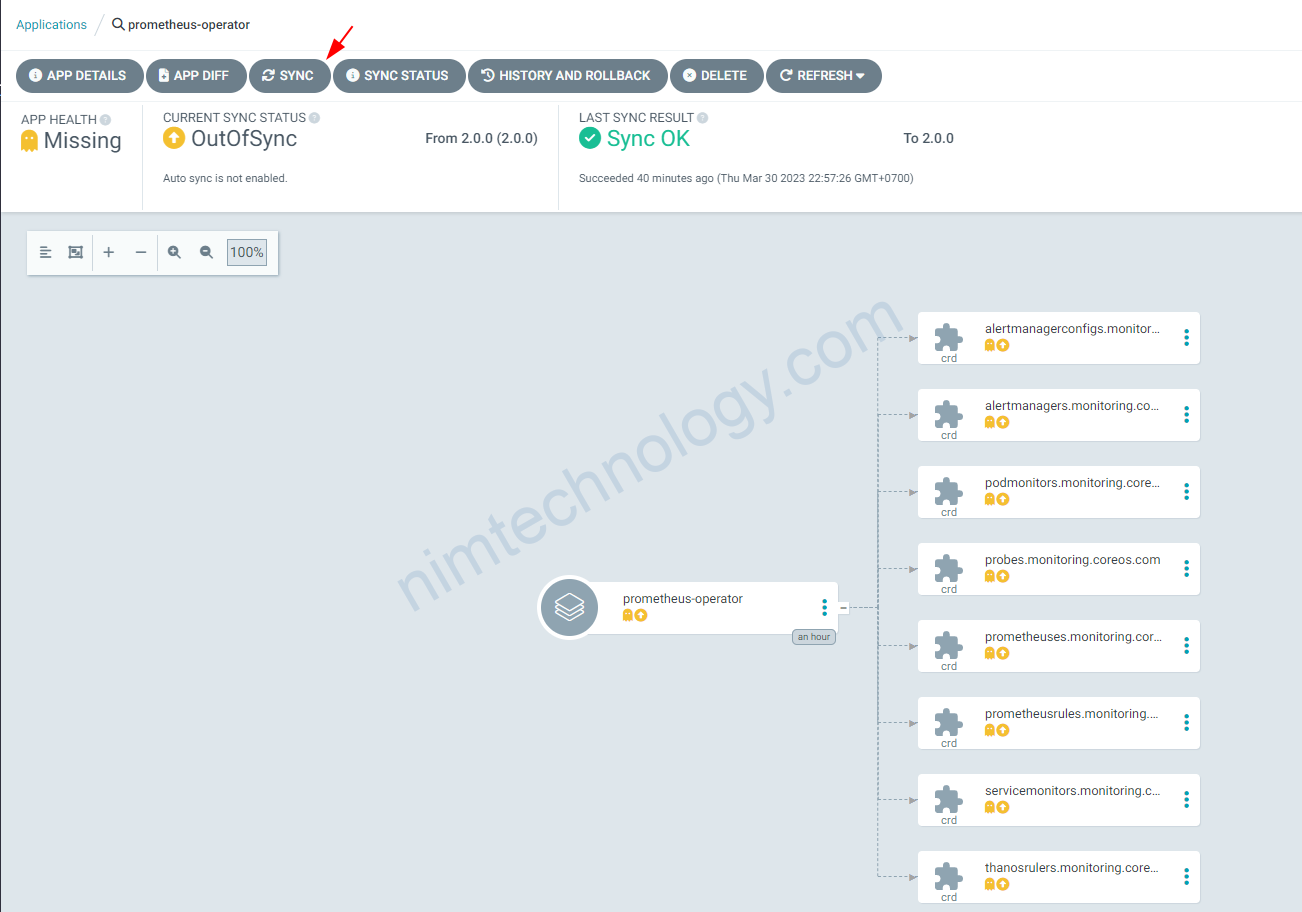
We need to press the sync button
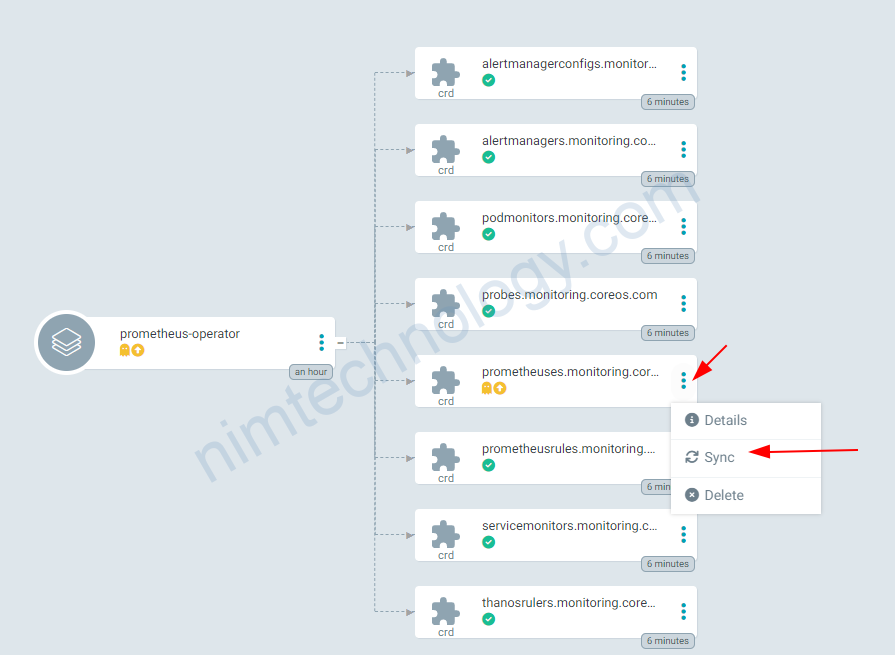
I am sure that you also have a problem with prometheuses.monitoring.coreos.com
This message: “CustomResourceDefinition.apiextensions.k8s.io “prometheuses.monitoring.coreos.com” is invalid: metadata.annotations: Too long: must have at most 262144 bytes“
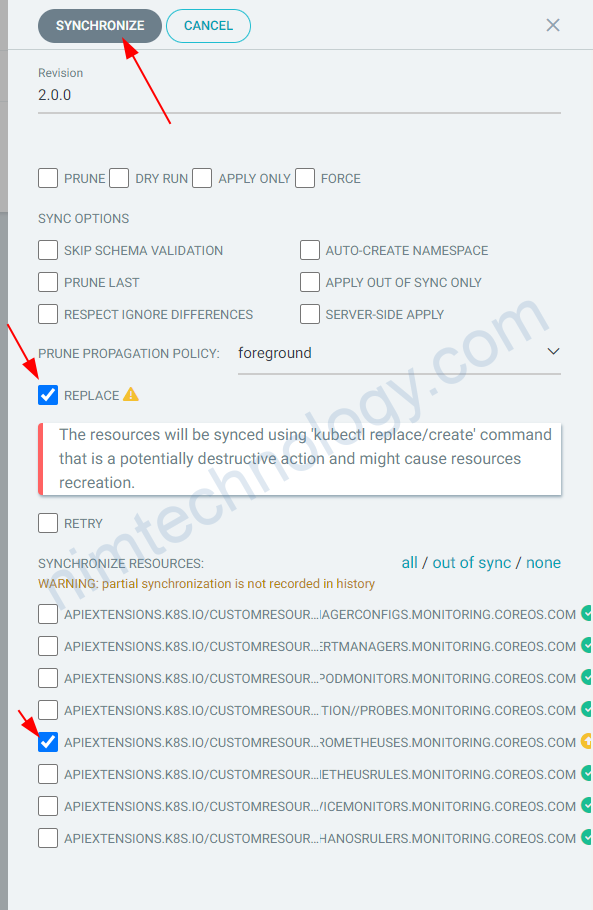
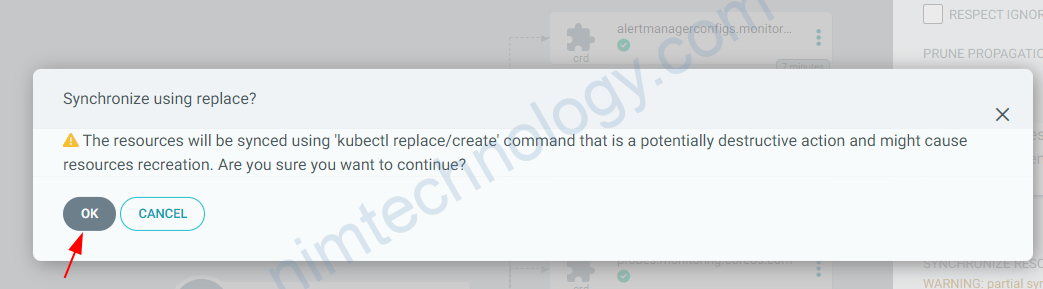
Don’t be worried. you only sync again with replace way.
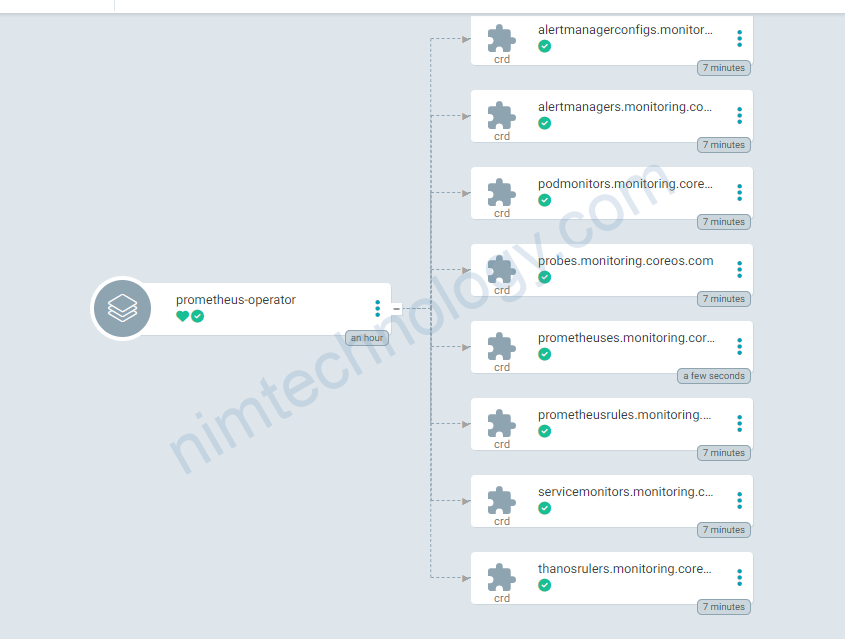
và tất cả các CustomResourceDefinition đã được apply và green color!
2) Install Prometheus Operator
Hiện giờ họ sẽ không provide chart Prometheus Operator và chúng ta phải sử dụng chart.
kube-prometheus-stack.
Nếu Alertmanager không thể start thì có thể là do bạn chưa xóa sạch component nào đó có liên quan để prometheus on other namespace.
Error (ts=2023-03-31T16:29:11.263Z caller=main.go:240 level=info msg="Starting Alertmanager" version="(version=0.25.0, branch=HEAD, revision=258fab7cdd551f2cf251ed0348f0ad7289aee789)" ts=2023-03-31T16:29:11.263Z caller=main.go:241 level=info build_context="(go=go1.19.4, user=root@abe866dd5717, date=20221222-14:51:36)" ts=2023-03-31T16:29:11.313Z caller=coordinator.go:113 level=info component=configuration msg="Loading configuration file" file=/etc/alertmanager/config_out/alertmanager.env.yaml ts=2023-03-31T16:29:11.313Z caller=coordinator.go:118 level=error component=configuration msg="Loading configuration file failed" file=/etc/alertmanager/config_out/alertmanager.env.yaml err="open /etc/alertmanager/config_out/alertmanager.env.yaml: no such file or directory" )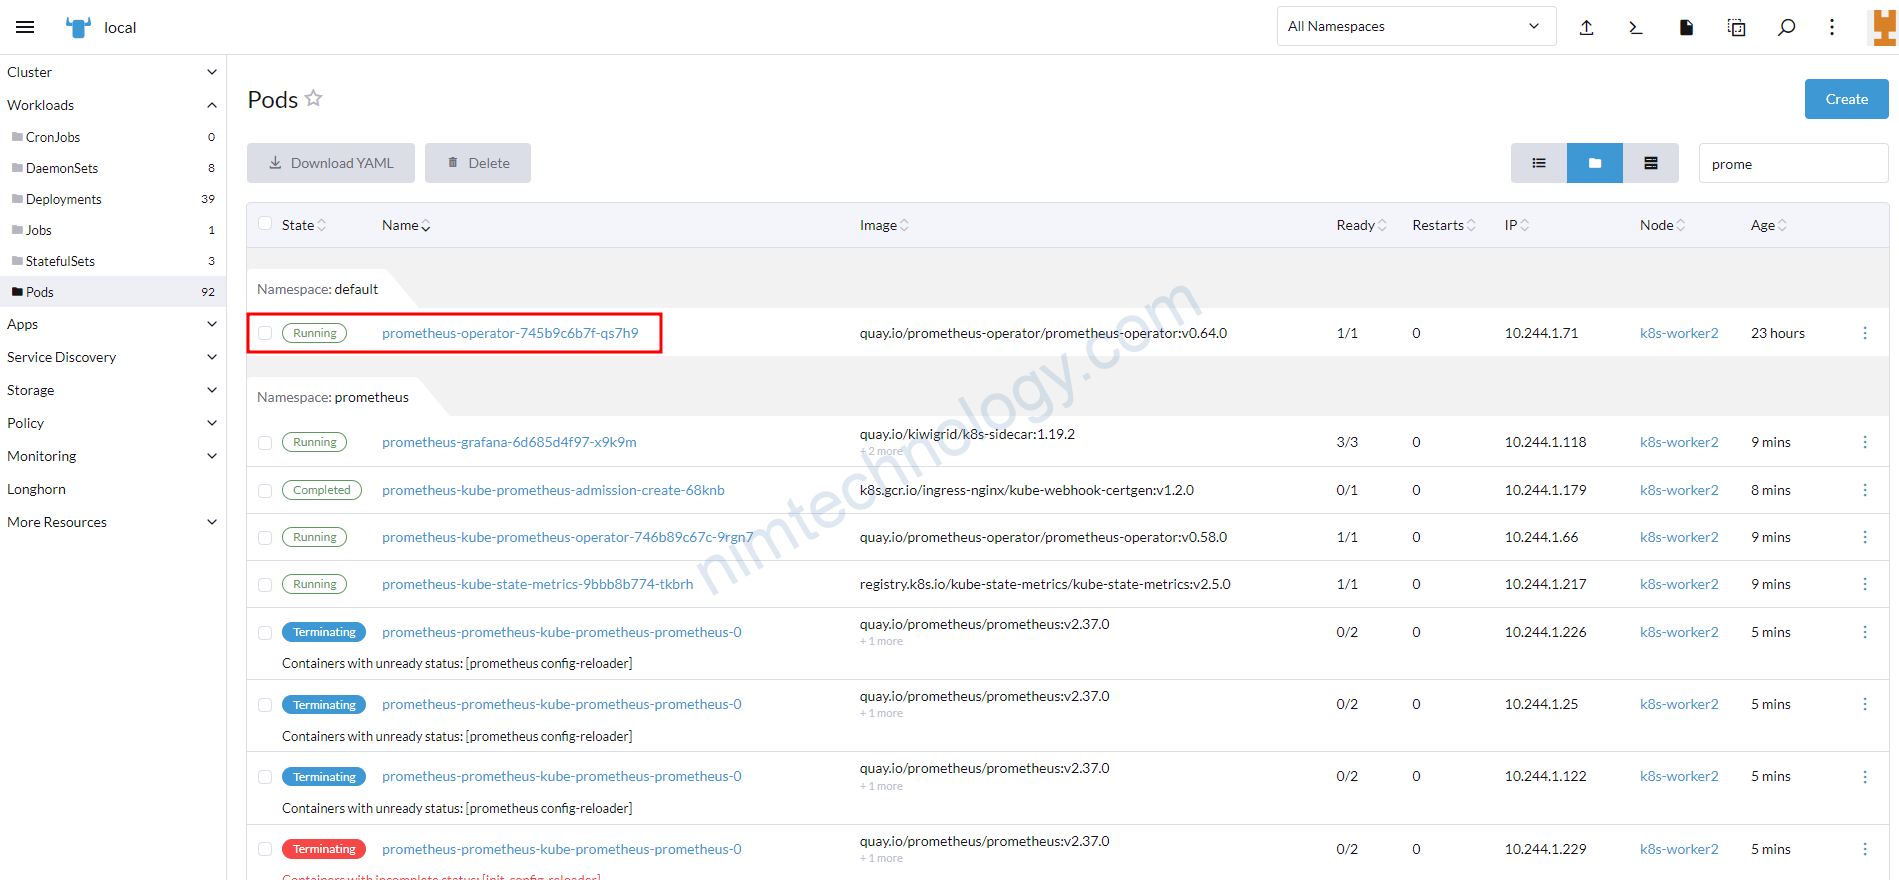
MountVolume.SetUp failed for volume “tls-secret” : secret “prometheus-kube-prometheus-admission” not found
https://github.com/prometheus-community/helm-charts/issues/1438
prometheusOperator:
  enabled: true
  admissionWebhooks:
    enabled: false
    certManager:
      enabled: true
Nếu bạn sử dụng mix giữa node windows và linux trong k8s thì có thể sử dụng value sau:
prometheus:
  prometheusSpec:
    nodeSelector:
      kubernetes.io/os: linux
alertmanager:
  alertmanagerSpec:
    nodeSelector:
      kubernetes.io/os: linux
prometheusOperator:
  nodeSelector:
    kubernetes.io/os: linux
  enabled: true
  admissionWebhooks:
    patch:
      nodeSelector:
        kubernetes.io/os: linux
    enabled: false
    certManager:
      enabled: true
thanosRuler:
  thanosRulerSpec:
    nodeSelector:
      kubernetes.io/os: linux
Nhưng mà bạn vẫn sẽ phải thêm nodeSelector nếu helm chart không đủ configuration.
nodeSelector:
  kubernetes.io/os: linux
3) Only Install Prometheus(single) for the special purposes.
Ở phần này mình chỉ muốn cài mình prometheus cho những mục đích đặt biệt.
Sau đây là file application of argocd.
apiVersion: argoproj.io/v1alpha1
kind: Application
metadata:
  name: prometheus-nimtechnology-staging
  namespace: argocd
spec:
  destination:
    namespace: coralogix
    name: 'arn:aws:eks:us-west-2:XXXXXXXXX:cluster/staging-nimtechnology-engines'
  project: meta-structure
  source:
    repoURL: https://prometheus-community.github.io/helm-charts
    targetRevision: "23.2.0"
    chart: prometheus
    helm:
      values: |
        prometheus-node-exporter:
          enabled: false
        prometheus-pushgateway:
          enabled: false
        server:
          global:
            external_labels:
              cluster_name: staging-nimtechnology-engines
          retention: "1d"
          remoteWrite:
            - url: https://ingress.coralogix.us/prometheus/v1
              name: 'staging-nimtechnology-engines'
              remote_timeout: 120s
              bearer_token: 'cxtp_XXXXXXXXXXXXXXXXXXX'
external_labels: is a configuration in Prometheus used to provide labels that are unique to the Prometheus instance. These labels are added to every time series that is collected by this Prometheus instance, as well as to alerts sent by the Alertmanager.
==> Mục đích là mình muốn nhận biết metrics này là của con prometheus nào
remoteWrite is a feature in Prometheus that allows you to send the time series data that Prometheus collects to a remote endpoint. This can be used to integrate Prometheus with other monitoring systems or to send data to a long-term storage solution.
url: The endpoint to which the data is written.name: An optional identifier for the remote write target.remote_timeout: The timeout for each write request to the remote endpoint.bearer_token: A token used for authentication with the remote endpoint.
Everything OK
Secure “bearer_token” in remoteWrite
Nếu bạn sài template thì không thể push token lên github được
Vậy chúng ta sẽ sài: bearer_token_file
Bạn sẽ tạo 1 file secret:
apiVersion: v1
data:
  bearer-token-coralogix.txt: Y3h0cF9oVHU1RDBFdXRuXXXXXXXjU3SVBnMnU=
kind: Secret
metadata:
  name: prom-secret-files
  namespace: coralogix
rồi bạn sài extraSecretMounts
apiVersion: argoproj.io/v1alpha1
kind: Application
metadata:
  name: prometheus-nimtechnology-staging
  namespace: argocd
spec:
  destination:
    namespace: coralogix
    name: 'arn:aws:eks:us-west-2:XXXXXXXXX:cluster/staging-nimtechnology-engines'
  project: meta-structure
  source:
    repoURL: https://prometheus-community.github.io/helm-charts
    targetRevision: "23.2.0"
    chart: prometheus
    helm:
      values: |
        prometheus-node-exporter:
          enabled: false
        prometheus-pushgateway:
          enabled: false
        server:
          global:
            external_labels:
              cluster_name: staging-nimtechnology-engines
          retention: "1d"
          remoteWrite:
            - url: https://ingress.coralogix.us/prometheus/v1
              name: 'staging-nimtechnology-engines'
              remote_timeout: 120s
              bearer_token_file: /etc/secrets/bearer-token-coralogix.txt
          extraSecretMounts:
            - name: bearer-token-coralogix
              mountPath: /etc/secrets
              subPath: ""
              secretName: prom-secret-files
              readOnly: true
Add extra Scape configs
Nếu bạn add thên scrape_configs thì bạn thêm server.serverextraScrapeConfigs
apiVersion: argoproj.io/v1alpha1
kind: Application
metadata:
  name: prometheus-nimtechnology-staging
  namespace: argocd
spec:
  destination:
    namespace: coralogix
    name: 'arn:aws:eks:us-west-2:XXXXXXXXX:cluster/staging-nimtechnology-engines'
  project: meta-structure
  source:
    repoURL: https://prometheus-community.github.io/helm-charts
    targetRevision: "24.0.0"
    chart: prometheus
    helm:
      values: |
        prometheus-node-exporter:
          enabled: false
        prometheus-pushgateway:
          enabled: false
        server:
        ##...
        # adds additional scrape configs to prometheus.yml
        # must be a string so you have to add a | after extraScrapeConfigs:
        extraScrapeConfigs: |
          - job_name: jmx-msk
            scrape_interval: 30s
            static_configs:
            - targets:
              - b-2.c1.kafka.us-west-2.amazonaws.com:11001