Một ngày dẹp trời thì bạn được sếp quang cho 1 metrics và kêu vẽ chart trên grafana.
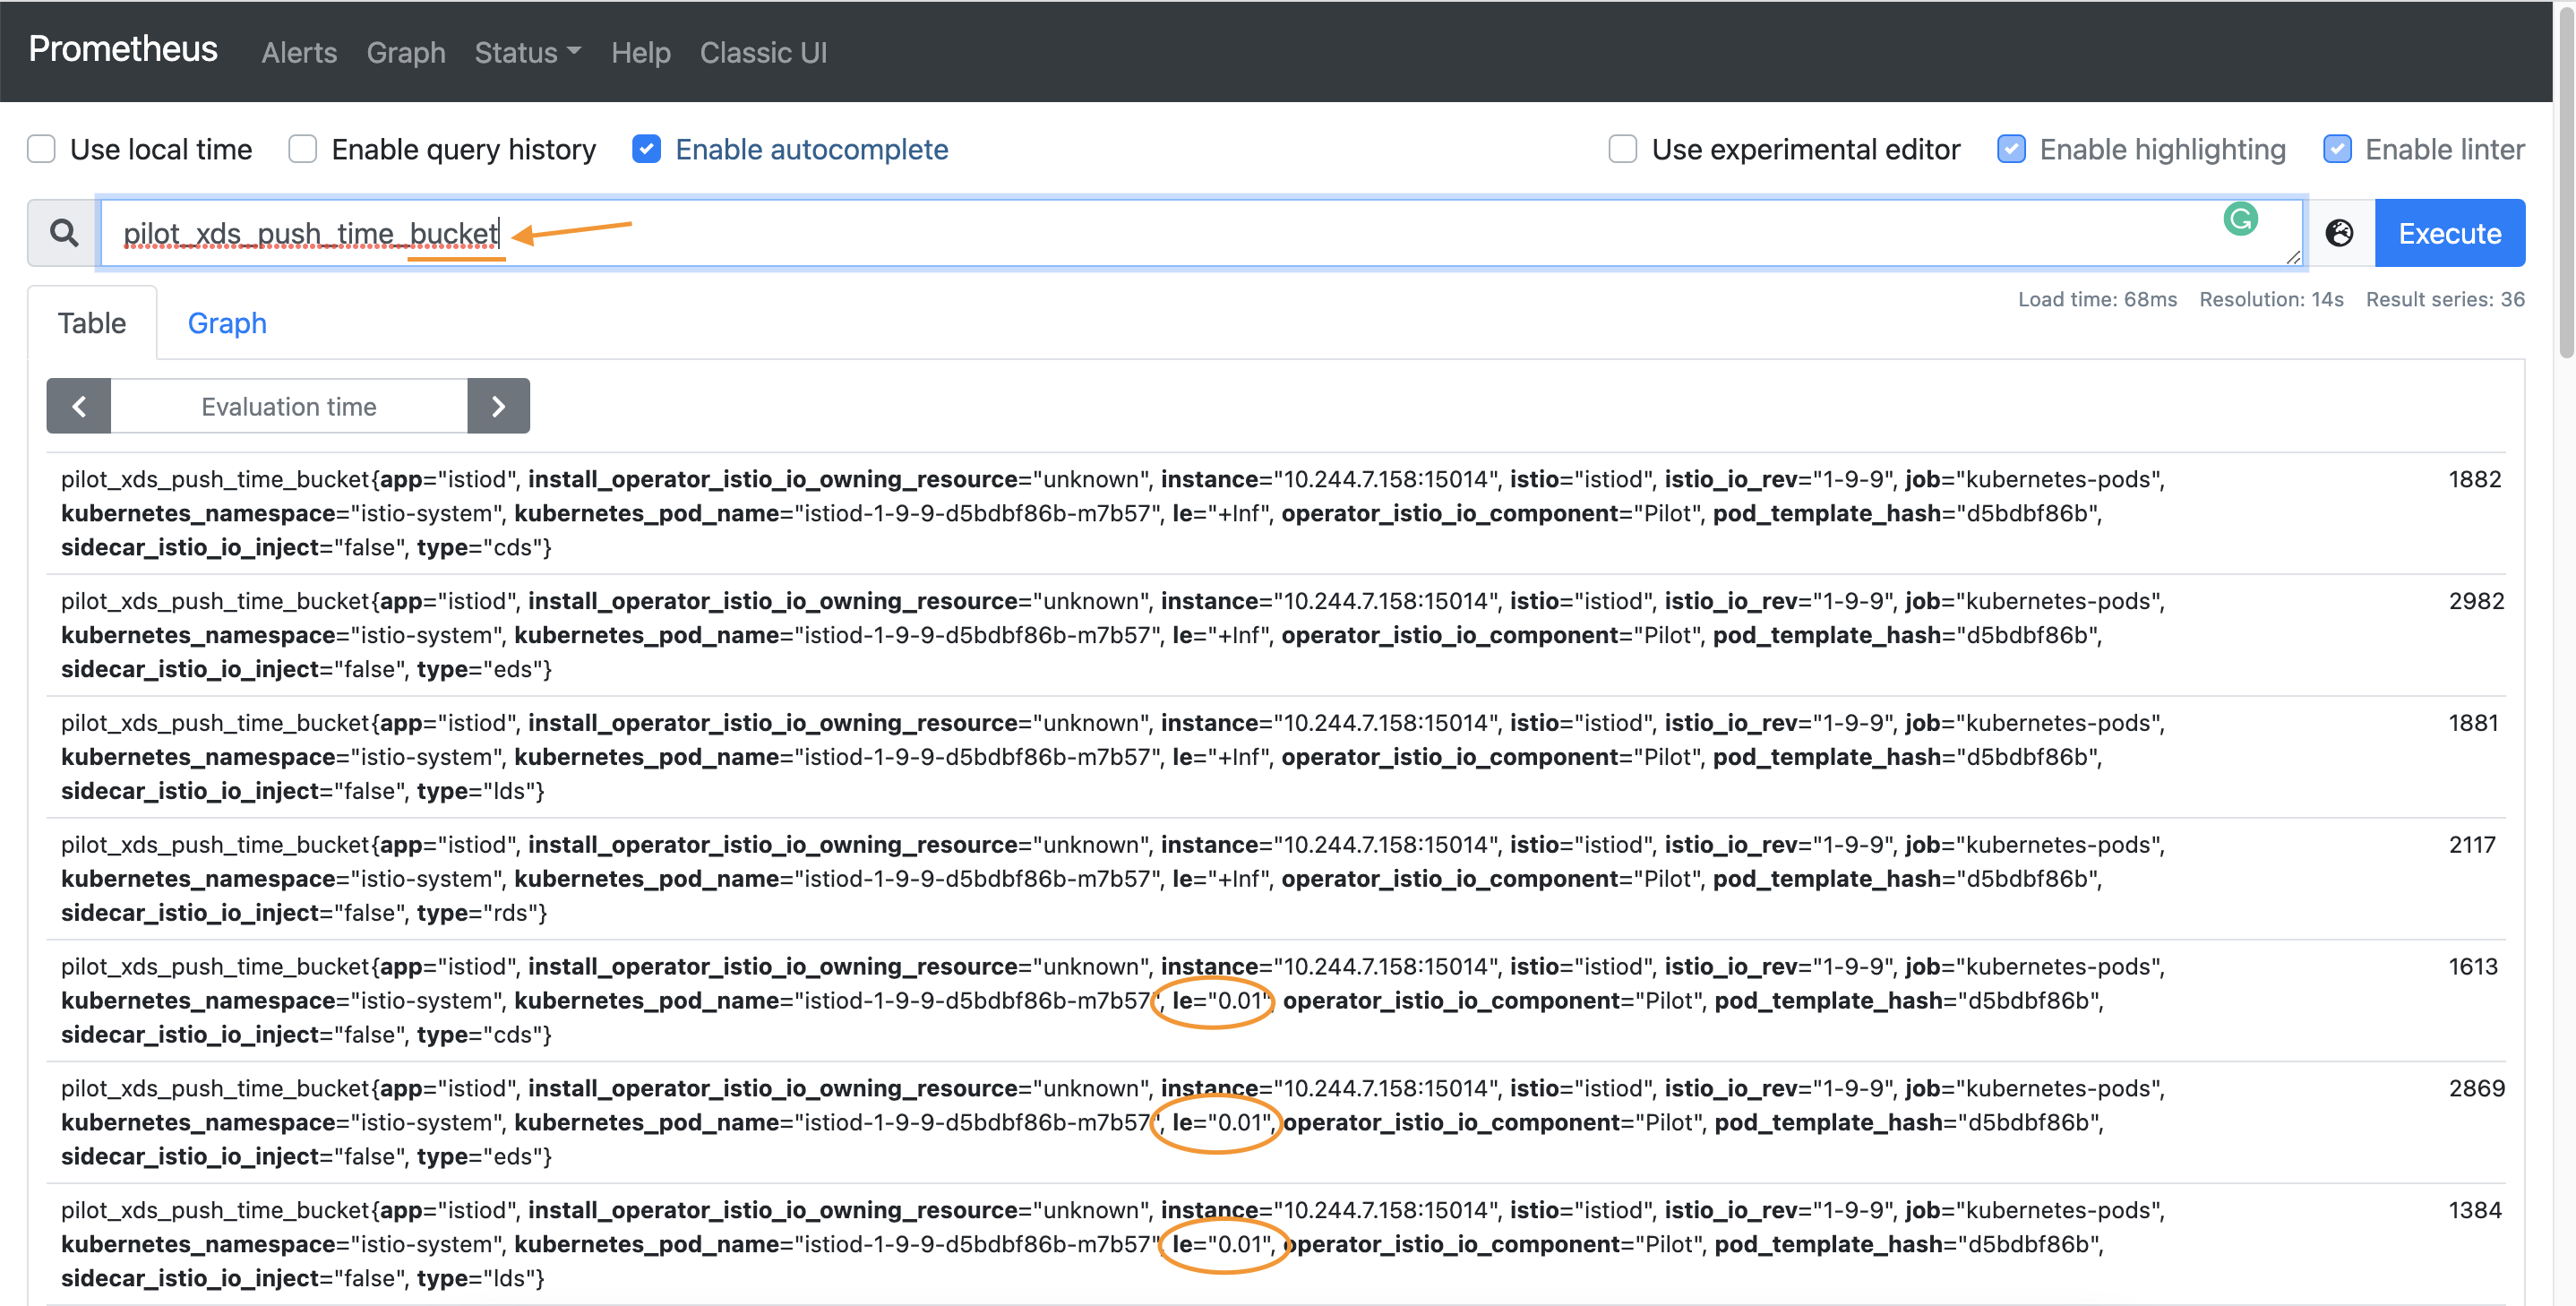
OK => pilot_xds_push_time_bucket
bạn để ý là nó có đuôi là bucket và data của metric có trường le.
1) research
- Histogram: Thực chất là một biểu đồ tích lũy, Histogram tạo bộ đếm cho số lượng sự kiện, bộ đếm cho tổng sự kiện và bộ đếm cho mỗi bucket. Buckets sẽ đếm xem các giá trị bé hoặc lớn hơn giá trị của bucket (trong Prometheus thường là bé hơn “le” )
- Có thể tính toán percentitles từ histogram bằng function histogram_quantile
Links: https://prometheus-book.netlify.app/documentation/
pilot_xds_push_time_bucket – Total time in seconds Pilot takes to push lds, rds, cds and eds.
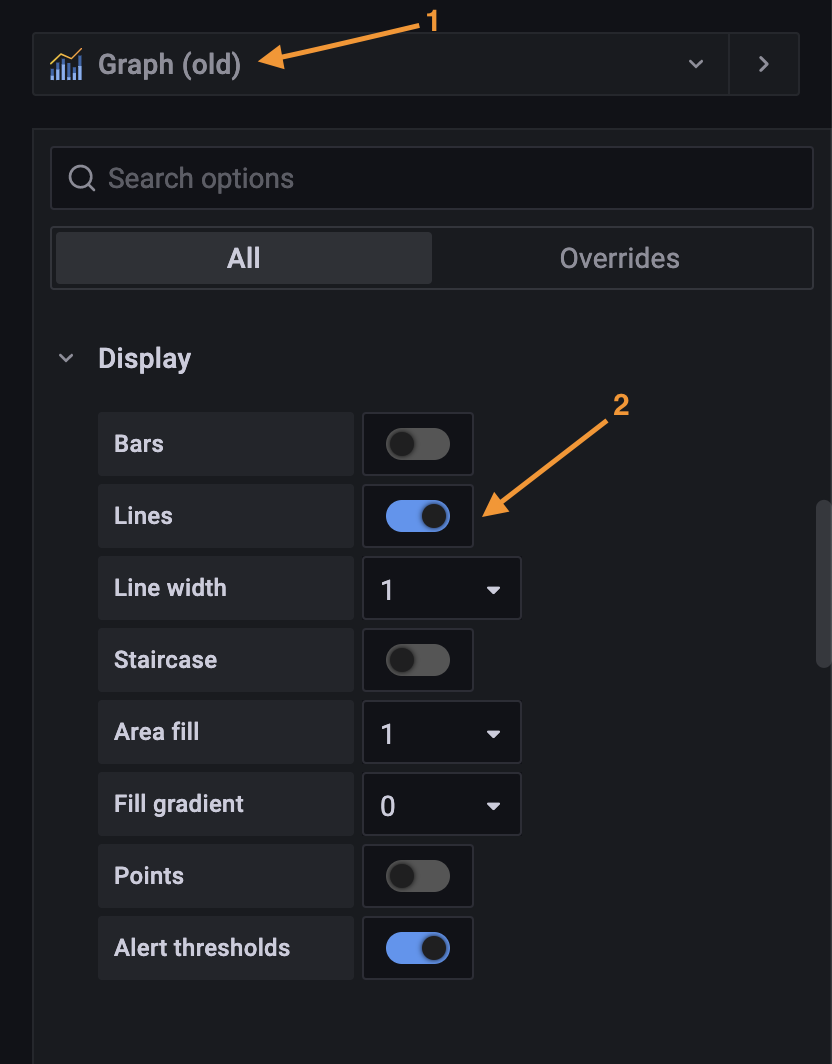
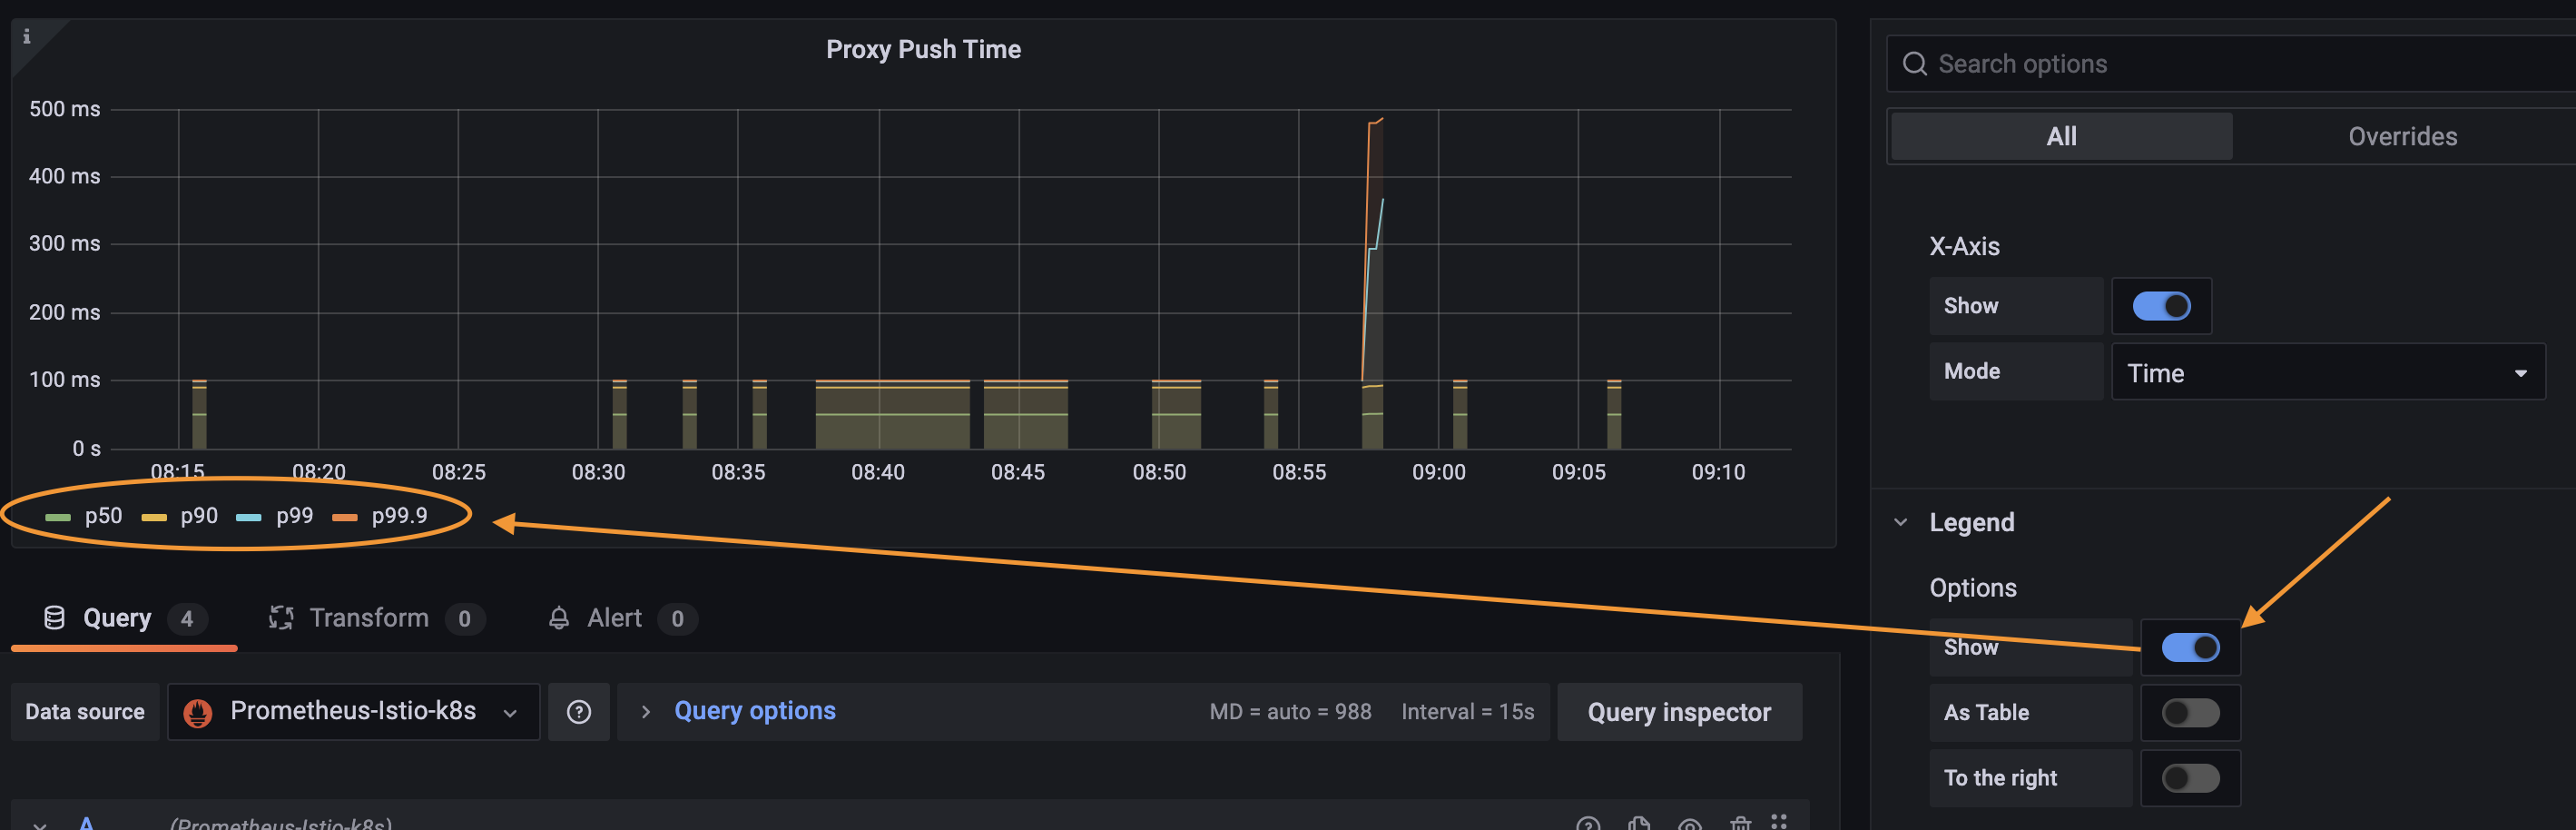
2) Design Grafana chart
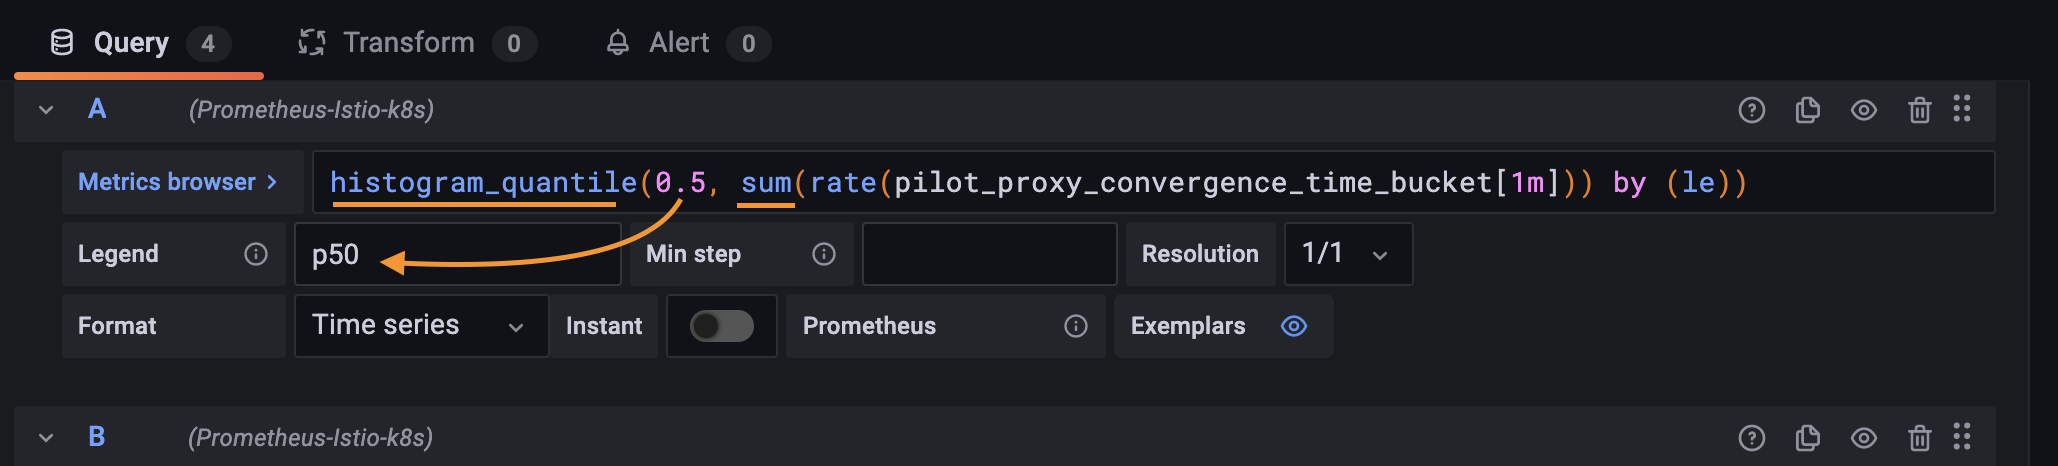
Câu query trên grafana sẽ là như sau
histogram_quantile(0.5, sum(rate(pilot_xds_push_time_bucket[1m])) by (le))
Anh em để ý đây là time_bucket và nó tình theo seconds.
Câu query ở trên sẽ là 50% pilot_xds_push thì mất “xxx” giây hay
pilot_xds_push là “xxx” giây thì chiếm 50%
nghe rối vãi.