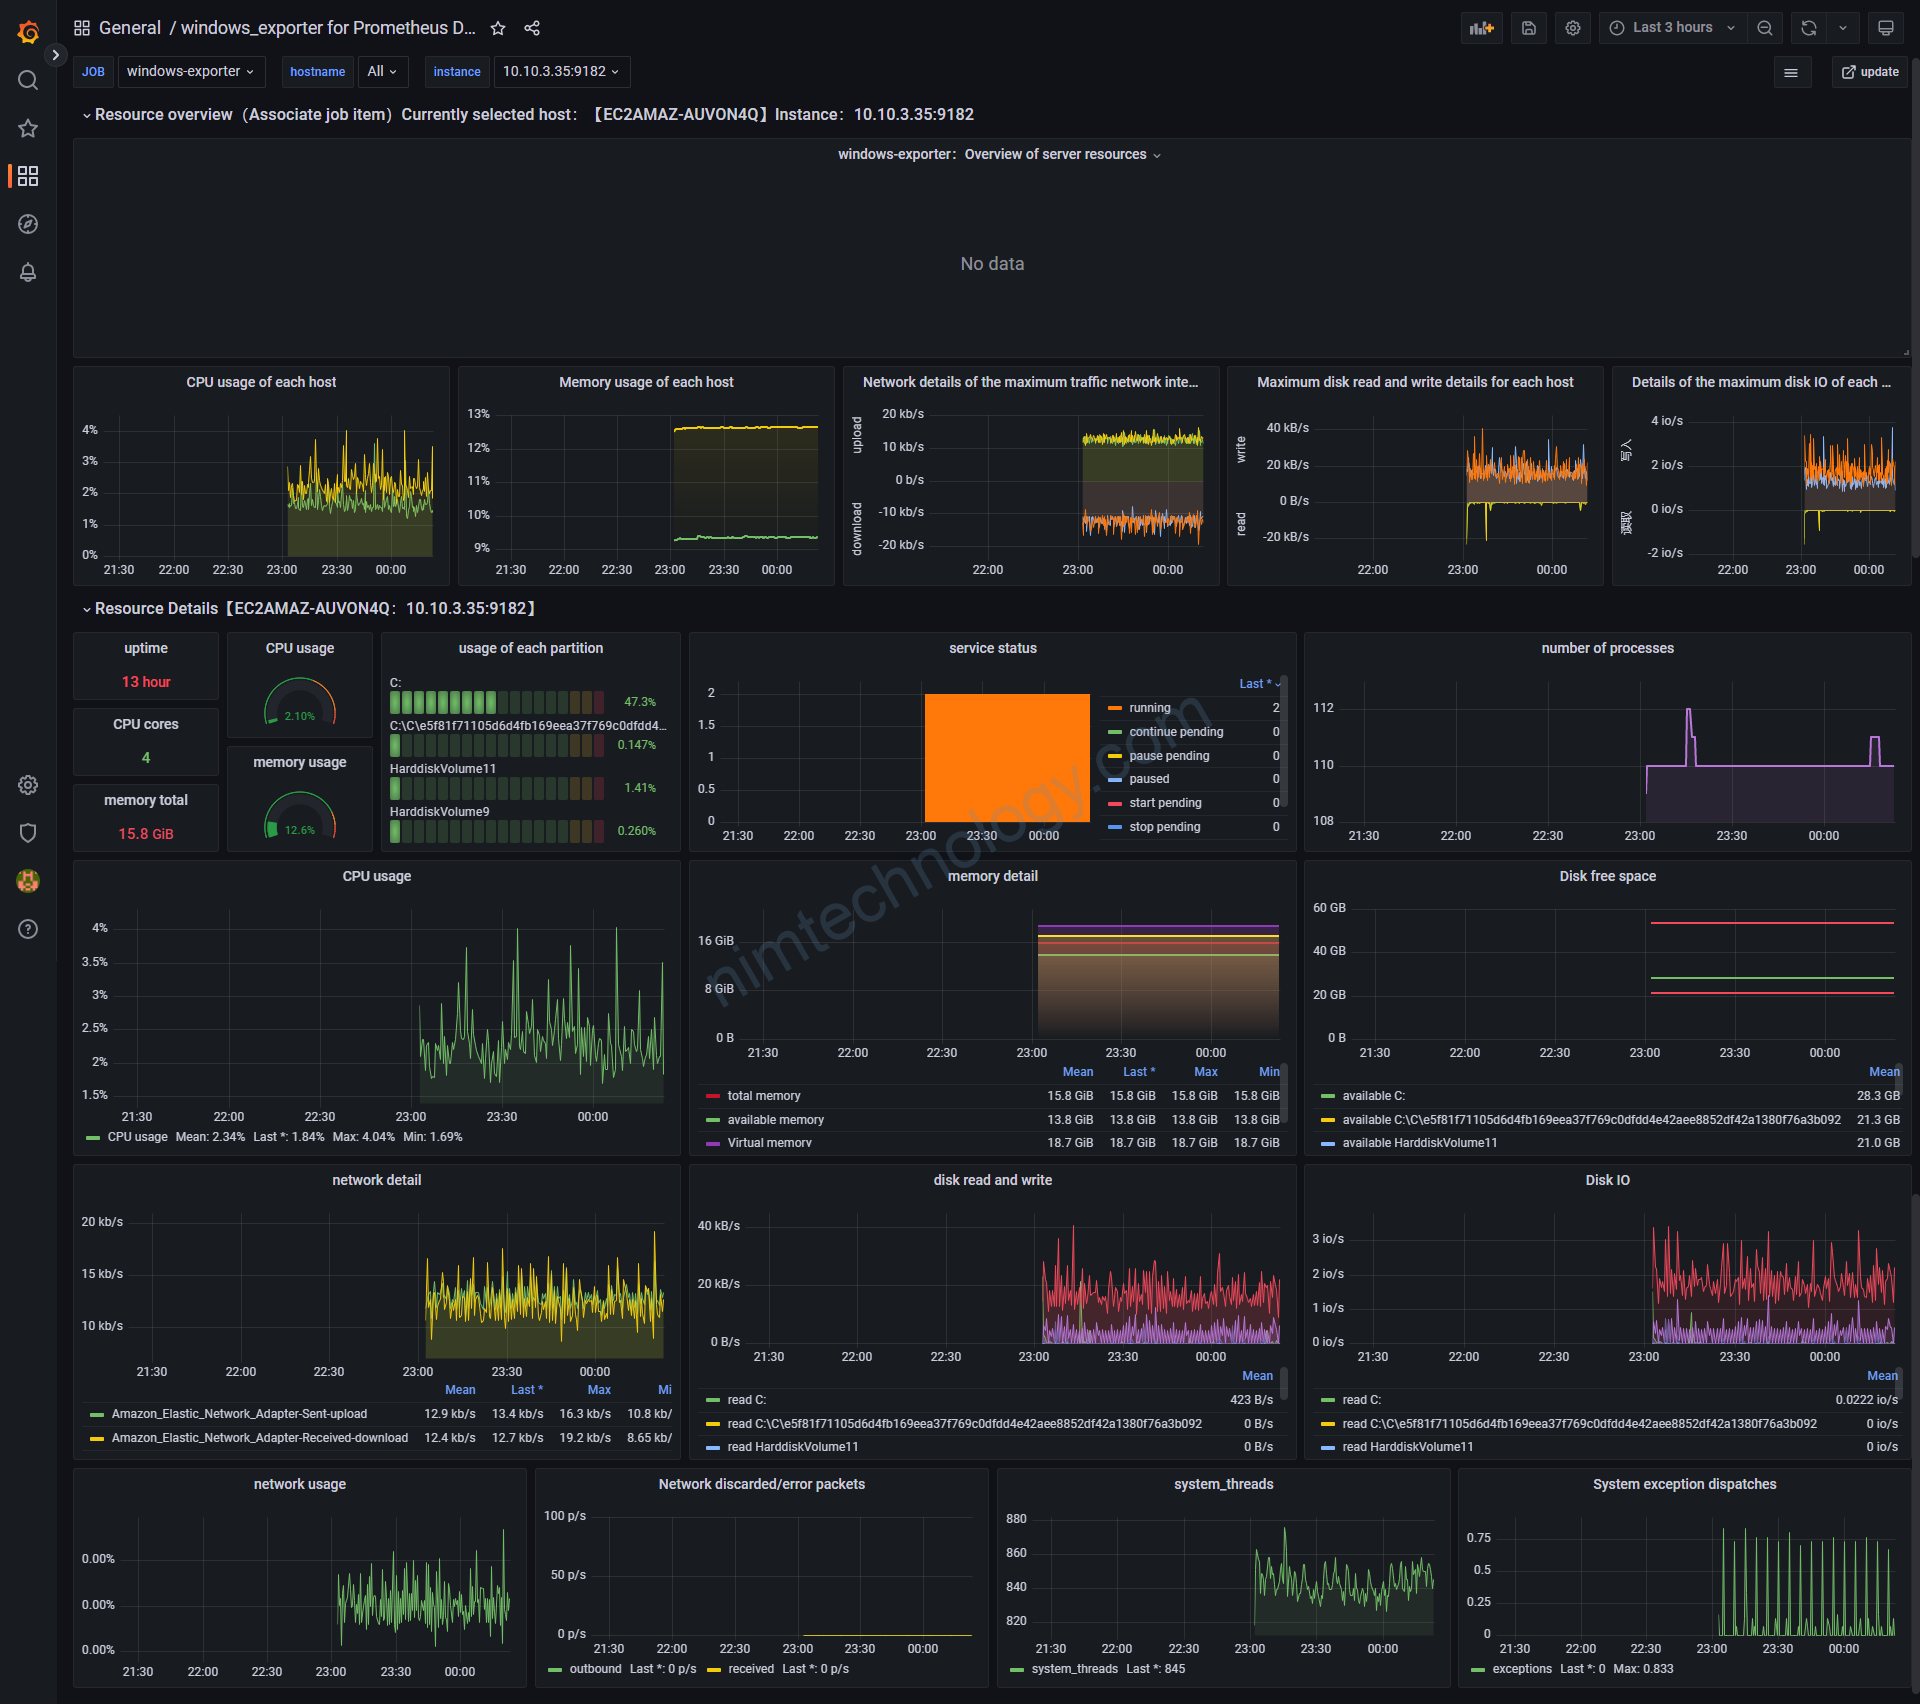
Look into the situation
Đầu tiên chúng ta có 2 metric labels như sau:
Metrics and Labels:
windows_container_cpu_usage_seconds_kernelmode: This metric likely represents the total CPU time (in seconds) that a Windows container has spent in kernel mode.kube_pod_container_info: This metric provides information about Kubernetes pods and their containers.
Look into kube_pod_container_info metrics.
With kube_pod_container_info
container_id: A unique ID for the container.container: The name of the container.image: The image used by the container.image_id: A unique ID for the image used by the container.namespace: The namespace in which the pod resides.pod: The name of the pod.container_restart_count: The number of times this container has been restarted.container_state: The state of the container, e.g., “running”, “waiting”, “terminated”.node: The node where the pod is running.pod_ip: The IP address of the pod.pod_uid: The unique ID of the pod.
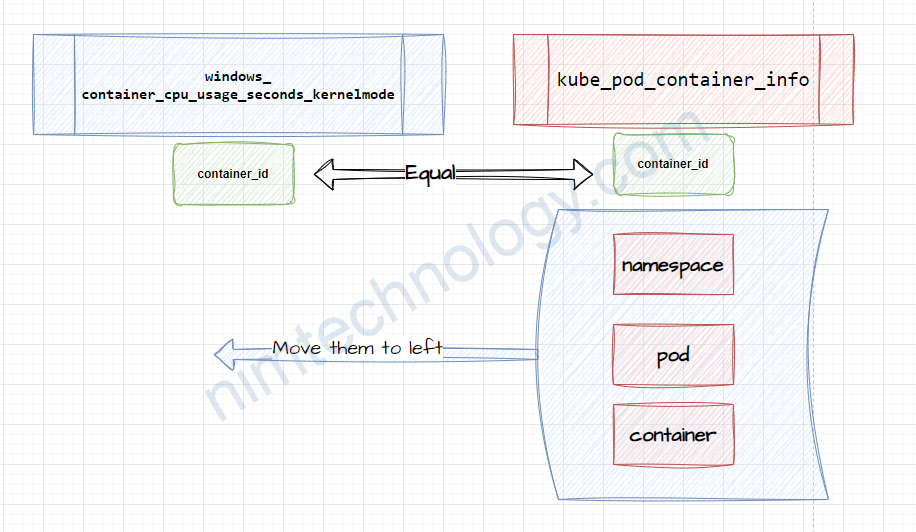
Look into windows_container_cpu_usage_seconds_kernelmode
windows_container_cpu_usage_seconds_kernelmode thì có container_id, nhưng lại không có namespace, pod, container
==> Bằng mắt: thì chúng ta không thể nào nhận biết được CPU usage này của container nào.
Từ đây chúng ta lấy namespace, pod, container của kube_pod_container_info sang windows_container_cpu_usage_seconds_kernelmode
Query sẽ là:
windows_container_cpu_usage_seconds_kernelmode * on(container_id) group_left(namespace, pod, container) kube_pod_container_info{container_id!=""}on(container_id) => This is a join operation. It joins the windows_container_cpu_usage_seconds_kernelmode metric with the kube_pod_container_info metric based on the container_id label.
group_left(namespace, pod, container) ensures that the resulting metric retains the namespace, pod, and container labels from the kube_pod_container_info metric.
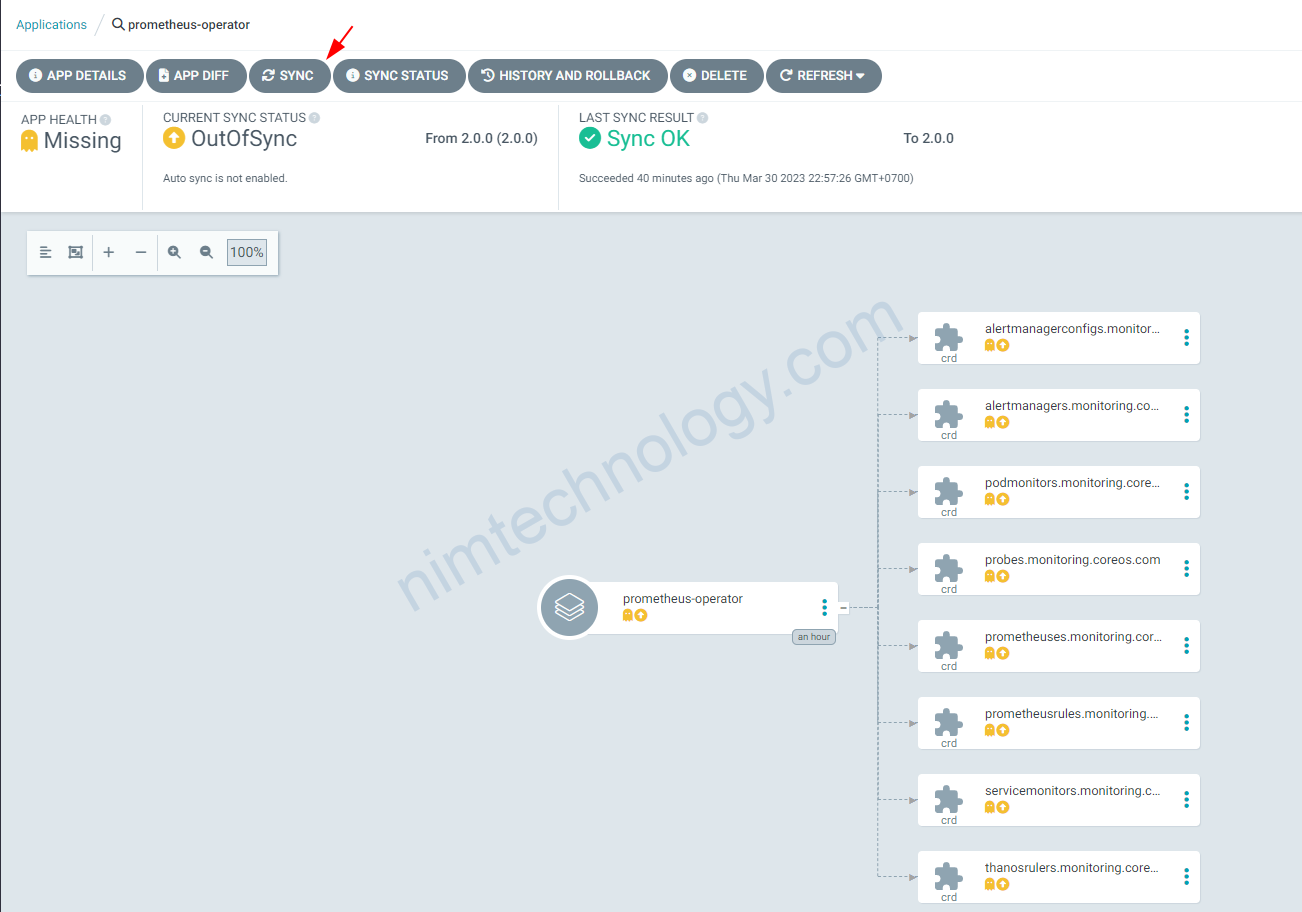
kube_pod_container_info được cung cấp bới kube-state-metrics component.
mà trong cluster mình cài 2 kube-state-metrics components:
– kubecost-nimtechnology-staging
– prometheus-nimtechnology-staging
Và khi query mình bị lỗi bên dưới.
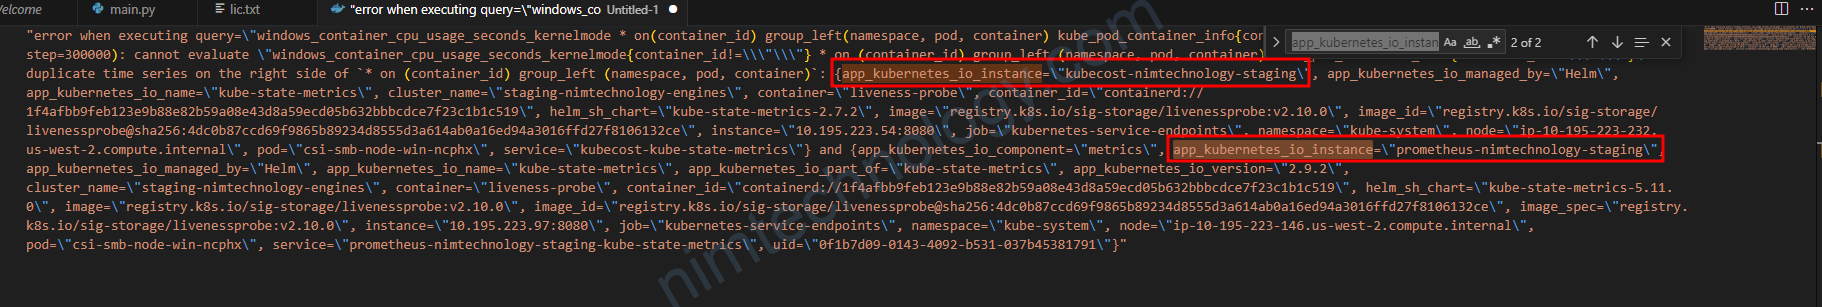
The error message you’re seeing is due to a group_left join in a Prometheus query that results in duplicate time series on the right side. This is common when you’re trying to join two metrics on a specific label (in this case, container_id), and the right metric (kube_pod_container_info in your query) has multiple entries with the same container_id.
mình đã sửa bằng cách: extra the Query: app_kubernetes_io_instance=”prometheus-nimtechnology-staging”
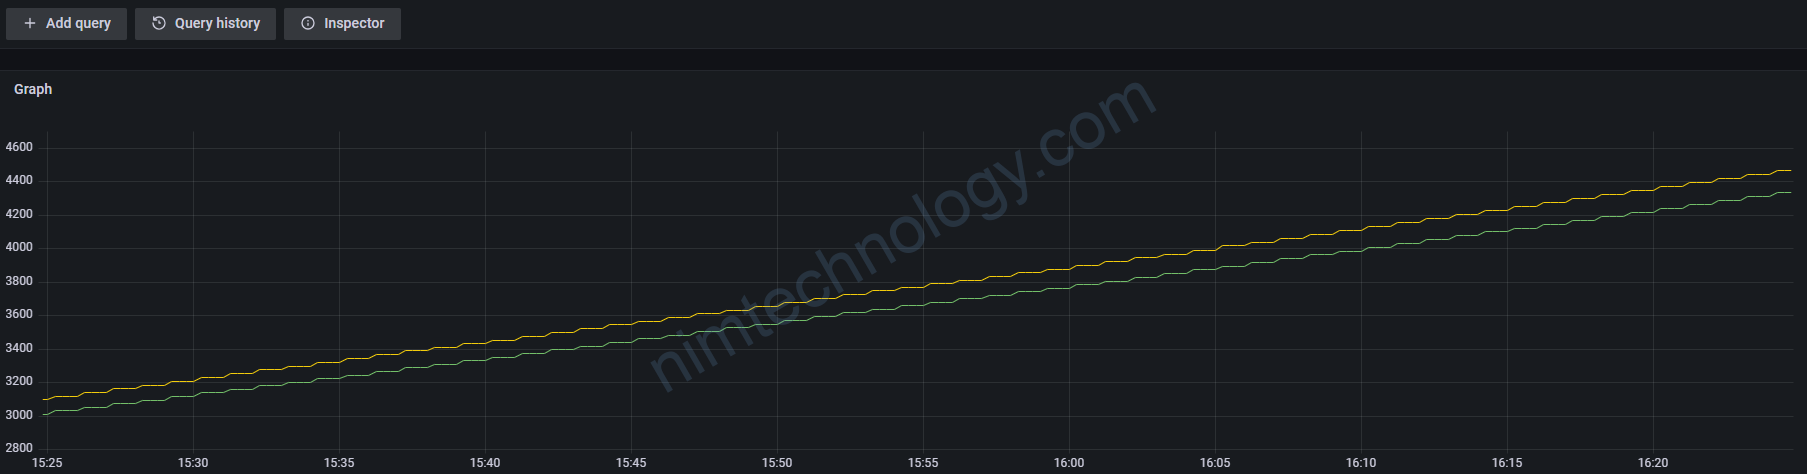
windows_container_cpu_usage_seconds_kernelmode * on(container_id) group_left(namespace, pod, container) kube_pod_container_info{app_kubernetes_io_instance="prometheus-nimtechnology-staging",container_id!=""}Giờ chart trên grafana:
https://github.com/prometheus-community/windows_exporter/blob/master/docs/collector.container.md
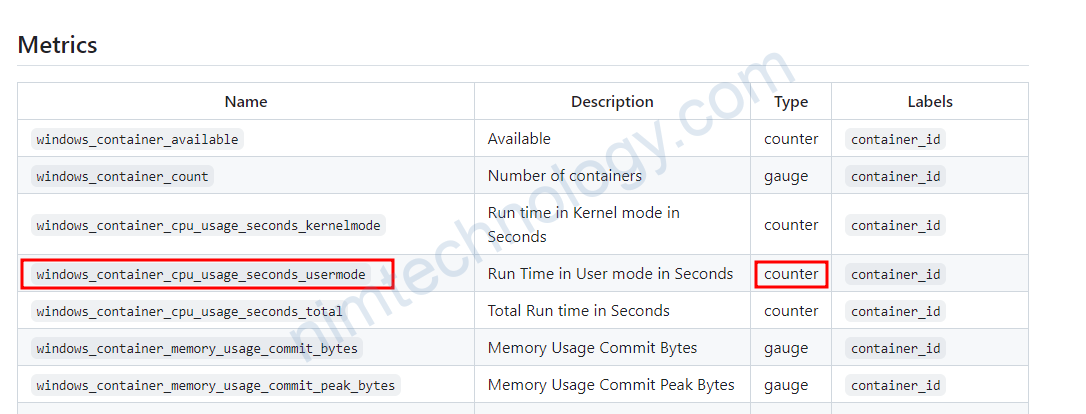
windows_container_cpu_usage_seconds_total có type là counter
windows_container_cpu_usage_seconds_kernelmode * on(container_id) group_left(namespace, pod, container) kube_pod_container_info{app_kubernetes_io_instance="prometheus-nimtechnology-staging",container_id!=""}Tiếp theo mình sẽ sử dụng rate để vẻ bảng chart.
rate(windows_container_cpu_usage_seconds_kernelmode * on(container_id) group_left(namespace, pod, container) kube_pod_container_info{app_kubernetes_io_instance="prometheus-nimtechnology-staging",container_id!=""}[1m])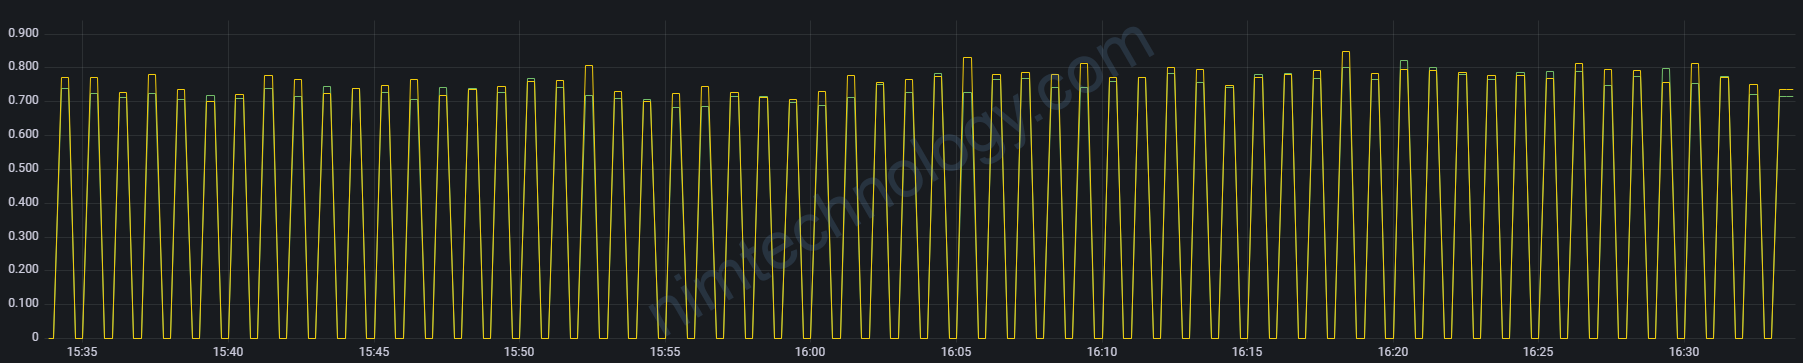
https://stackoverflow.com/questions/34923788/prometheus-convert-cpu-user-seconds-to-cpu-usage
mình giảm 1m -> 30s
rate(windows_container_cpu_usage_seconds_kernelmode * on(container_id) group_left(namespace, pod, container) kube_pod_container_info{app_kubernetes_io_instance="prometheus-nimtechnology-staging",container_id!=""}[30])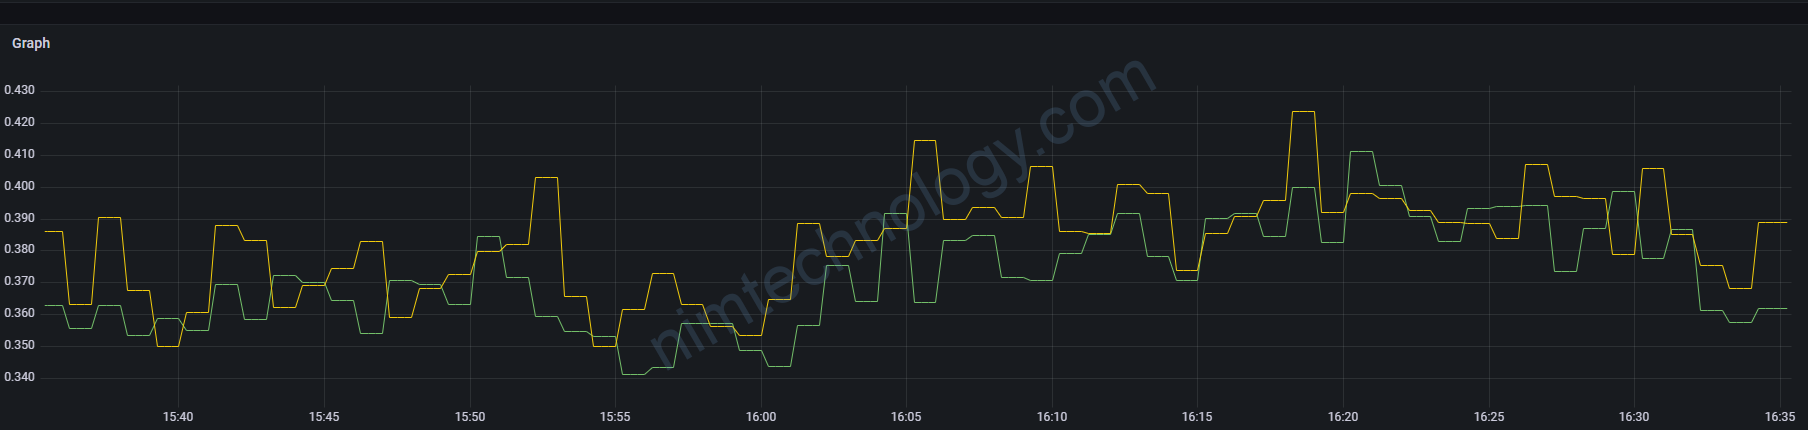
Ngoài ra bạn có thể coi video bên dưới để có nhiều query monitor container.