Hello sau rất nhiều bài note của mình về istio. Mình nghĩ là chúng ta đã đầy đủ n
ăng lực để quản trị hệ thông istio rùi ý.
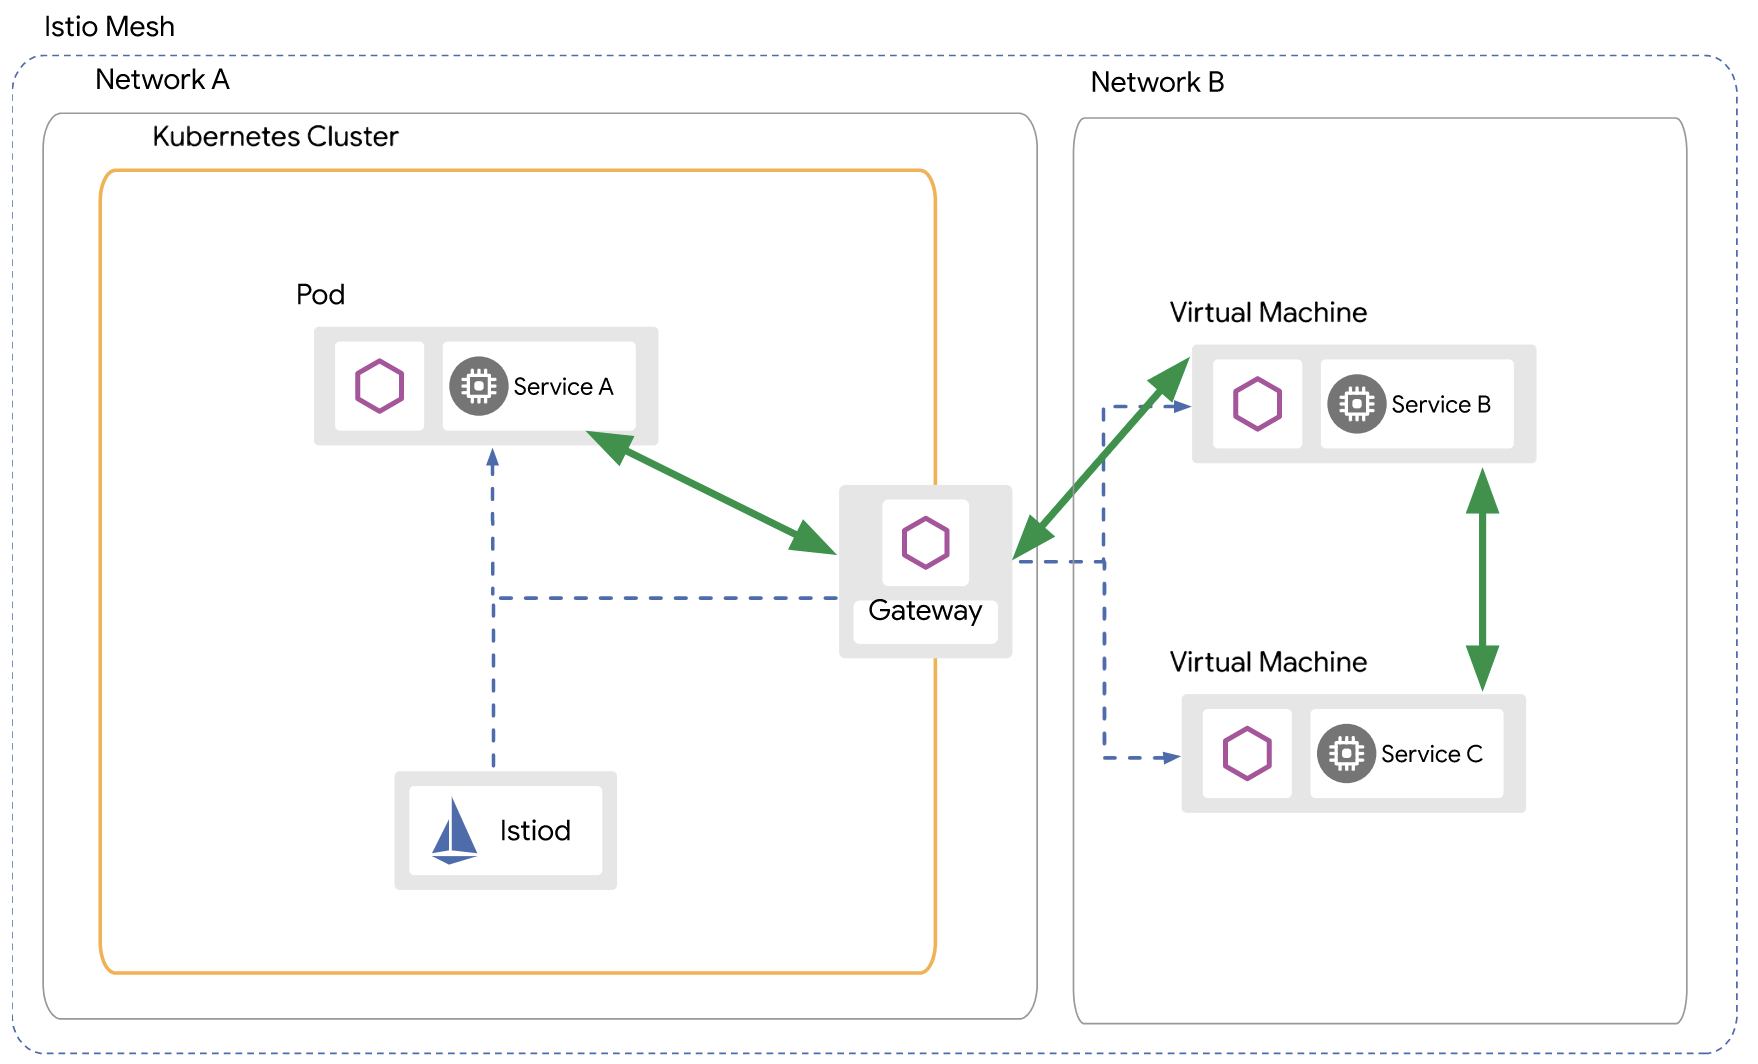
Chúng ta tìm hiểu về việc các đặt các công củ để monitor hệ thống istio và đặc biệt là hệ thống multi-cluster của istio.
Istio đã cung cấp sẵn các manifest về kiali, prometheus, grafana, jaeger ở link sau:
https://github.com/istio/istio/tree/master/samples/addons
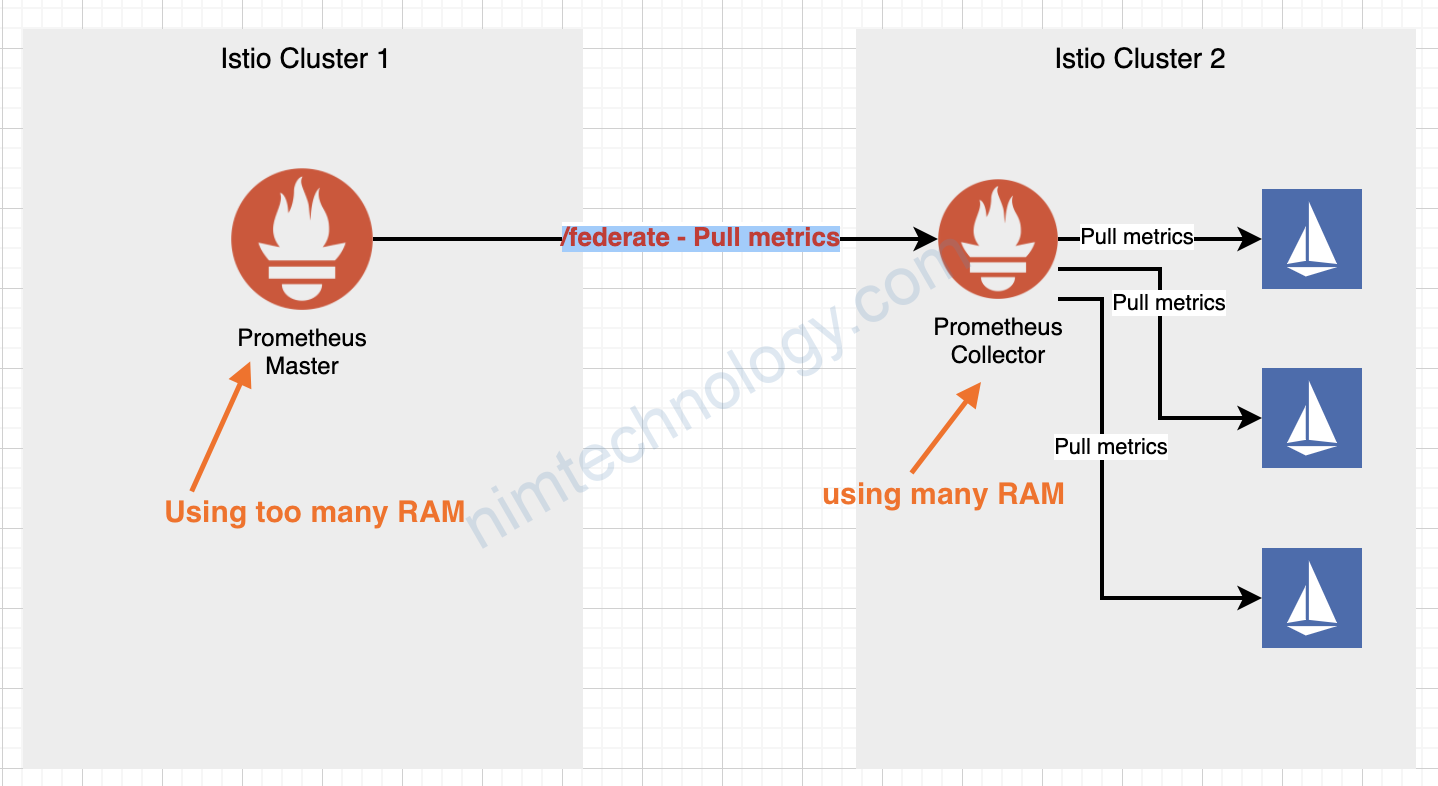
Mình tham khảo link sau: Observability Best Practices và mình chọn mô hình Federation using workload-level aggregated metrics
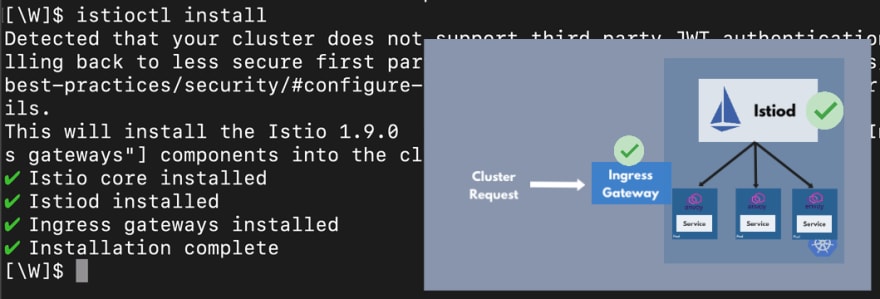
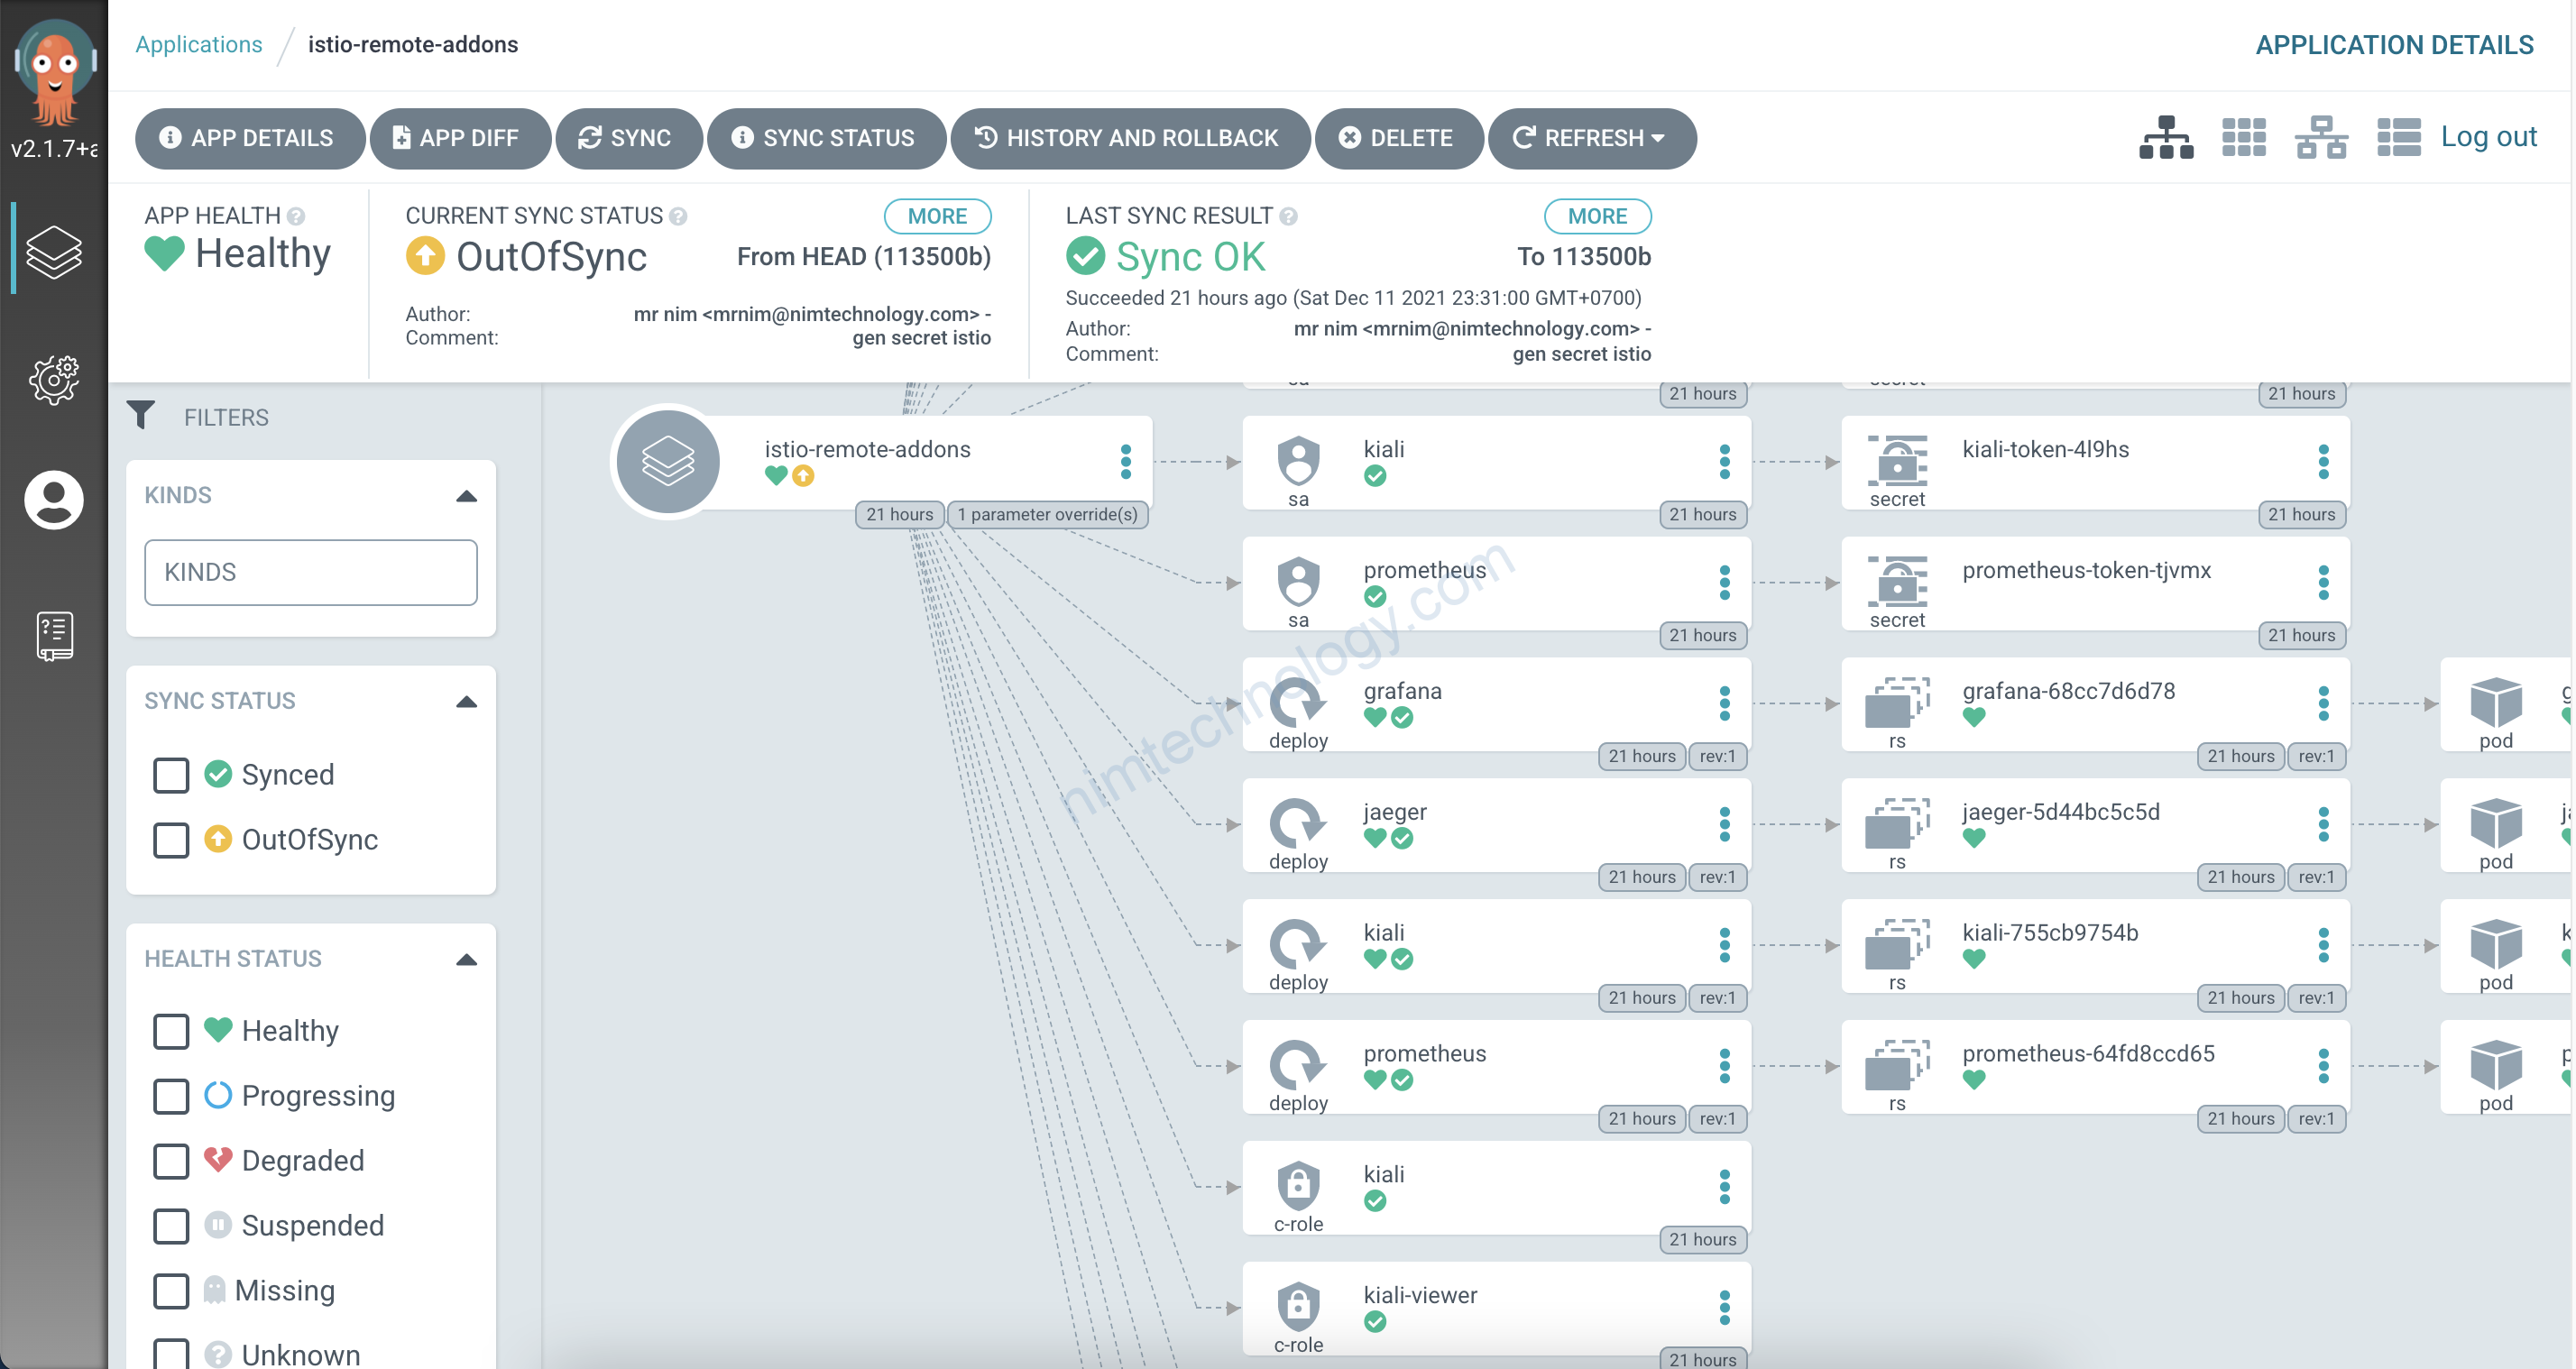
Đầu tiền anh em cài bộ addons trên từng cluster nhé.
1) Prometheus
Giờ trên cluster1 (primary) mình có 1 prometheus-primary với link sau: http://prometheus-istio.nimtechnology.com/
Còn trên cluster2 (remote) mình có một con prometheus-remote là: http://192.168.101.51:32166/ mình lười nên mình nodeport cho lẹ
Bạn sẽ hiểu đơn giản là con prometheus-primary sẽ đọc dữ liệu của prometheus-remote thông qua path “/federate”
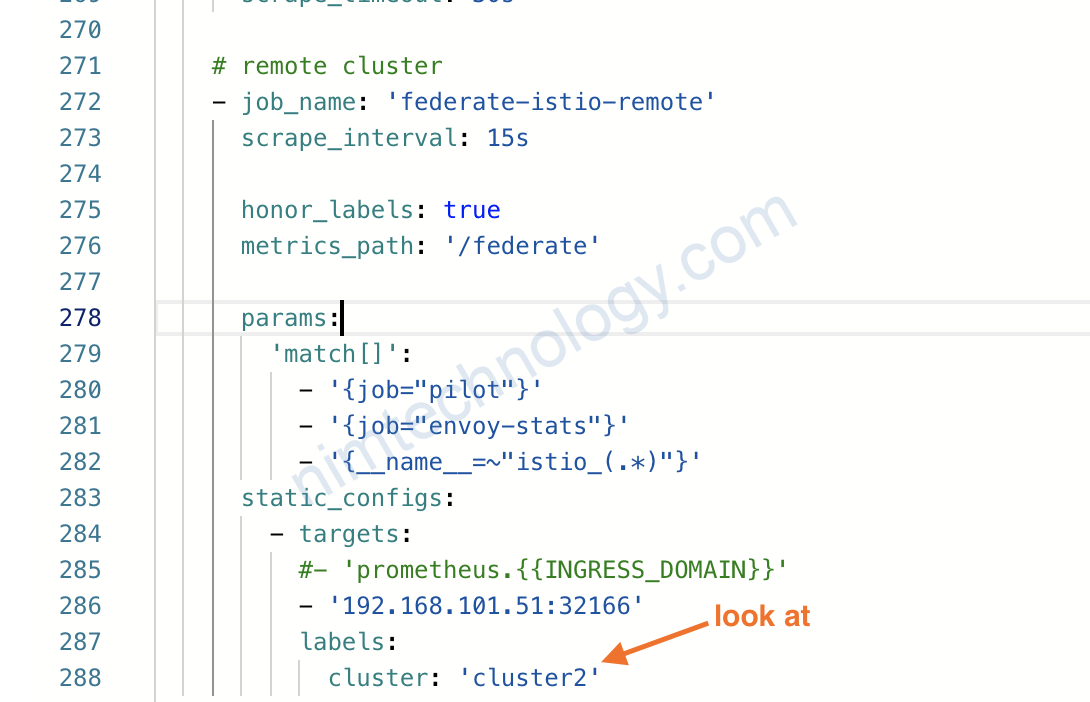
Bạn sẽ cần thêm vào configmap của prometheus-primary như sau:
scrape_configs:
# remote cluster
- job_name: 'federate-istio-remote'
scrape_interval: 15s
honor_labels: true
metrics_path: '/federate'
params:
'match[]':
- '{job="pilot"}'
- '{job="envoy-stats"}'
- '{__name__=~"istio_(.*)"}'
static_configs:
- targets:
#- 'prometheus.{{INGRESS_DOMAIN}}'
- '192.168.101.51:32166'
labels:
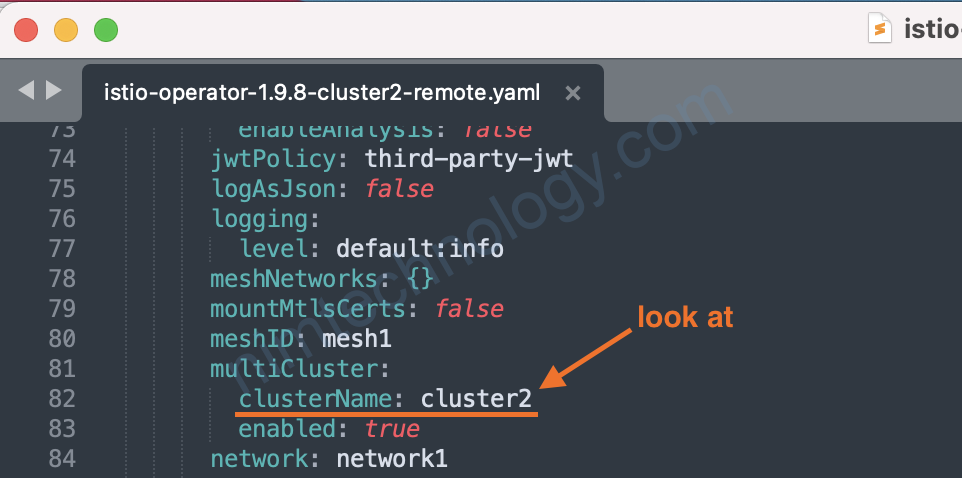
cluster: 'cluster2'
CLUSTER_NAME should be set to the same value that you used to create the cluster (set via values.global.multiCluster.clusterName).https://istio.io/latest/docs/ops/configuration/telemetry/monitoring-multicluster-prometheus/
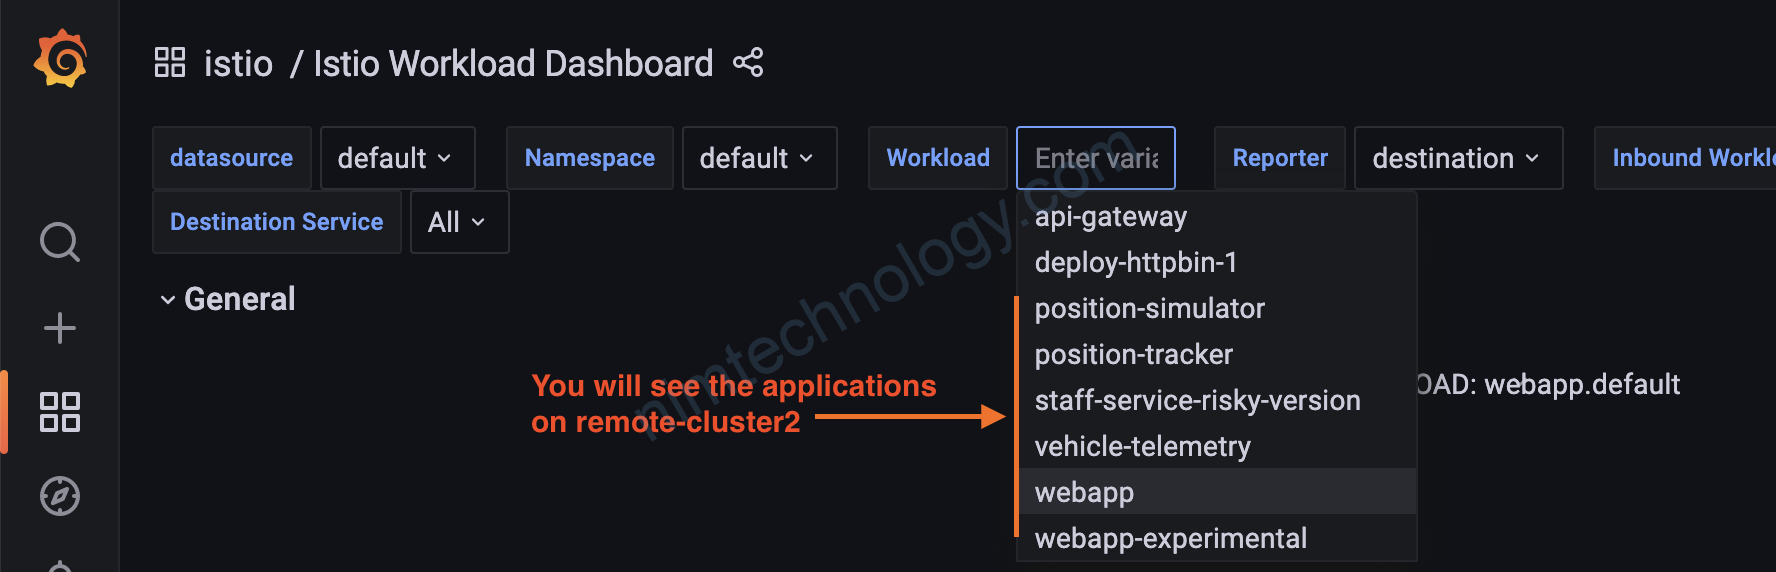
Và bạn cần chú ý để prometheus-primary có thể thấy được các workload của cluster remote thì cần phải có line sau: '{name=~"istio_(.*)"}'
Mình sẽ vào grafana của primary cluster1 để kiểm tra:
http://grafana-istio.nimtechnology.com/
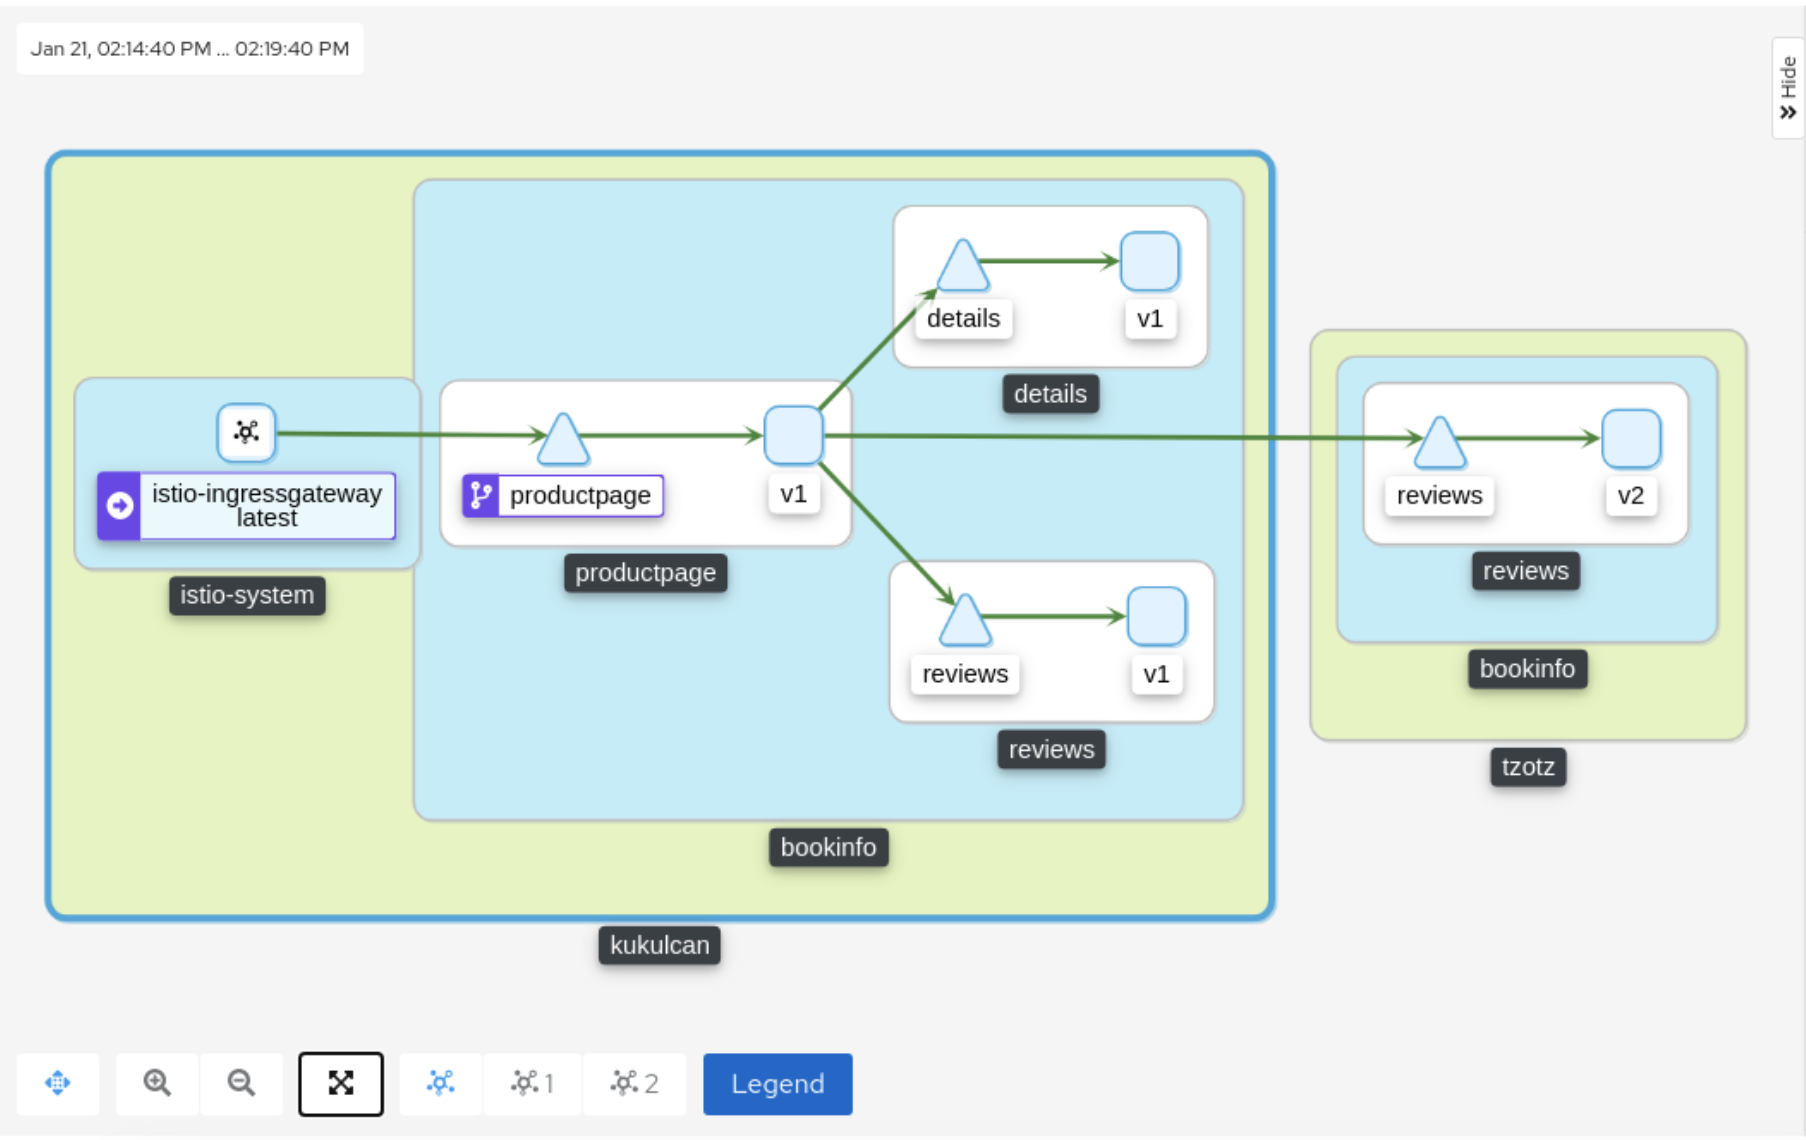
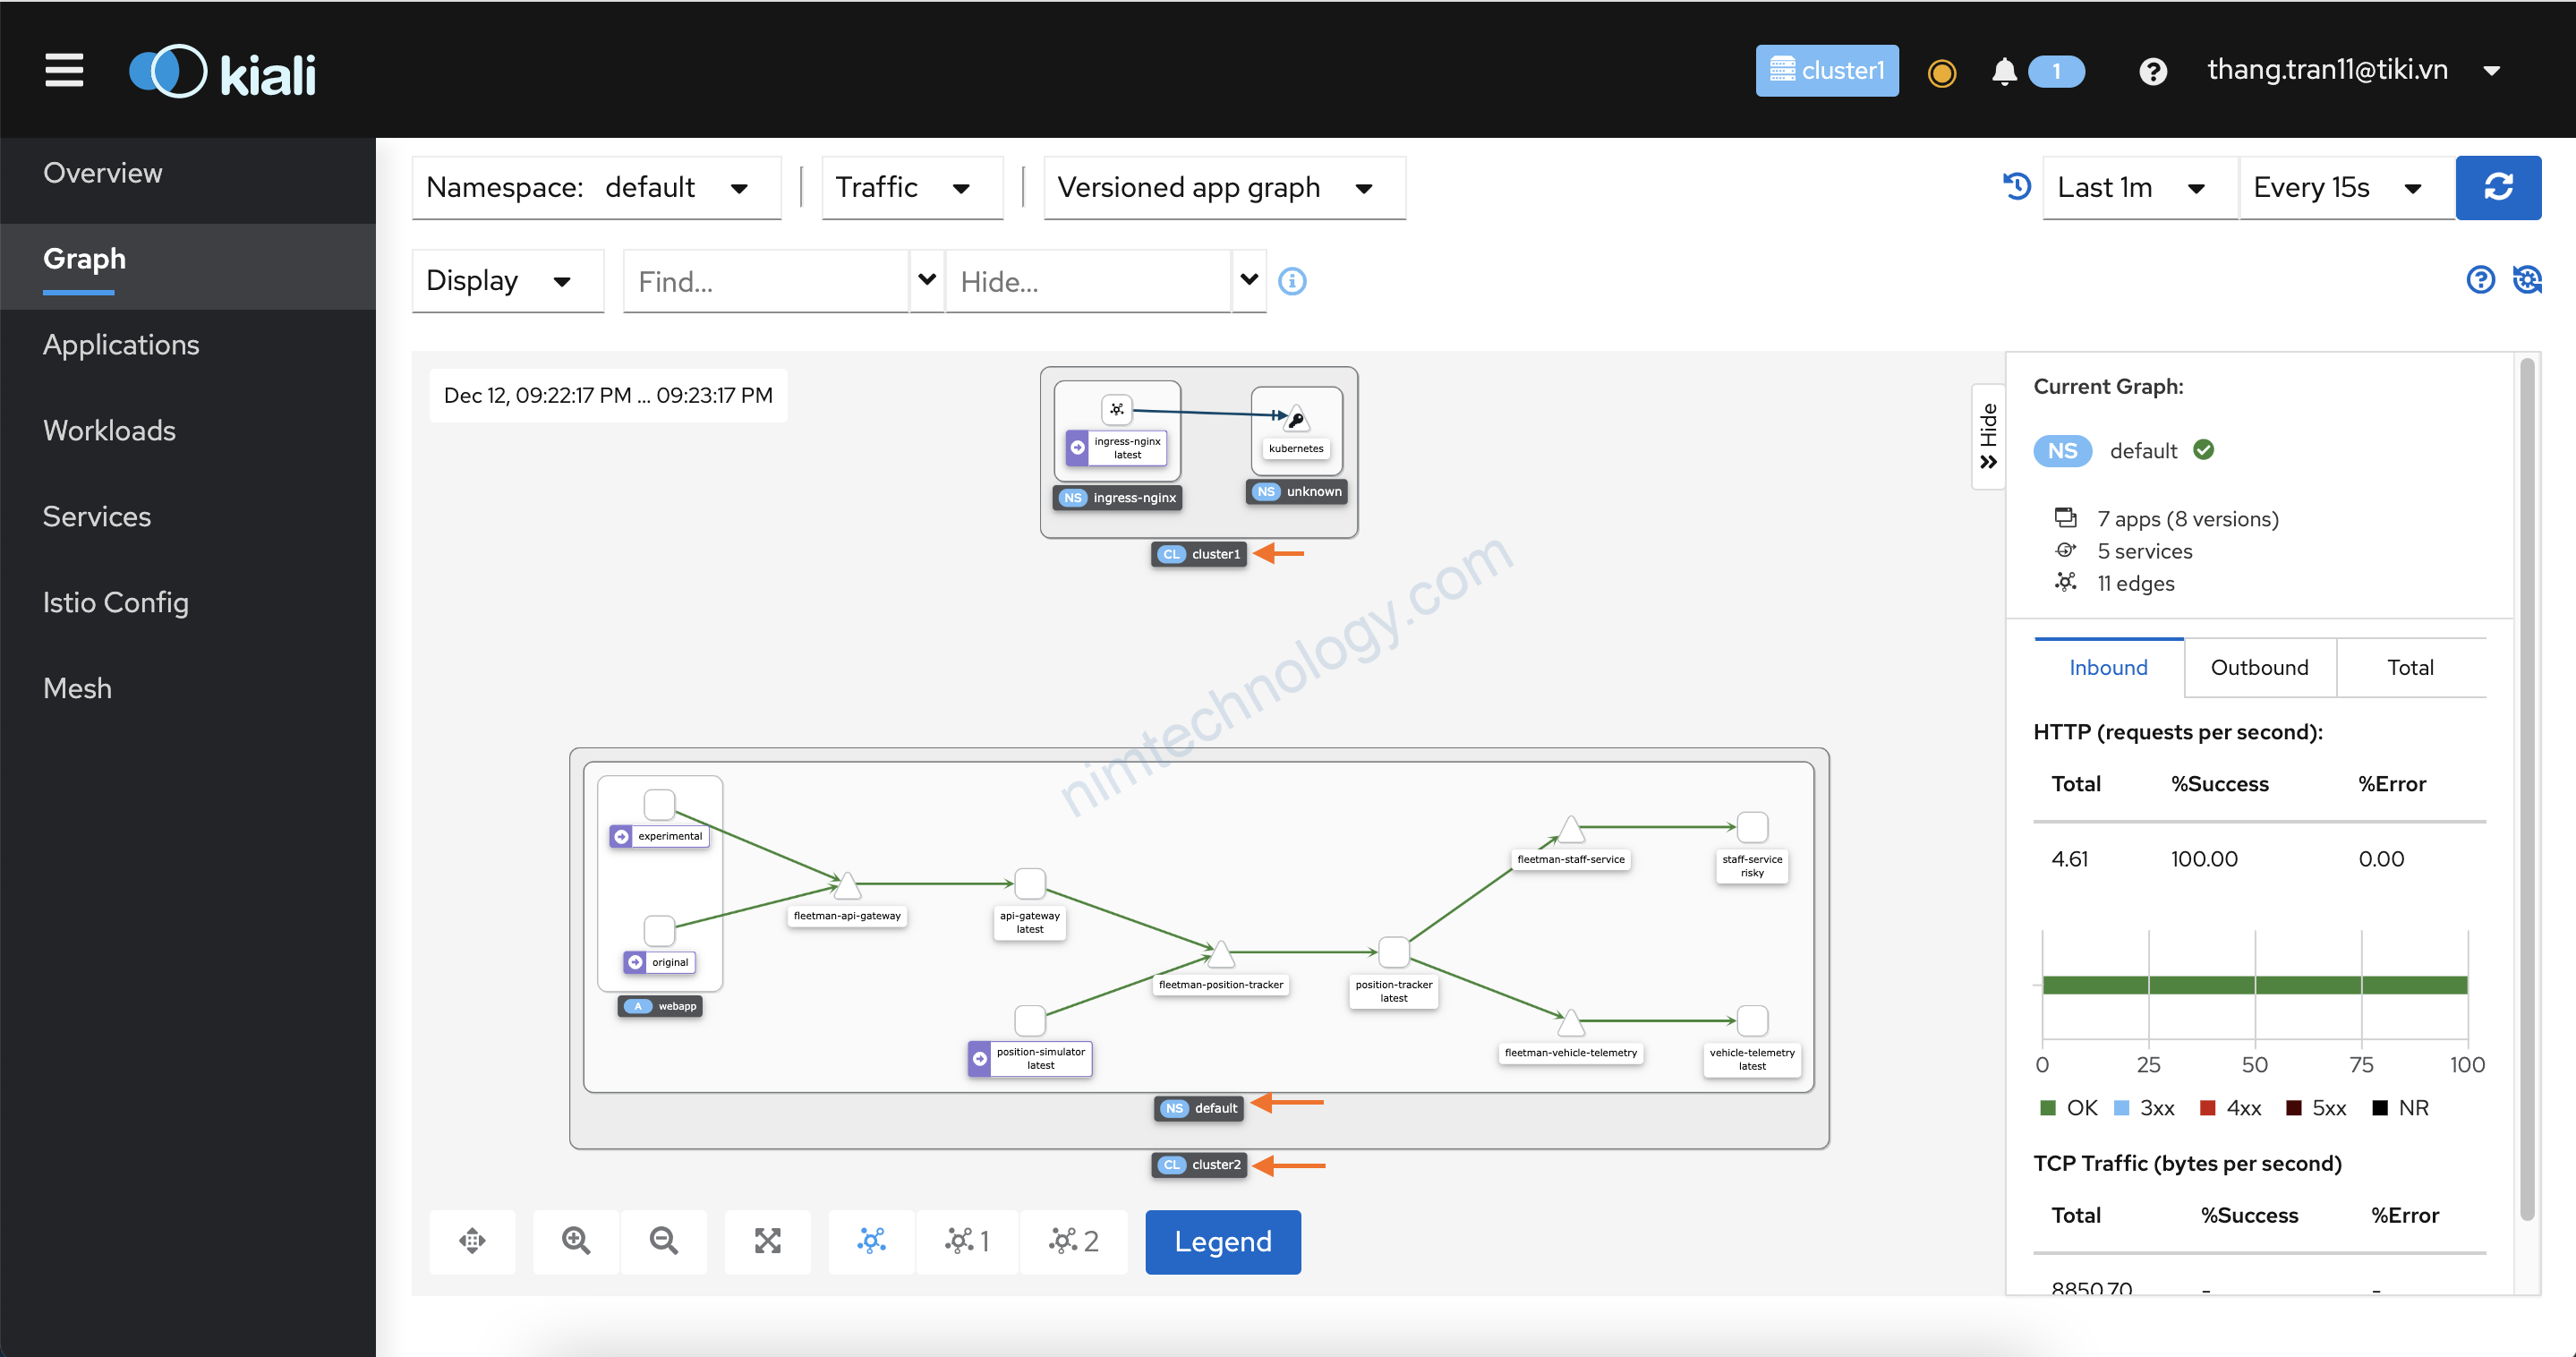
2) Kiali
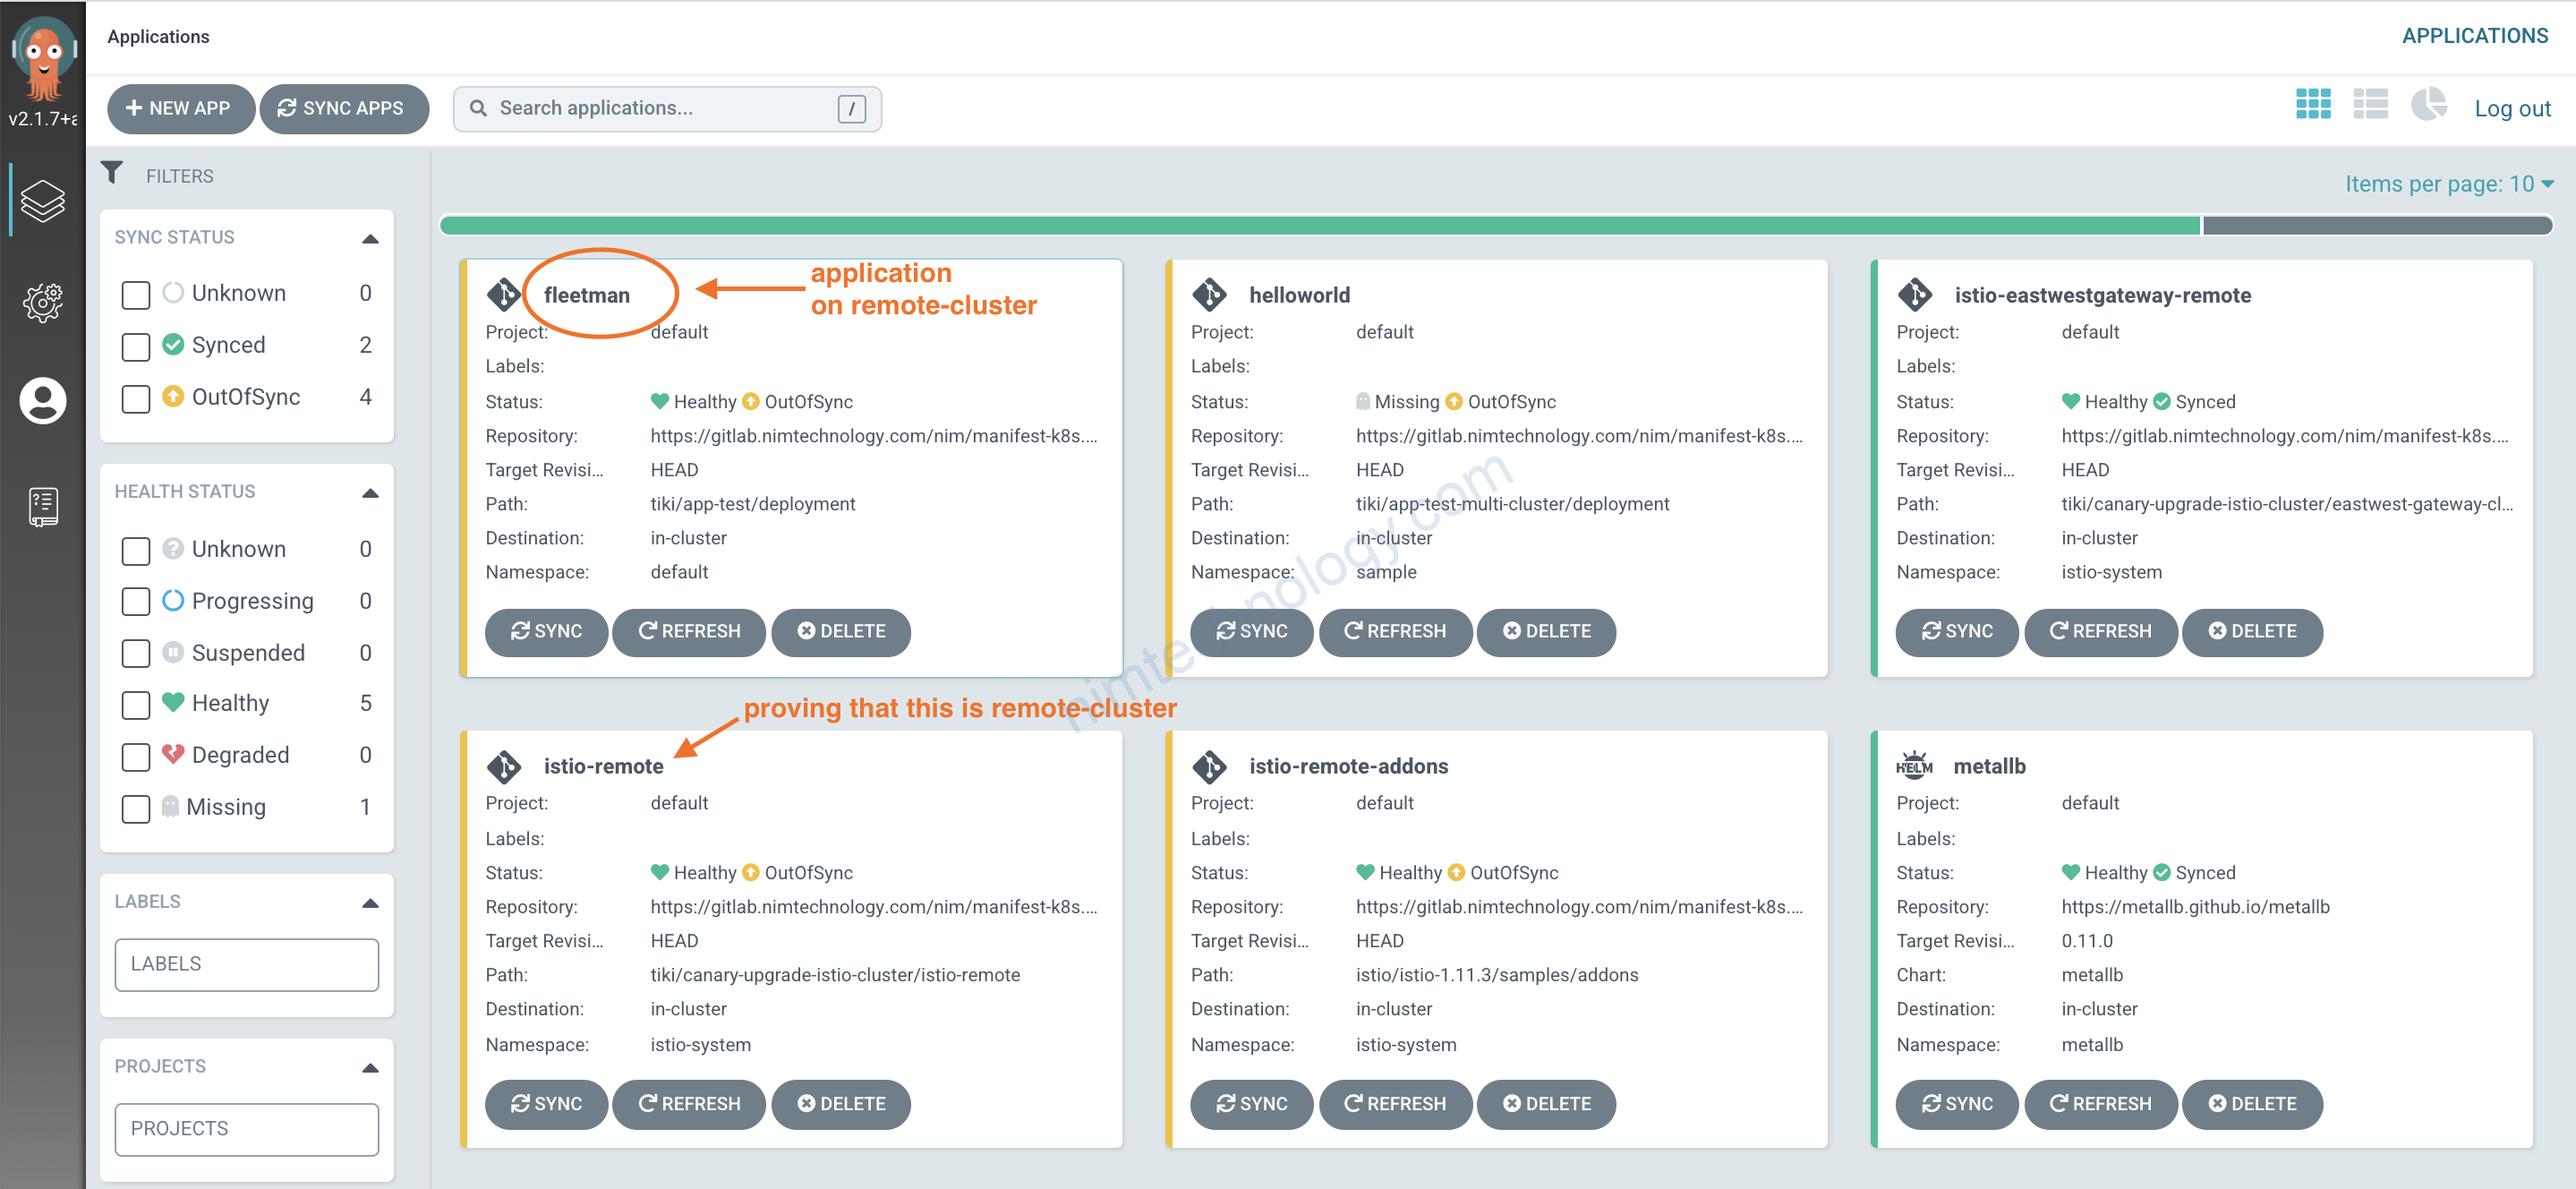
Có 1 điều rất hay là mình chưa check kĩ là trên kiali-primary cũng thấy được các app của remote-cluster2 luôn
Nhưng chúng ta cần select một bài option để thấy được rõ app nào trên cluster nào
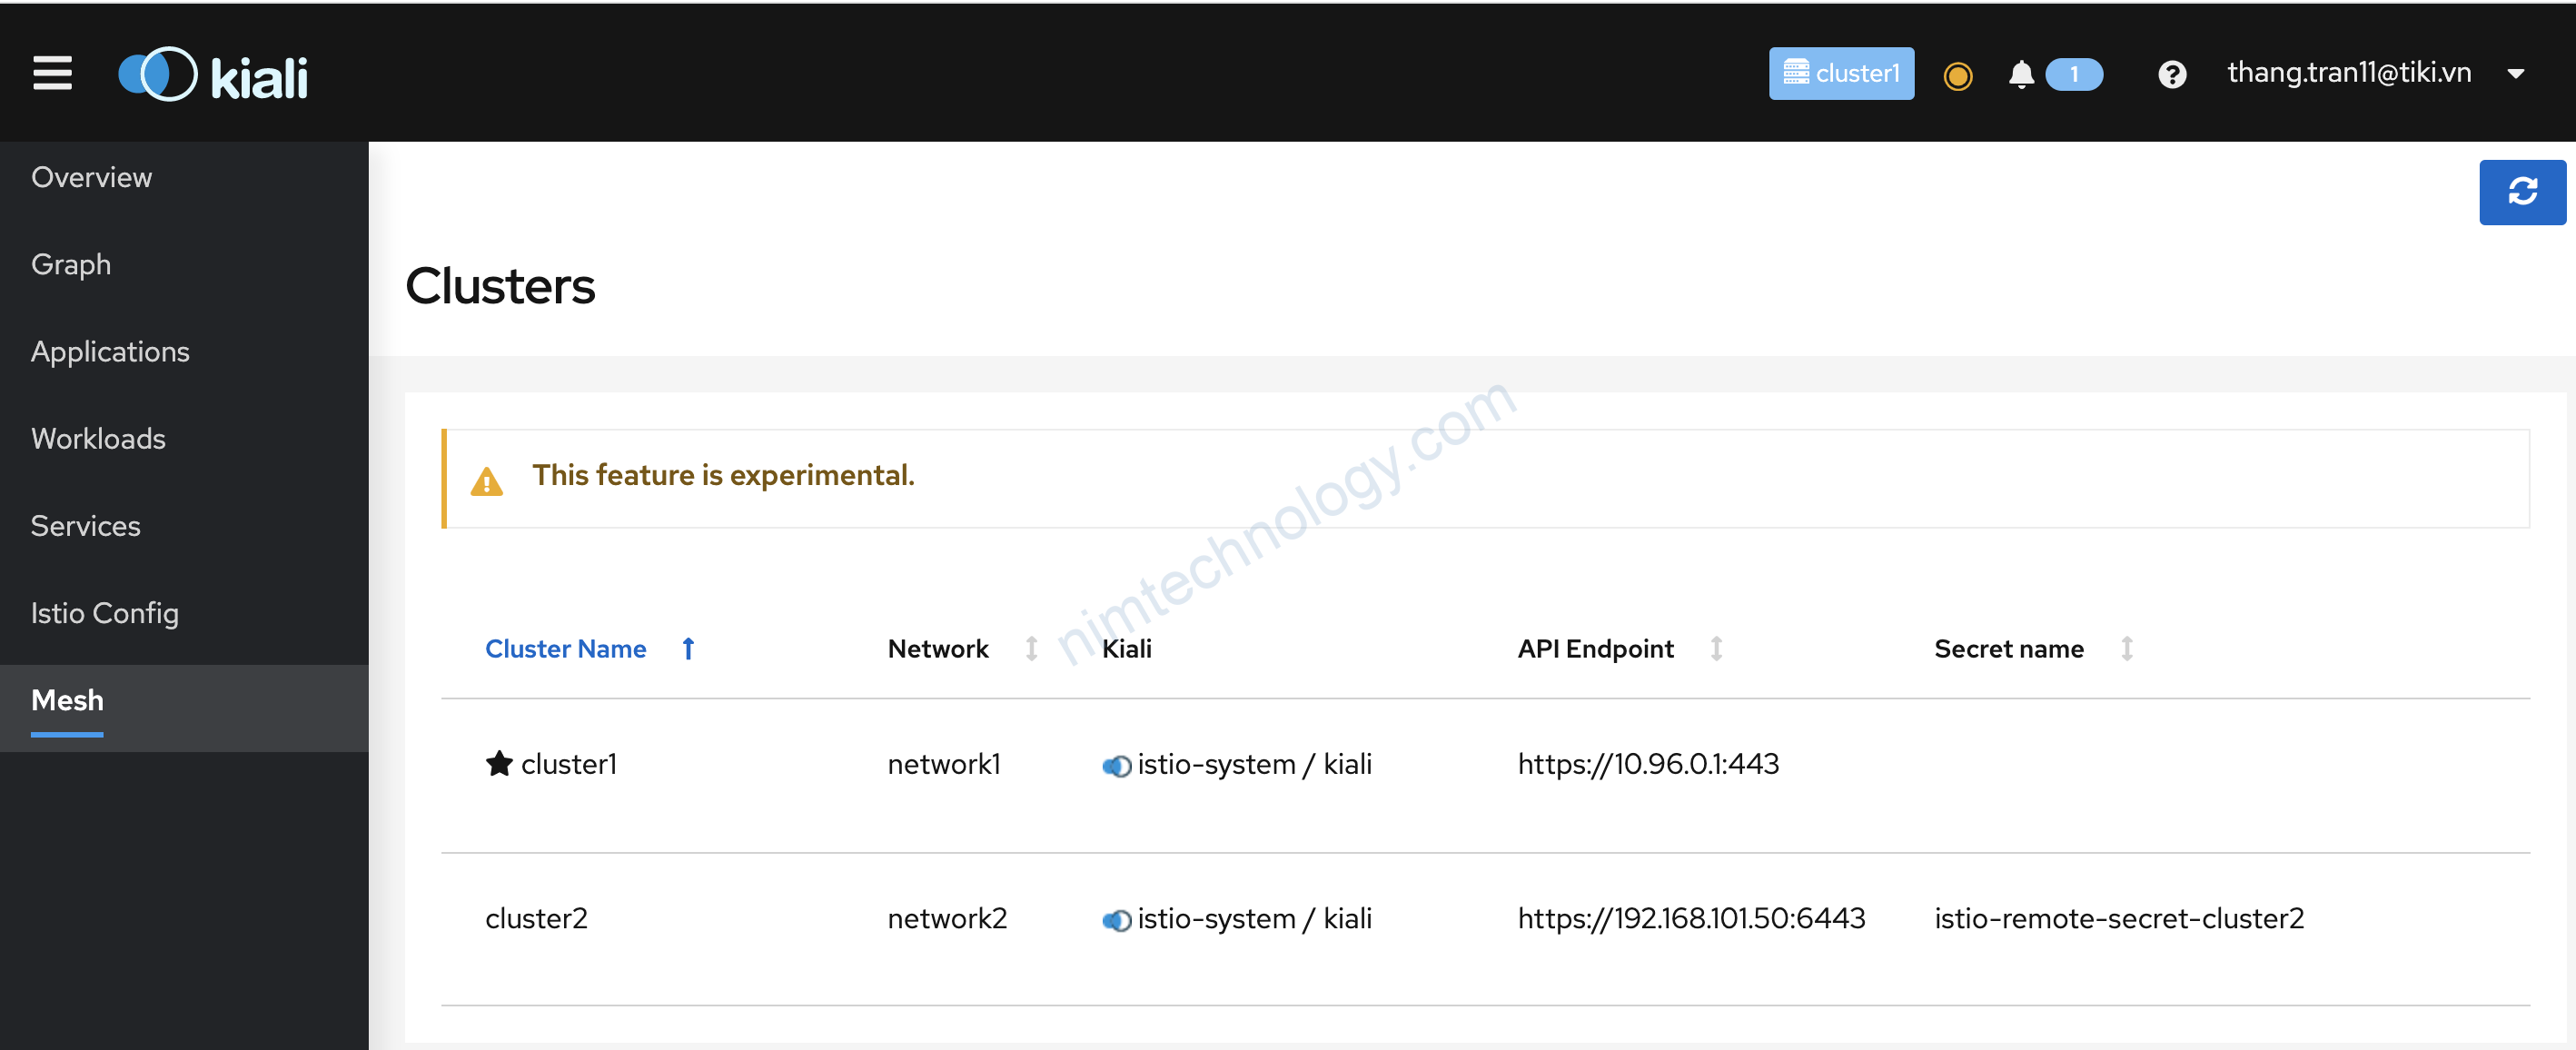
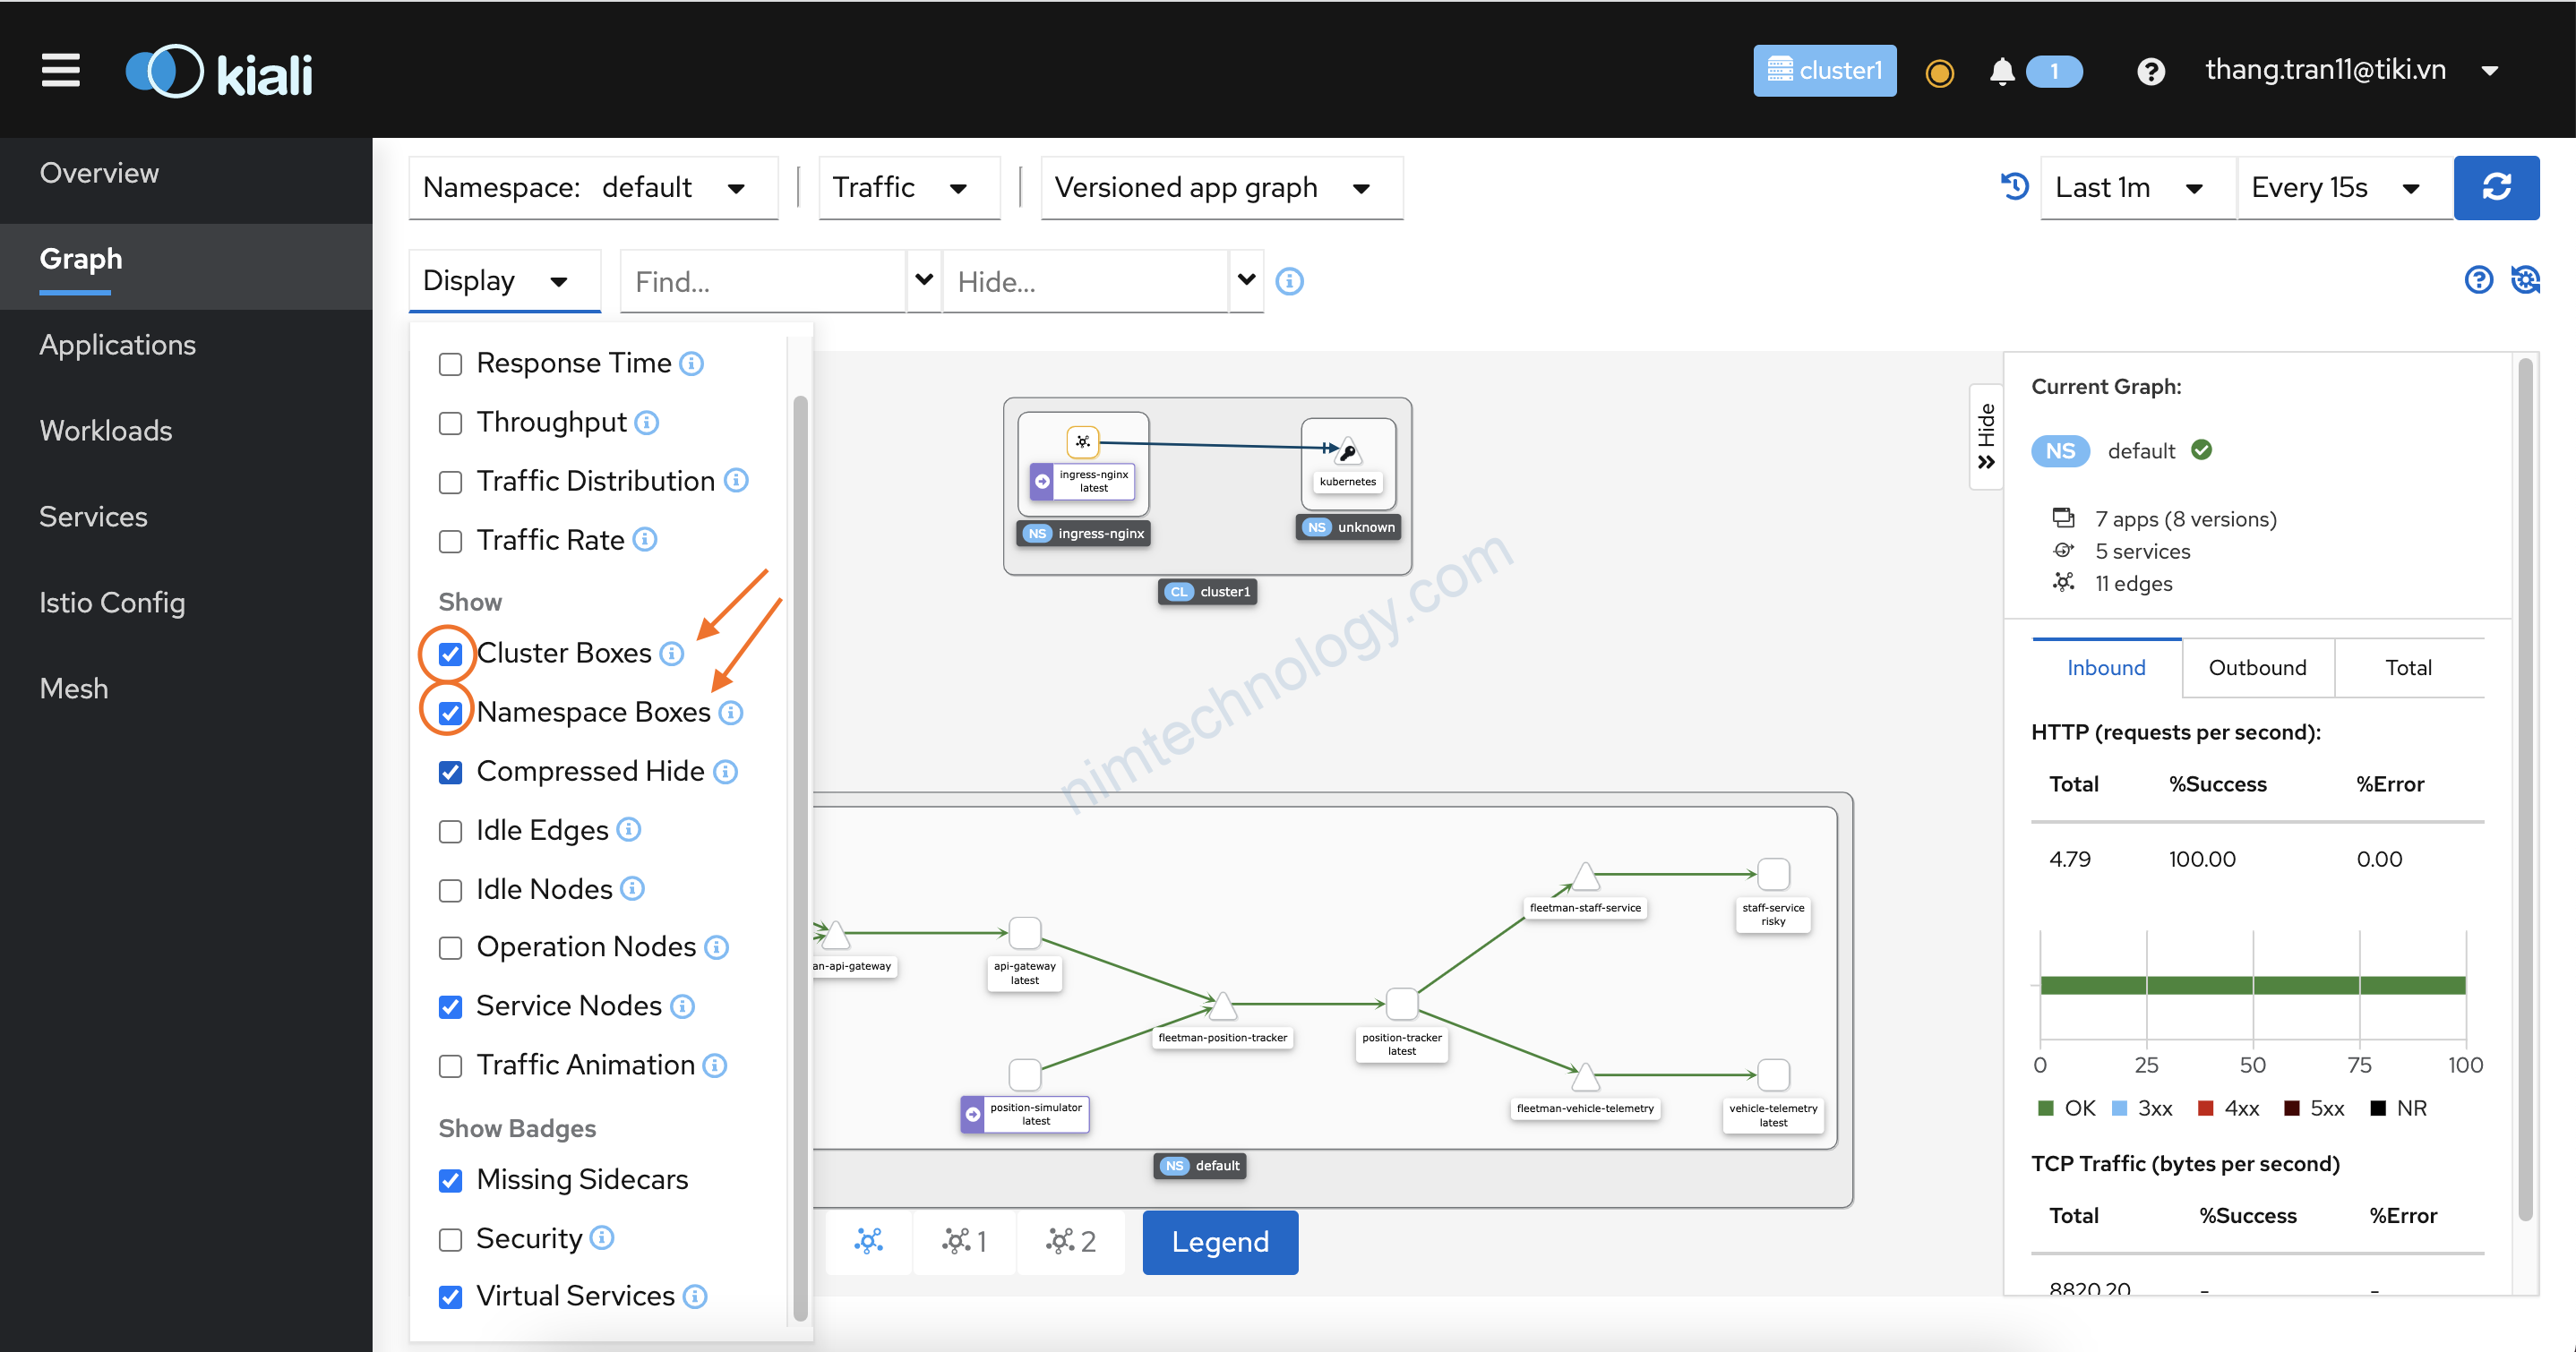
https://kiali.io/docs/features/multi-cluster/
các bạn có thể click vào links trên
https://karlstoney.com/2020/02/25/federated-prometheus-to-reduce-metric-cardinality/
https://karlstoney.com/2020/05/25/reduce-istio-sidecar-metric-cardinality/