Ờ bài này mình muốn tìn hiểu làm sao có thể view page để expose các metrics theo ý mình và sử dụng cho prometheus
Sau đây mình sẽ thực hiện write theo video.
1) Using Demo of Prometheus Client.
Đầu tiên chúng ta sẽ expose default golang metrics.
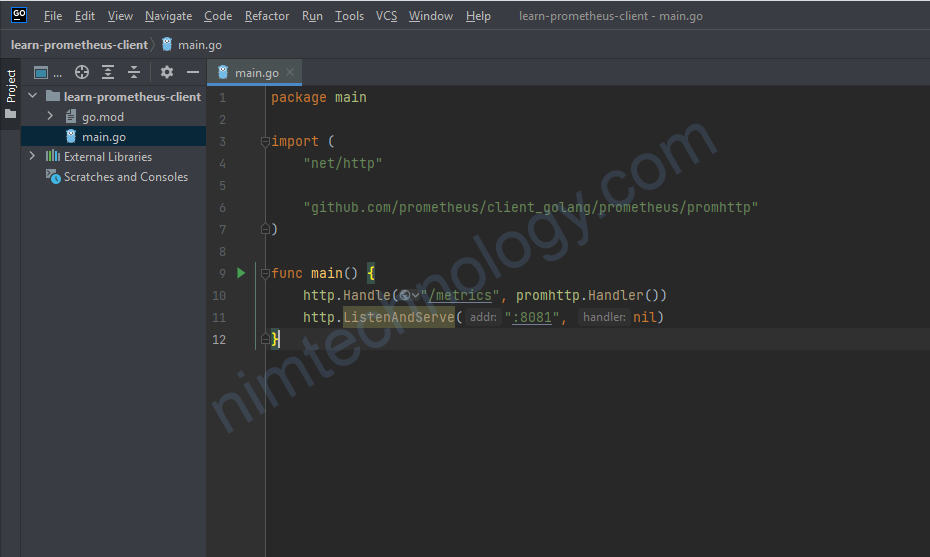
file: main.go
package main

import (
    "net/http"

    "github.com/prometheus/client_golang/prometheus/promhttp"
)

func main() {
    http.Handle("/metrics", promhttp.Handler())
    http.ListenAndServe(":8081", nil)
}
Bạn start chúng lên. và access browser http://localhost:8081/metrics
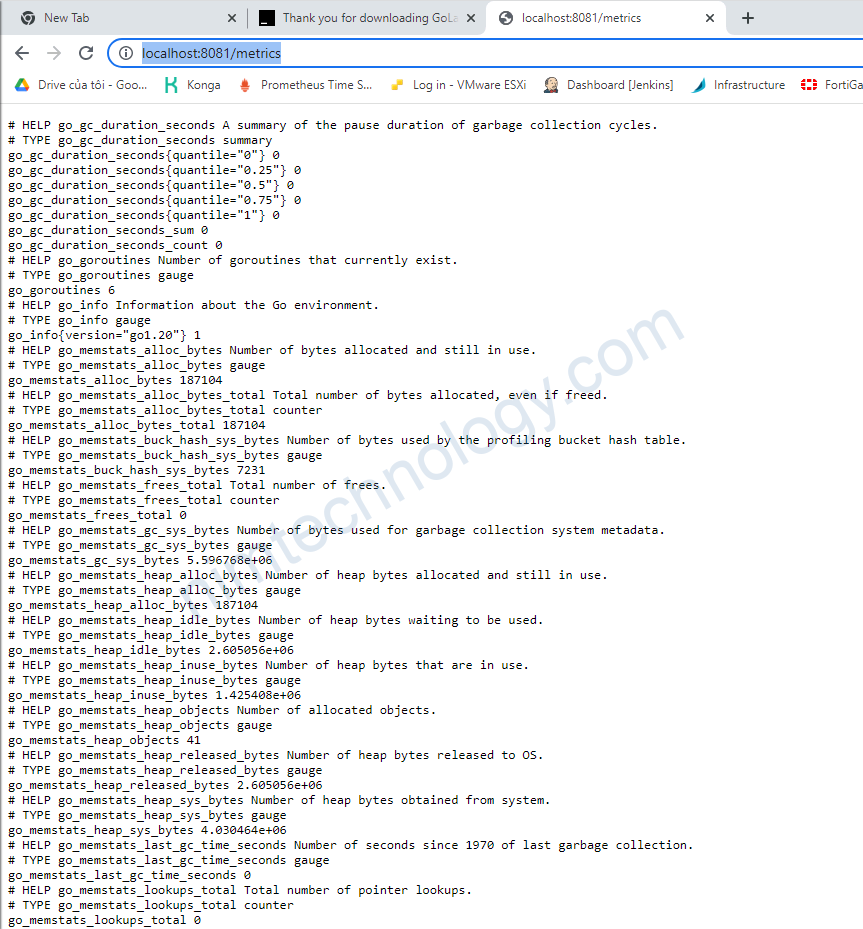
Bạn sẽ được 1 page như này.
và chúng ta sẽ không dừ ở đây. vì chúng ta cần tạo ra custom metrics according to ý chúng ta
Gauge
Nó sẽ biểu một giá trị số duy nhất mà nó có thể up hoặc down. Bạn có thể dùng do lường memory or cpu usage.
We’ll use it to keep track of the number of connected hardware devices to our app
main.go
Tạo 1 struct để và represent the hardware device. nó bao gồm ID, Mac và Firmware.
type Device struct {
    ID       int    `json:"id"`
    Mac      string `json:"mac"`
    Firmware string `json:"firmware"`
}
Khai báo 1 silde of devices as gobal variable to hold tất cả các deviced đã connected
main.go
var dvs []Device
Using special init() function để tạo 1 cặp devices.
main.go
func init() {
    dvs = []Device{
        {1, "5F-33-CC-1F-43-82", "2.1.6"},
        {2, "EF-2B-C4-F5-D6-34", "2.1.6"},
    }
}
Giờ tạo 1 http handler function để return tất cả các connected devices to code của bạn.
main.go
func getDevices(w http.ResponseWriter, r *http.Request) {
b, err := json.Marshal(dvs)
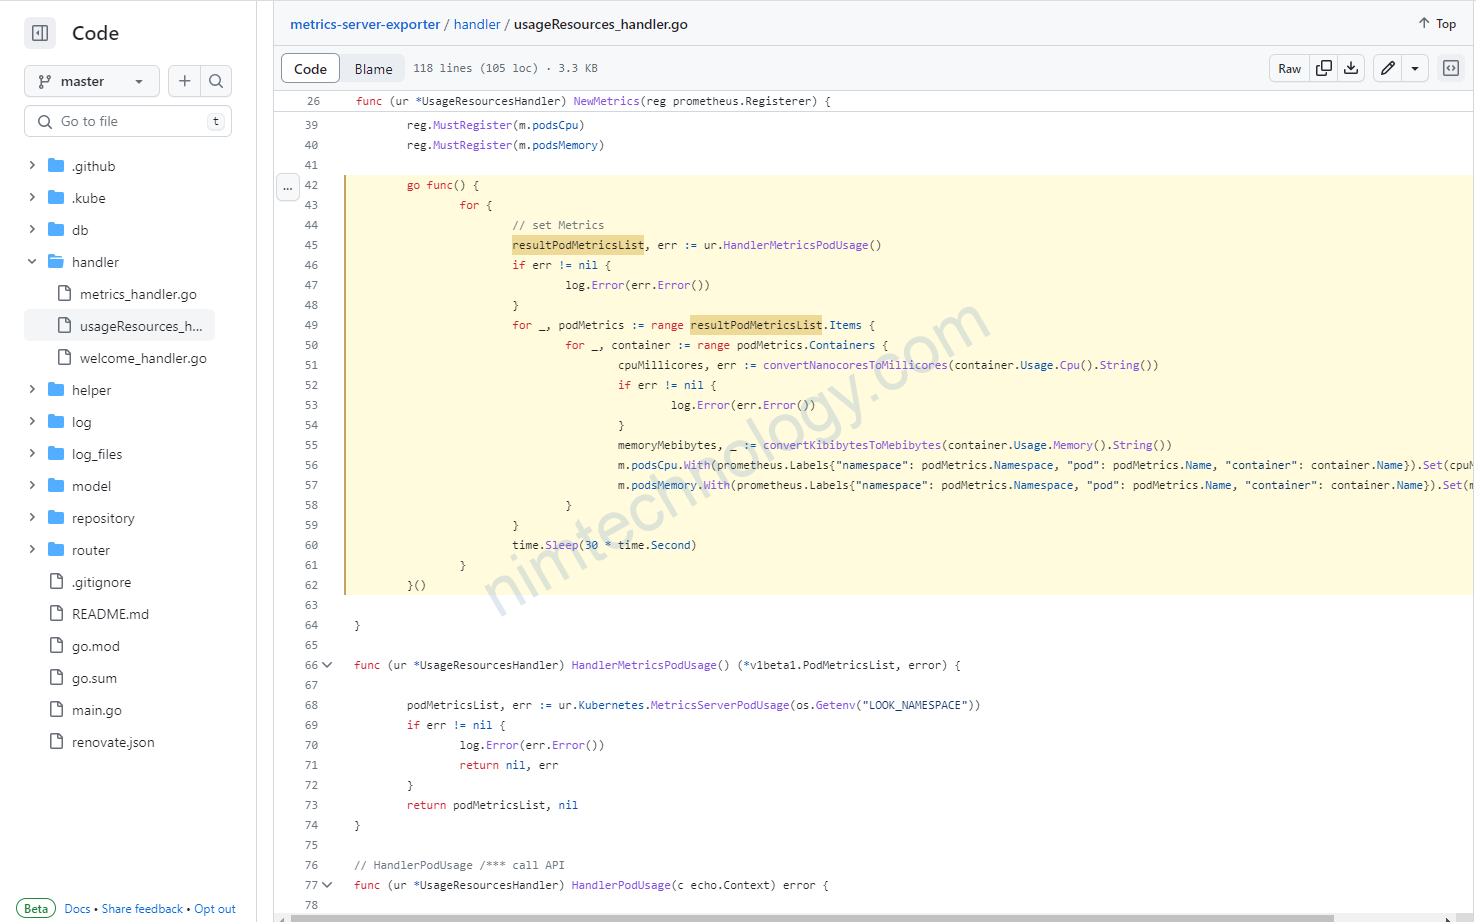
if err != nil {
http.Error(w, err.Error(), http.StatusBadRequest)
return
}
w.Header().Set("Content-Type", "application/json")
w.WriteHeader(http.StatusOK)
w.Write(b)
}
Chúng ta sẽ tạo 1 new enpoids mới là /devices and use getDevices function.
main.go
func main() {
    http.Handle("/metrics", promhttp.Handler())
    http.HandleFunc("/devices", getDevices) ###<<<=== look at
    http.ListenAndServe(":8081", nil)
}
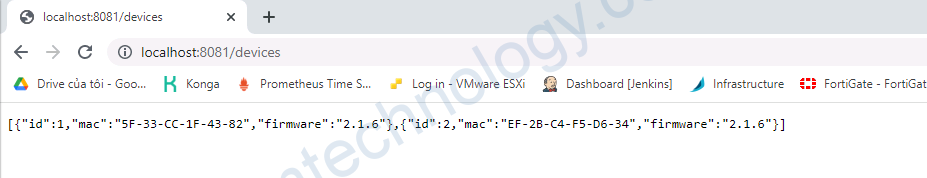
Hoặc curl
curl -i localhost:8081/devices

HTTP/1.1 200 OK
Content-Type: application/json
Date: Thu, 01 Dec 2022 12:11:30 GMT
Content-Length: 109

[{"id":1,"mac":"5F-33-CC-1F-43-82","firmware":"2.1.6"},{"id":2,"mac":"EF-2B-C4-F5-D6-34","firmware":"2.1.6"}]
Tạo struct là metrics sau đó set devices property to prometheus.Gauge. Bạn có thể thấy là bạn có thể sử dụng Gauge or a GaugeVec. Sự khác biệt khá đơn giản:
+ Gauge represents a single numerical value
+ GaugeVec is a collection that bundles a set of Gauges with the same name but different labels.
trong ví dụ, nếu chúng ta muốn count all connected devices và không care about the different types, thì sử dụng Gause và cách khác nếu bạn có sự khác nhau về device types, such as routers, switches, and access points. và bạn muốn count chúng một cách riêng biệt bạn sử dụng GaugeVec with a type label
main.go
type metrics struct {
    devices prometheus.Gauge
}
Then create a NewMetrics function that defines metrics. It accepts the prometheus register and returns the pointer to the metrics struct.
- We need to create
devicesmetric using theNewGaugefunction. - A
Namespaceis just a metric prefix; usually, you use a single word that matches the name of your app. In my case, it’smyapp. - Then the metric
Name. It’s very important to follow the naming conventions provided by Prometheus. You can find it on the official website. Let’s call itconnected_devices. - You also need to include a metric description.
- Then register it with the prometheus registry and return a pointer.
main.go
func NewMetrics(reg prometheus.Registerer) *metrics {
    m := &metrics{
        devices: prometheus.NewGauge(prometheus.GaugeOpts{
            Namespace: "myapp",
            Name:      "connected_devices",
            Help:      "Number of currently connected devices.",
        }),
    }
    reg.MustRegister(m.devices)
    return m
}
- In the
main()function, create a non-global registry without any pre-registeredCollectors. - Then create metrics using the
NewMetricsfunction. - Now we can use the
devicesproperty of the metrics struct and set it to the current number of connected devices. For that, we simply set it to the number of items in the devices slice. - Let’s also create a custom prometheus handler with the newly created register.
- We also need to update the
/metricshandler topromHandler.
main.go
func main() {
    #add them
    reg := prometheus.NewRegistry()
    m := NewMetrics(reg)

    m.devices.Set(float64(len(dvs)))

    promHandler := promhttp.HandlerFor(reg, promhttp.HandlerOpts{})
    #end add them

    http.Handle("/metrics", promHandler) #<<<< look at promHandler
    http.HandleFunc("/devices", getDevices)
    http.ListenAndServe(":8081", nil)
}
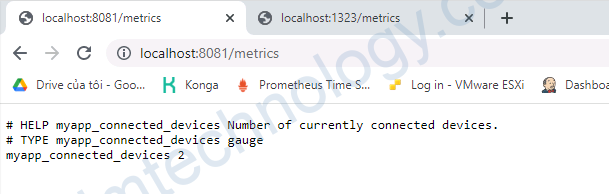
Khi bạn curl thì bạn chỉ thấy metrics về devices connected.
curl localhost:8081/metrics

# HELP myapp_connected_devices Number of currently connected devices.
# TYPE myapp_connected_devices gauge
myapp_connected_devices 2
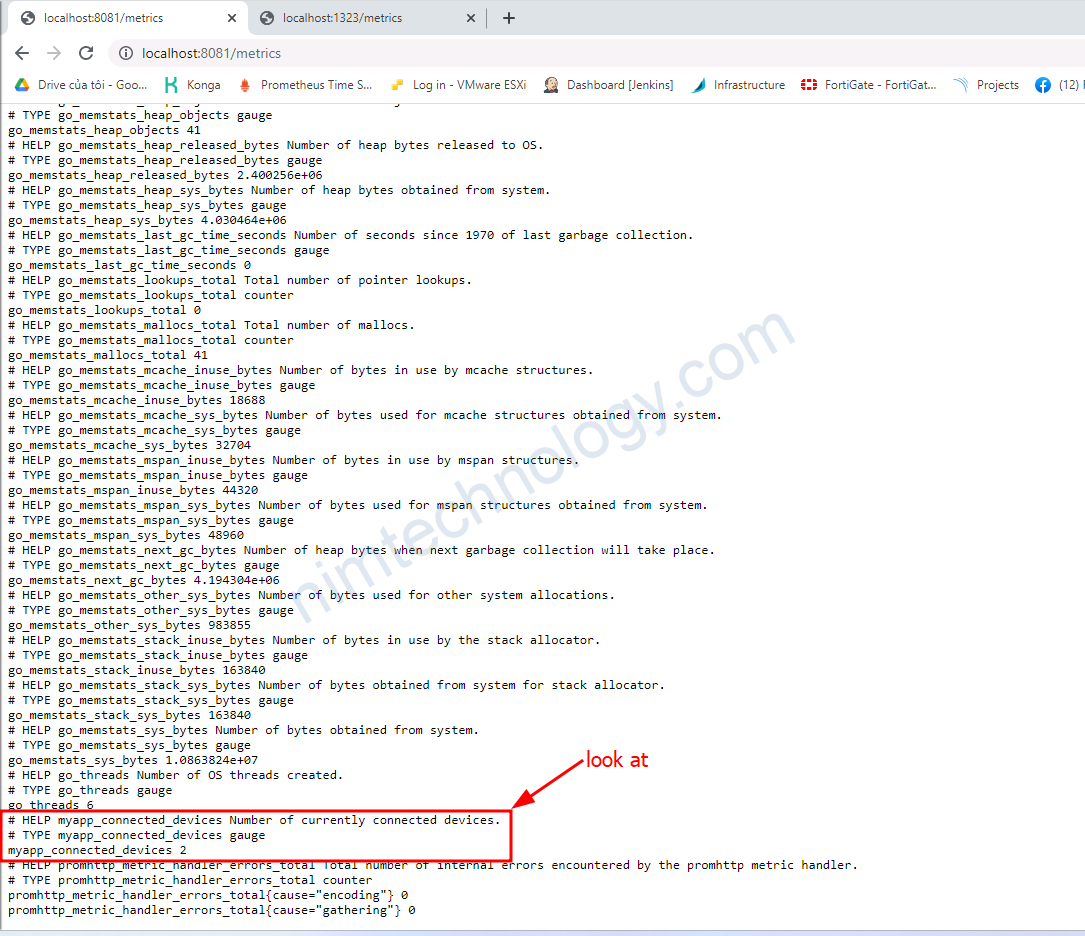
keep all the golang default metrics
Optionally, if you still want to keep all the golang default metrics, you can use a built-in collector to register it with the custom Prometheus register.
Also, you can expose the prometheus handler metric as well by adding setting the Registry field.
main.go
func main() {
    reg := prometheus.NewRegistry()
    reg.MustRegister(collectors.NewGoCollector()) #<<<< look at
    m := NewMetrics(reg)

    m.devices.Set(float64(len(dvs)))

    promHandler := promhttp.HandlerFor(reg, promhttp.HandlerOpts{Registry: reg}) #<<<< look at

    http.Handle("/metrics", promHandler)
    http.HandleFunc("/devices", getDevices)
    http.ListenAndServe(":8081", nil)
}
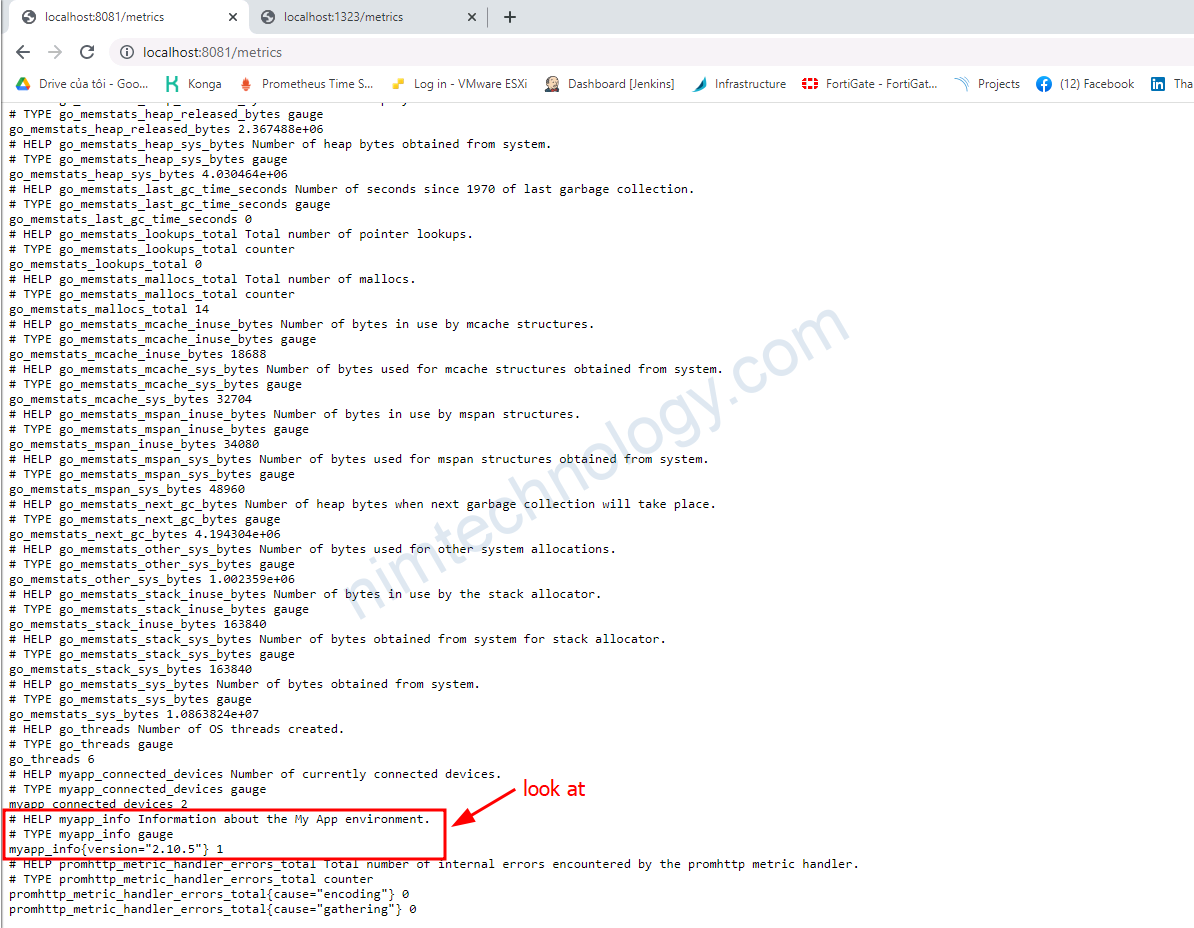
GaugeVec
tiếp theo info metric sẽ represent the metadata of the app. You can expose any number of arbitrary key-value pairs from your application. As an example, we’ll expose the version of the currently running app.
Lần nay thì chúng ta sử dụng GaugeVec type since we need to set a version label with the actual version of the application.
main.go
type metrics struct {
    devices prometheus.Gauge
    info    *prometheus.GaugeVec
}
- Let’s declare
infometric usingNewGaugeVecfunction. - All the metrics will get the same
Namespacewith the name of the app. - Using the same naming convention, let’s call it
infoas well and give it a description. - Don’t forget to register it using
MustRegisterfunction.
main.go
func NewMetrics(reg prometheus.Registerer) *metrics {
    m := &metrics{
        devices: prometheus.NewGauge(prometheus.GaugeOpts{
            Namespace: "myapp",
            Name:      "connected_devices",
            Help:      "Number of currently connected devices.",
        }),
        ###add them
        info: prometheus.NewGaugeVec(prometheus.GaugeOpts{
            Namespace: "myapp",
            Name:      "info",
            Help:      "Information about the My App environment.",
        },
            []string{"version"}),
        ###end add them
    }
    reg.MustRegister(m.devices, m.info) #<<<< look at
    return m
}
Khai báo a golbal version varibale.
var version string
Typically this variable will be set using the environment variable or by your CI tool. For the demo, let’s just hardcode it in the init() function.
main.go
func init() {
    version = "2.10.5" #<<<< look at

    dvs = []Device{
        {1, "5F-33-CC-1F-43-82", "2.1.6"},
        {2, "EF-2B-C4-F5-D6-34", "2.1.6"},
    }
}
Then in the main() function, we can use the version Prometheus label to set the application version and use a constant value of 1. If you check the default golang info metric, it uses the same convention.
main.go
func main() {
    reg := prometheus.NewRegistry()
    m := NewMetrics(reg)

    m.devices.Set(float64(len(dvs)))
    m.info.With(prometheus.Labels{"version": version}).Set(1) #<<<< look at

    promHandler := promhttp.HandlerFor(reg, promhttp.HandlerOpts{})

    http.Handle("/metrics", promHandler)
    http.HandleFunc("/devices", getDevices)
    http.ListenAndServe(":8081", nil)
}
Khi curl
curl localhost:8081/metrics

...
# HELP myapp_info Information about the My App environment.
# TYPE myapp_info gauge
myapp_info{version="2.10.5"} 1
Sau khi code và apply vào hệ thống thì mình nhận ra 1 điều là trang này nó sẽ không tự động cập nhật các metrics mà mình tự custom.
Cho dù mình refesh page hay F5 cỡ mấy thì value cũng không được làm mới.
sau đó thì mình tìm hiểu tiếp.
Sau khi mình soi lại code thì mình thấy là các giá trị chỉ được set 1 lần khi mà file main. go chạy và nó sẽ chạy function: m := NewMetrics(reg)
==> suy ra một điều là nếu bạn muốn value luôn được cập nhật thì bạn cần phải tạo ra action nào đó để set giá trị mới vào
Mình soi tiếp bài viết thì mình thấy:
https://antonputra.com/monitoring/monitor-golang-with-prometheus/#gauge
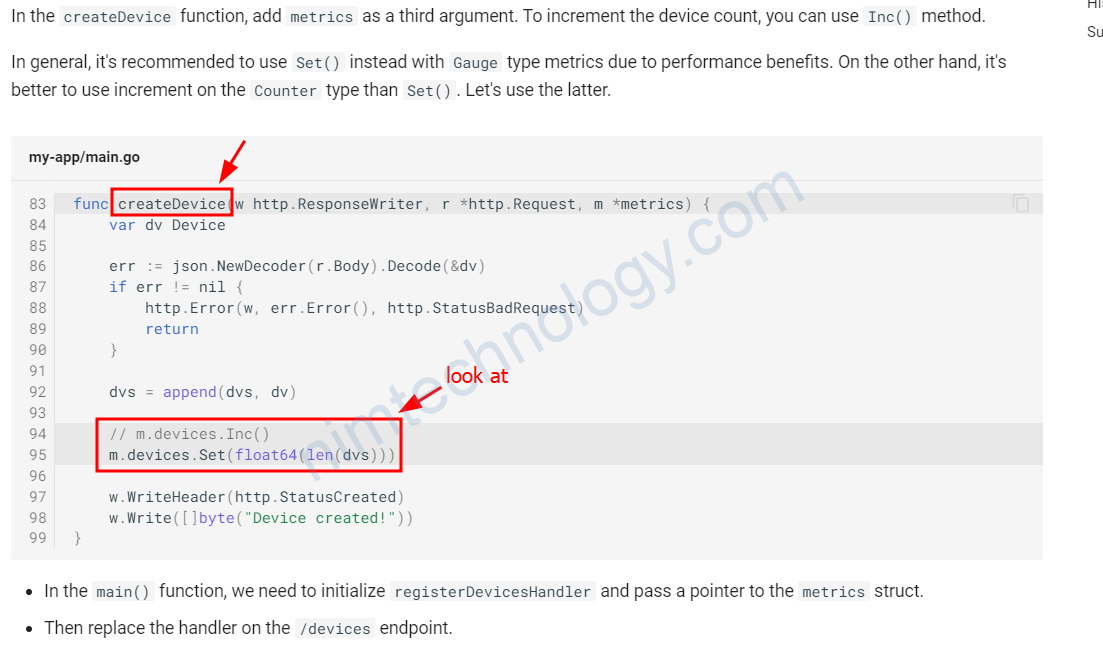
Khi một thiết bị mới nó connect vào thì ông sẽ gọi hàm createDevice nó set số mới vào trong page /metrics
Trong bài toán của mình thì mình đang draw data từ k8s nên mình Go Func