Install ActiveMQ Artemis on Kubernetes.
Bạn tham khảo helm chart sau:
https://artifacthub.io/packages/helm/activemq-helm-chart/active-mq
Add repository
helm repo add activemq-helm-chart https://underndog.github.io/activemq-helm-chartInstall chart
helm install my-active-mq activemq-helm-chart/active-mq --version 1.2.1Edit Heap Size in ActiveMQ Container
When Artemis is under heavy load, it creates and destroys many objects quickly. Without enough memory, this leads to frequent garbage collection, causing pauses and performance degradation. Proper memory settings ensure smooth operation even during peak loads.
VM tuning for ActiveMQ Artemis is primarily about providing adequate memory. Ensure your JVM has 5x the memory of your broker’s global-max-size, and set your minimum and maximum heap sizes to the same value. This, combined with the latest Java version, will give you the best foundation for performance.The most important command-line arguments to add when starting Artemis would be:
-Xms<SIZE>G -Xmx<SIZE>GWhere <SIZE> is at least 5 times your broker’s global-max-size in GB.
Như ở đây mình set là
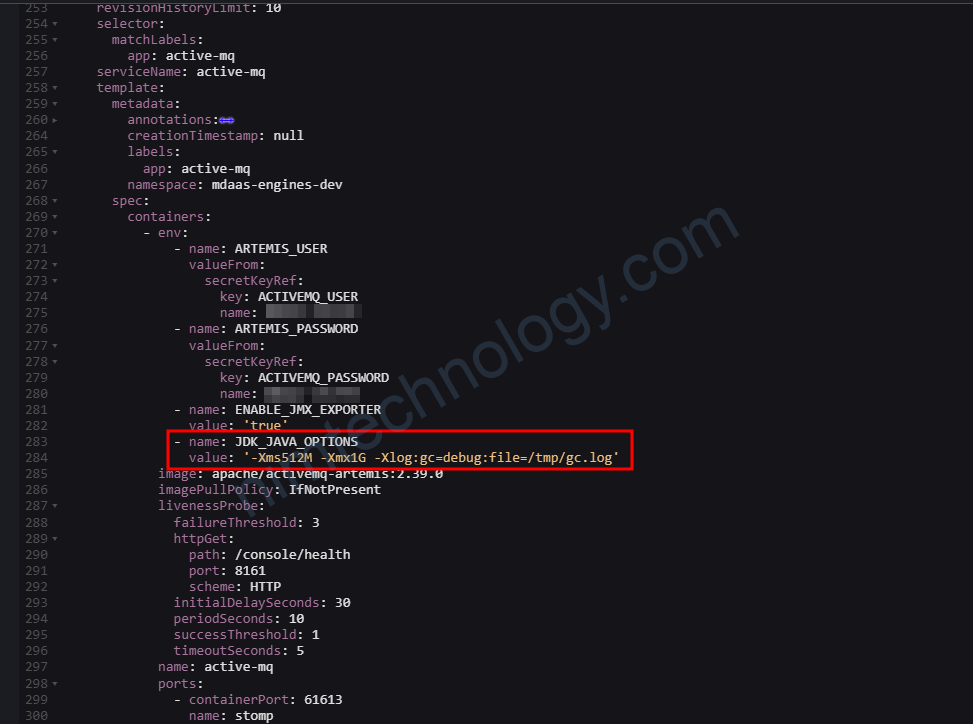
- name: JDK_JAVA_OPTIONS
  value: '-Xms512M -Xmx1G -Xlog:gc=debug:file=/tmp/gc.log'
https://github.com/apache/activemq-artemis/tree/main/artemis-image/examples
Và làm sao để chúng ta verify heap size đã ăn chưa
artemis@active-mq-0:/var/lib/artemis-instance$ java -XX:+PrintFlagsFinal -version | grep -i heap
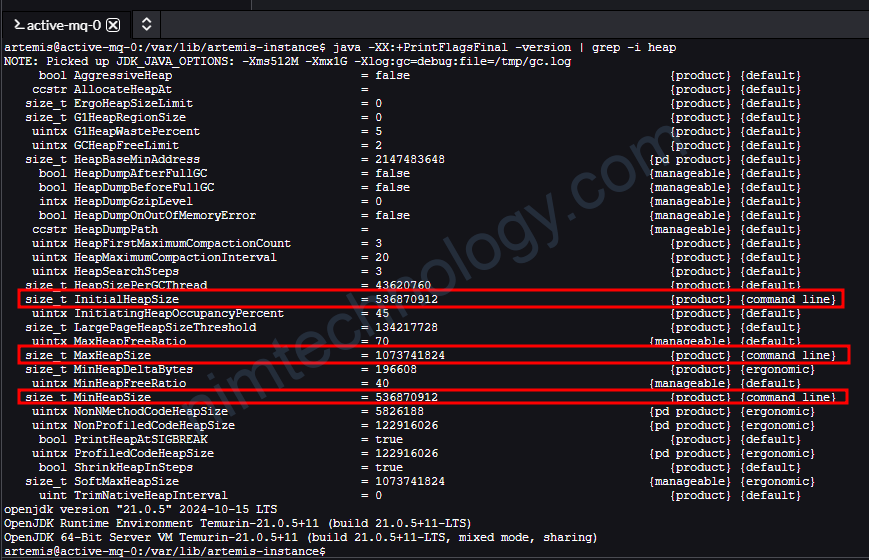
Nếu bạn thấy các thông số này tường ứng với setup của các bạn thì nó ăn rồi nhé.
G1 Garbage Collector
Configure log G1 Garbage Collector in artemis
[0.004s][info][gc] Using G1
[0.041s][debug][gc] ConcGCThreads: 1 offset 2
[0.041s][debug][gc] ParallelGCThreads: 1
[0.041s][debug][gc] Initialize mark stack with 4096 chunks, maximum 524288
[4.863s][info ][gc] GC(0) Pause Young (Normal) (G1 Evacuation Pause) 25M->6M(513M) 21.213ms
[7.591s][info ][gc] GC(1) Pause Young (Normal) (G1 Evacuation Pause) 27M->9M(513M) 41.444ms
[12.271s][info ][gc] GC(2) Pause Young (Normal) (G1 Evacuation Pause) 31M->12M(513M) 104.975ms
[12.662s][info ][gc] GC(3) Pause Young (Concurrent Start) (Metadata GC Threshold) 14M->11M(513M) 11.612ms
[12.662s][info ][gc] GC(4) Concurrent Mark Cycle
[12.962s][info ][gc] GC(4) Pause Remark 12M->12M(512M) 20.801ms
[12.977s][info ][gc] GC(4) Pause Cleanup 13M->13M(512M) 0.197ms
[13.050s][info ][gc] GC(4) Concurrent Mark Cycle 387.443ms
[16.459s][info ][gc] GC(5) Pause Young (Prepare Mixed) (G1 Evacuation Pause) 36M->14M(512M) 13.762ms
[22.862s][info ][gc] GC(6) Pause Young (Mixed) (G1 Evacuation Pause) 37M->16M(512M) 100.253ms
[24.841s][info ][gc] GC(7) Pause Young (Concurrent Start) (Metadata GC Threshold) 31M->18M(512M) 100.354ms
[24.841s][info ][gc] GC(8) Concurrent Mark Cycle
[25.054s][info ][gc] GC(8) Pause Remark 19M->19M(512M) 11.215ms
[25.247s][info ][gc] GC(8) Pause Cleanup 19M->19M(512M) 0.716ms
[25.249s][info ][gc] GC(8) Concurrent Mark Cycle 407.150ms
[35.251s][info ][gc] GC(9) Pause Young (Prepare Mixed) (G1 Evacuation Pause) 41M->21M(512M) 89.117ms
Interpreting G1 Garbage Collector (GC) logs is essential for understanding the JVM’s memory management and optimizing application performance. Let’s analyze the provided GC log entries:
Timestamp: The time elapsed since the JVM started. For example, [4.863s] indicates the event occurred 4.863 seconds after startup.
Log Level: Indicates the severity or nature of the log message, such as [info] or [debug].
GC Phase: Specifies the garbage collection phase or event, like Pause Young (Normal) or Concurrent Mark Cycle.
Heap Usage: Shows memory usage before and after GC, formatted as before->after(total). For instance, 25M->6M(513M) means the heap usage reduced from 25MB to 6MB out of a total 513MB.
Duration: The time taken to complete the GC event, e.g., 21.213ms.
Detailed Breakdown of Notable Entries:
Initialization:
[0.004s][info][gc] Using G1
[0.041s][debug][gc] ConcGCThreads: 1 offset 2
[0.041s][debug][gc] ParallelGCThreads: 1
[0.041s][debug][gc] Initialize mark stack with 4096 chunks, maximum 524288
These entries indicate the JVM’s initialization of the G1 garbage collector, setting up concurrent and parallel GC threads, and preparing the mark stack.
Young Generation Collections (Evacuation Pauses):
[4.863s][info ][gc] GC(0) Pause Young (Normal) (G1 Evacuation Pause) 25M->6M(513M) 21.213ms
[7.591s][info ][gc] GC(1) Pause Young (Normal) (G1 Evacuation Pause) 27M->9M(513M) 41.444ms
[12.271s][info ][gc] GC(2) Pause Young (Normal) (G1 Evacuation Pause) 31M->12M(513M) 104.975ms
These logs represent pauses to collect the young generation (Eden and Survivor spaces). The term “Evacuation Pause” refers to moving live objects to new regions. For example, during GC(0), the heap usage decreased from 25MB to 6MB, taking 21.213ms. Dzone
Concurrent Marking Cycle:
[12.662s][info ][gc] GC(4) Concurrent Mark Cycle
[12.962s][info ][gc] GC(4) Pause Remark 12M->12M(512M) 20.801ms
[12.977s][info ][gc] GC(4) Pause Cleanup 13M->13M(512M) 0.197ms
[13.050s][info ][gc] GC(4) Concurrent Mark Cycle 387.443ms
Here, the G1 GC performs a concurrent marking cycle to identify live objects throughout the heap. The phases include: oracle
– Concurrent Mark Cycle: Runs concurrently with application threads to trace live objects.
– Pause Remark: A stop-the-world (STW) pause to finalize the marking, ensuring all live objects are accounted for.
– Pause Cleanup: Another STW pause to clean up and prepare for subsequent operations.
Adjusting Concurrent and Parallel GC Threads
Adjusting the number of concurrent and parallel garbage collection (GC) threads in the Java Virtual Machine (JVM) can significantly(đáng kể) influence(ảnh hưởng) application performance, particularly in environments with varying(thay đổi) CPU resources. Here’s how you can configure these settings:
1. Parallel GC Threads:
These threads handle tasks during stop-the-world (STW) phases of GC, such as copying live objects. To set the number of parallel GC threads, use:
-XX:ParallelGCThreads=<number>2. Concurrent GC Threads:
These threads manage concurrent phases of GC that run alongside(song hành) application threads, like marking live objects. To specify the number of concurrent GC threads, use:
-XX:ConcGCThreads=<number>Default Behavior:
If not explicitly set, the JVM determines the number of GC threads based on the system’s CPU count:
- ParallelGCThreads: On machines with up to 8 CPUs, the JVM uses one thread per CPU. For systems with more than 8 CPUs, it uses approximately 5/8 of the total CPU count. For example, on a 32-CPU machine, it would allocate around 23 parallel GC threads.GC easy – Universal Java GC Log Analyser
- ConcGCThreads: Calculated as
(ParallelGCThreads + 2) / 4. So, with 23 parallel GC threads, there would be about 6 concurrent GC threads.
Considerations for Adjustment:
- Performance Optimization: Increasing GC threads can reduce GC pause times but may lead to higher CPU usage, potentially affecting application performance.Stack Overflow
- Resource Contention: In environments where multiple JVMs run on the same machine, excessive(quá mức) GC threads can cause CPU contention(sự cạnh tranh).GC easy – Universal Java GC Log Analyser
Recommendations:
- Monitor and Analyze: Before making adjustments, analyze your application’s GC behavior using tools like GC logs or profilers to identify if thread counts are impacting performance.GC easy – Universal Java GC Log Analyser
- Incremental Changes: Modify thread counts gradually and observe the effects to avoid introducing new performance issues.
Adjust the log level settings in the Artemis console.
Để giải quyết vấn đề này, bạn cần định nghĩa thuộc tính “type” cho ThresholdFilter trong file cấu hình Log4j2 của bạn. Dưới đây là cách bạn có thể điều chỉnh file log4j2.properties để bao gồm một ThresholdFilter lọc bỏ các sự kiện log dưới mức INFO cho appender console:
# Console appender
appender.console.type=Console
appender.console.name=console
appender.console.layout.type=PatternLayout
appender.console.layout.pattern=%d %-5level [%logger] %msg%n
appender.console.filter.threshold.type=ThresholdFilter
appender.console.filter.threshold.level=INFO
In this configuration:
appender.console.filter.threshold.type=ThresholdFilterspecifies the type of filter being applied.appender.console.filter.threshold.level=INFOsets the threshold level toINFO, meaning that only log events at theINFOlevel or higher will be processed by the console appender.
Monitoring ActiveMQ:
Leveraging ActiveMQ’s Built-in Log Metrics
https://activemq.apache.org/components/artemis/documentation/latest/metrics.html
Cách này thì chúng ta cần chỉnh broker.xml
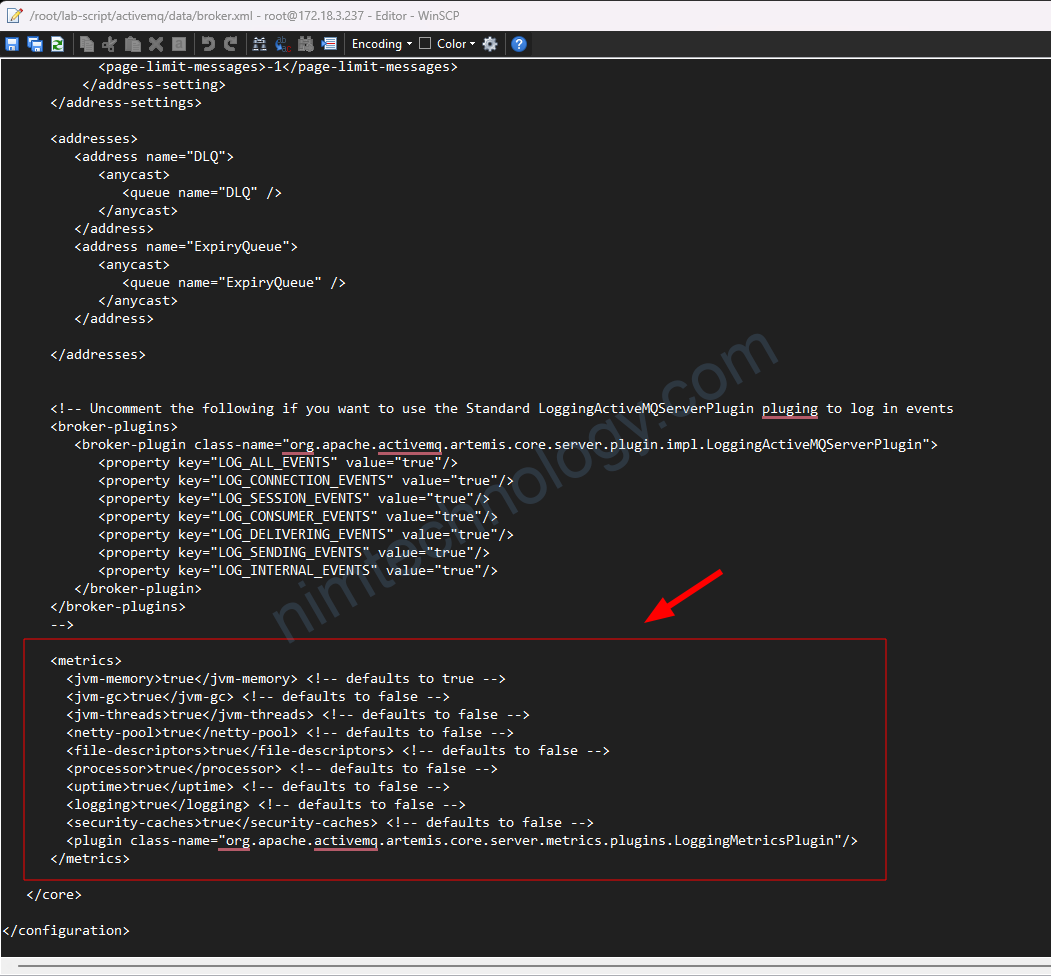
      <metrics>
        <jvm-memory>true</jvm-memory> <!-- defaults to true -->
	<jvm-gc>true</jvm-gc> <!-- defaults to false -->
	<jvm-threads>true</jvm-threads> <!-- defaults to false -->
	<netty-pool>true</netty-pool> <!-- defaults to false -->
	<file-descriptors>true</file-descriptors> <!-- defaults to false -->
	<processor>true</processor> <!-- defaults to false -->
	<uptime>true</uptime> <!-- defaults to false -->
	<logging>true</logging> <!-- defaults to false -->
	<security-caches>true</security-caches> <!-- defaults to false -->
        <plugin class-name="org.apache.activemq.artemis.core.server.metrics.plugins.LoggingMetricsPlugin"/>
      </metrics>

   </core>

</configuration>
Khi này bạn sẽ metrics sẽ hiện ở console log (stdout)

Và nó sẽ ghi vào file /var/lib/artemis-instance/log/artemis.log
Ngoài ra bạn cũng có thể filter log trên stdout chỉ hiện error bằng cách
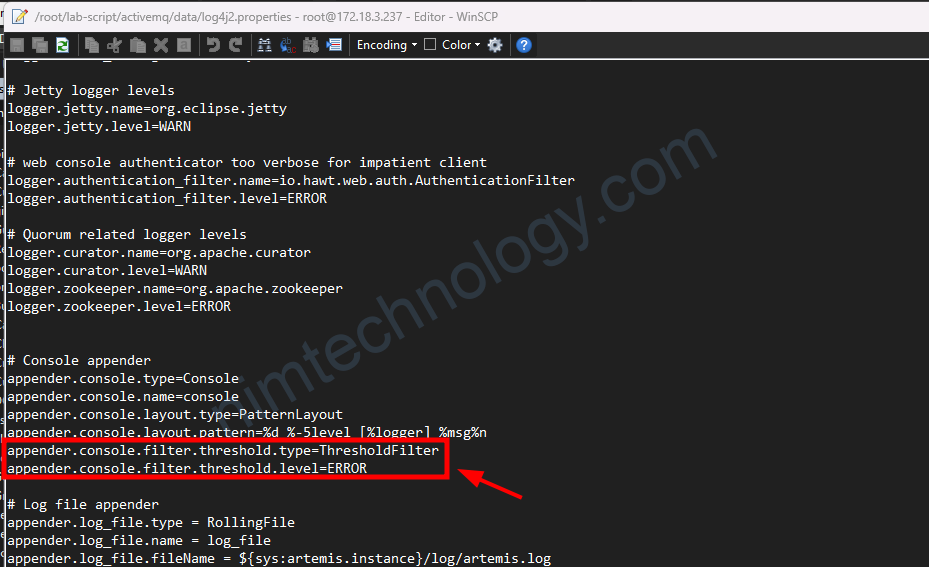
# Console appender
appender.console.type=Console
appender.console.name=console
appender.console.layout.type=PatternLayout
appender.console.layout.pattern=%d %-5level [%logger] %msg%n
appender.console.filter.threshold.type=ThresholdFilter
appender.console.filter.threshold.level=ERROR
Install rh-messaging/artemis-prometheus-metrics-plugin to export ActiveMQ metrics.
https://medium.com/@abdullah.eid.2604/activemq-artemis-prometheus-metrics-plugin-installation-on-ubuntu-linux-d2e8f4c0eeed
Nim có tham khảo cách trên và thực hiện build lại image để có thể cài rh-messaging/artemis-prometheus-metrics-plugin
# Use a specific version of the ActiveMQ Artemis base image
FROM apache/activemq-artemis:2.40.0
LABEL maintainer="Nimtechnology"

# Define versions as environment variables
ENV ARTEMIS_PROMETHEUS_METRICS_PLUGIN_VERSION=3.1.0
ENV JAVA_HOME=/opt/java/openjdk

# Switch to root to install necessary packages
USER root

# Install necessary packages
RUN apt-get update && \
    apt-get install -y git maven && \
    apt-get clean && \
    rm -rf /var/lib/apt/lists/*

# Clone the Prometheus Metrics Plugin repository
RUN git clone --branch v${ARTEMIS_PROMETHEUS_METRICS_PLUGIN_VERSION} https://github.com/rh-messaging/artemis-prometheus-metrics-plugin.git /opt/artemis-prometheus-metrics-plugin

# Build the plugin
RUN cd /opt/artemis-prometheus-metrics-plugin && mvn install
Tôi có thử build đã thử Build image trên và gặp lỗi
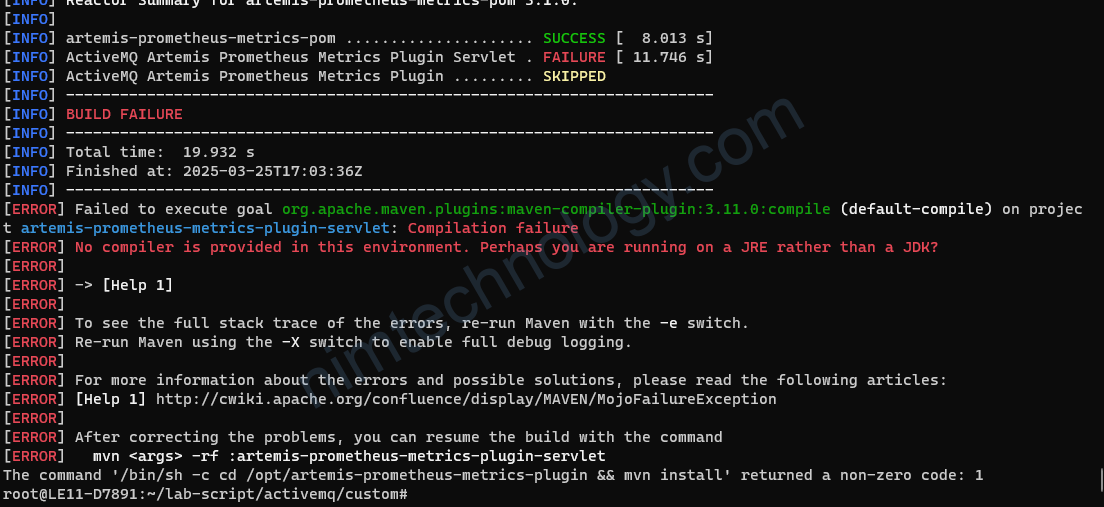
[ERROR] Failed to execute goal org.apache.maven.plugins:maven-compiler-plugin:3.11.0:compile (default-compile) on project artemis-prometheus-metrics-plugin-servlet: Compilation failure
[ERROR] No compiler is provided in this environment. Perhaps you are running on a JRE rather than a JDK?
[ERROR]
[ERROR] -> [Help 1]
[ERROR]
[ERROR] To see the full stack trace of the errors, re-run Maven with the -e switch.
[ERROR] Re-run Maven using the -X switch to enable full debug logging.
[ERROR]
[ERROR] For more information about the errors and possible solutions, please read the following articles:
[ERROR] [Help 1] http://cwiki.apache.org/confluence/display/MAVEN/MojoFailureException
[ERROR]
[ERROR] After correcting the problems, you can resume the build with the command
[ERROR]   mvn <args> -rf :artemis-prometheus-metrics-plugin-servlet
The command '/bin/sh -c cd /opt/artemis-prometheus-metrics-plugin && mvn install' returned a non-zero code: 1
Chúng ta hiện tại chưa thể cài rh-messaging/artemis-prometheus-metrics-plugin