
Mình cái trên ubuntu 20.04
https://www.elastic.co/guide/en/elasticsearch/reference/current/deb.html
1) Install Elasticsearch
wget -qO - https://artifacts.elastic.co/GPG-KEY-elasticsearch | sudo gpg --dearmor -o /usr/share/keyrings/elasticsearch-keyring.gpg
sudo apt-get install apt-transport-https
echo "deb [signed-by=/usr/share/keyrings/elasticsearch-keyring.gpg] https://artifacts.elastic.co/packages/8.x/apt stable main" | sudo tee /etc/apt/sources.list.d/elastic-8.x.list
sudo apt-get update && sudo apt-get install elasticsearch
sudo systemctl daemon-reload
sudo systemctl enable elasticsearch.service
sudo systemctl start elasticsearch.service
2) Recheck
2.1) Checking port opened
thấy port 9200 lên là ok
root@elastic1-u20:~# netstat -ntlpu
Active Internet connections (only servers)
Proto Recv-Q Send-Q Local Address           Foreign Address         State       PID/Program name
tcp        0      0 127.0.0.53:53           0.0.0.0:*               LISTEN      1002/systemd-resolv
tcp        0      0 0.0.0.0:22              0.0.0.0:*               LISTEN      1792/sshd: /usr/sbi
tcp6       0      0 127.0.0.1:9200          :::*                    LISTEN      26563/java
tcp6       0      0 ::1:9200                :::*                    LISTEN      26563/java
tcp6       0      0 127.0.0.1:9300          :::*                    LISTEN      26563/java
tcp6       0      0 ::1:9300                :::*                    LISTEN      26563/java
tcp6       0      0 :::22                   :::*                    LISTEN      1792/sshd: /usr/sbi
udp        0      0 127.0.0.53:53           0.0.0.0:*                           1002/systemd-resolv
2.2) check status
Kiểm tra sem cài đã ngon nghẻ chưa?
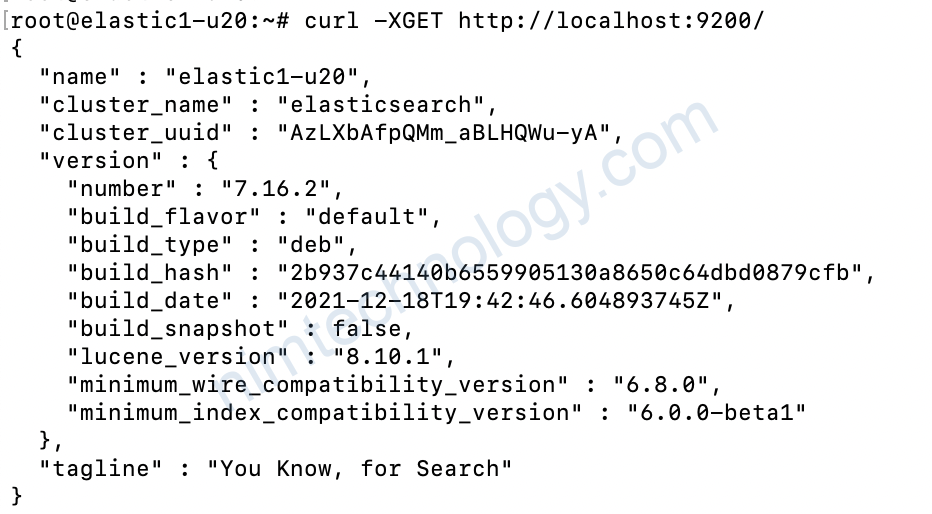
curl -XGET http://localhost:9200/
curl -XGET http://localhost:9200/_cluster/health?pretty
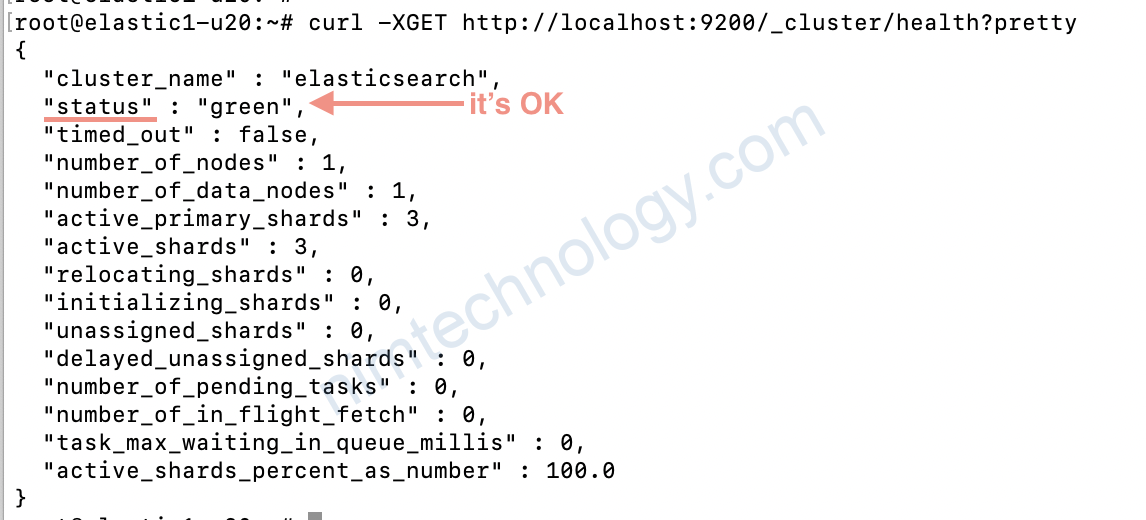
Những điểm cần lưu ý:
status:
– green: là ok
– yellow là warning
– red là Not OK -> elastic của bạn died rồi.
number_of_nodes: trong cluster elastic hiện tại có bao nhiêu node?
number_of_data_nodes: số node chưa data
relocating_shards: đang say ra sự sắp xếp dữ liệu, khi 1 node nào đó bị die
unassigned_shards: có shard nào đó đang bị lỗi và cần rebuild lại.
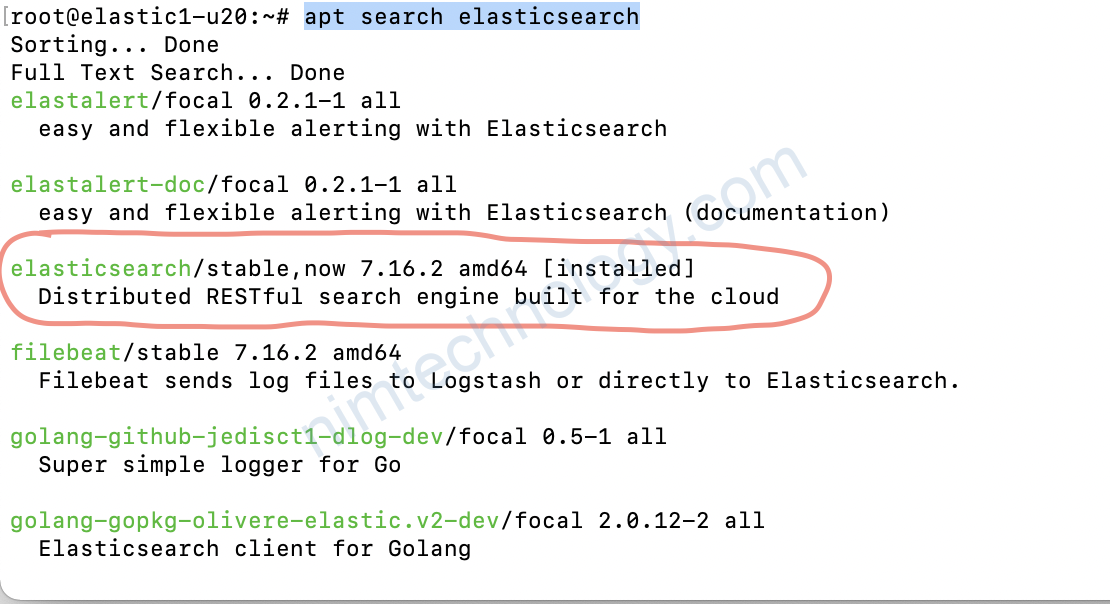
2.3) check version
Kiểm tra phiên bản nào là mới nhất thời điểm hiện tại.apt search elasticsearch
3) Config
làm sao để biết config của elastic ở đâu:cat /lib/systemd/system/elasticsearch.service
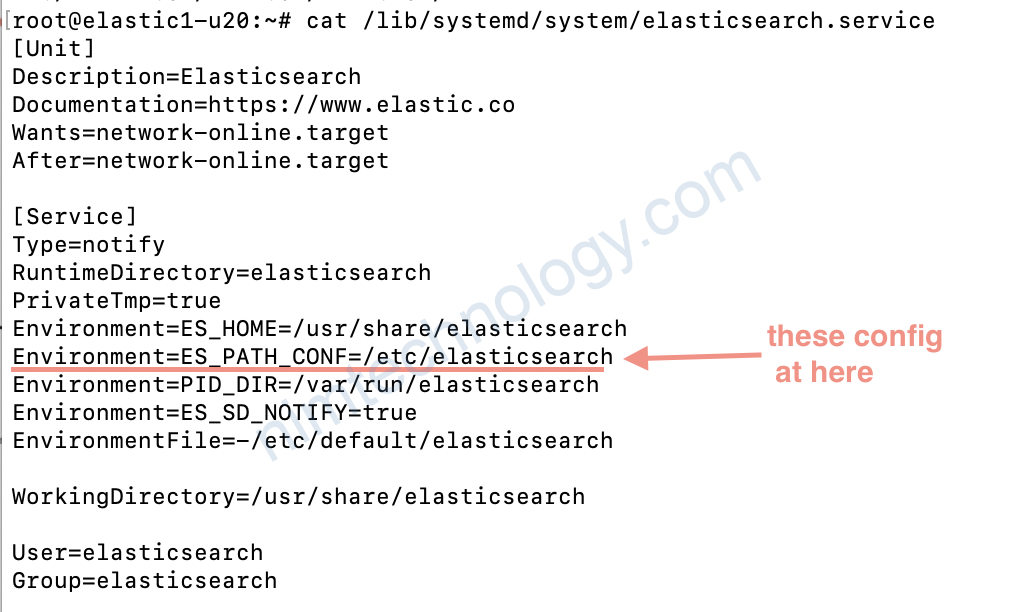
cd /etc/elasticsearch/
ll
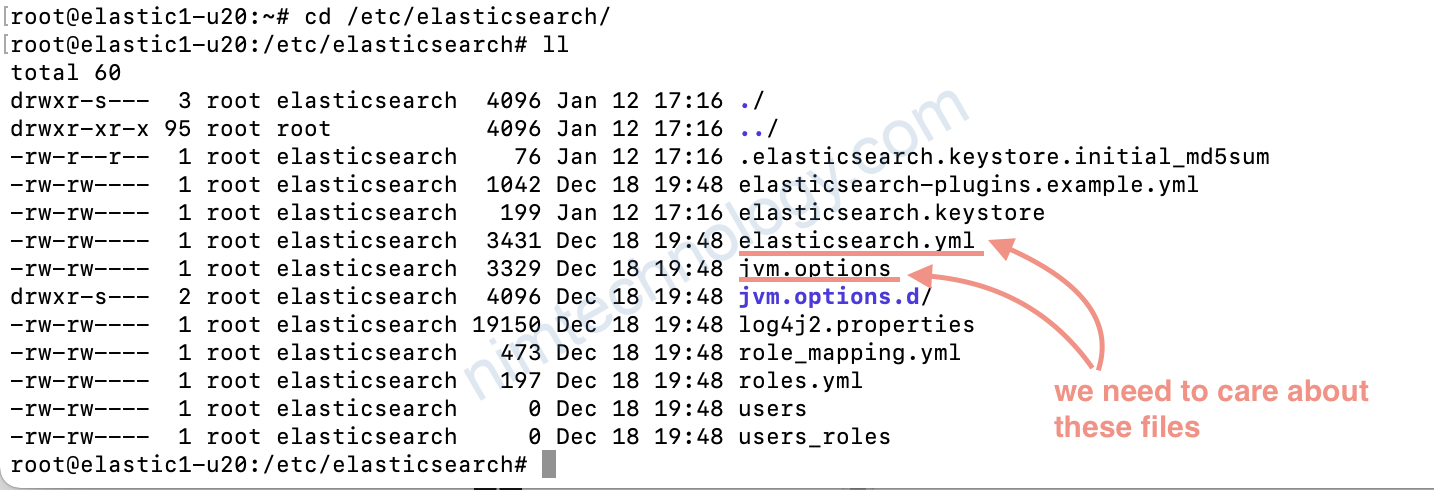
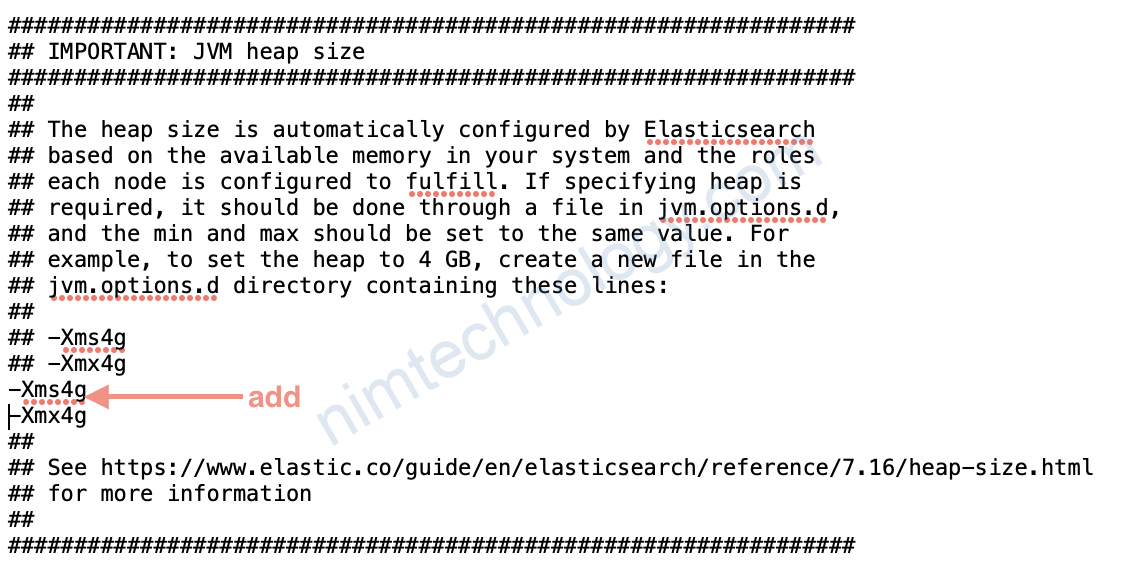
3.1) Config Ram usage
Bạn để ý thì file config có nhiều “##”. Sau đây chúng ta có 1 command rất haygrep -v "^#" /etc/elasticsearch/elasticsearch.yml
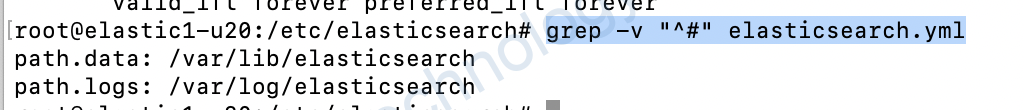
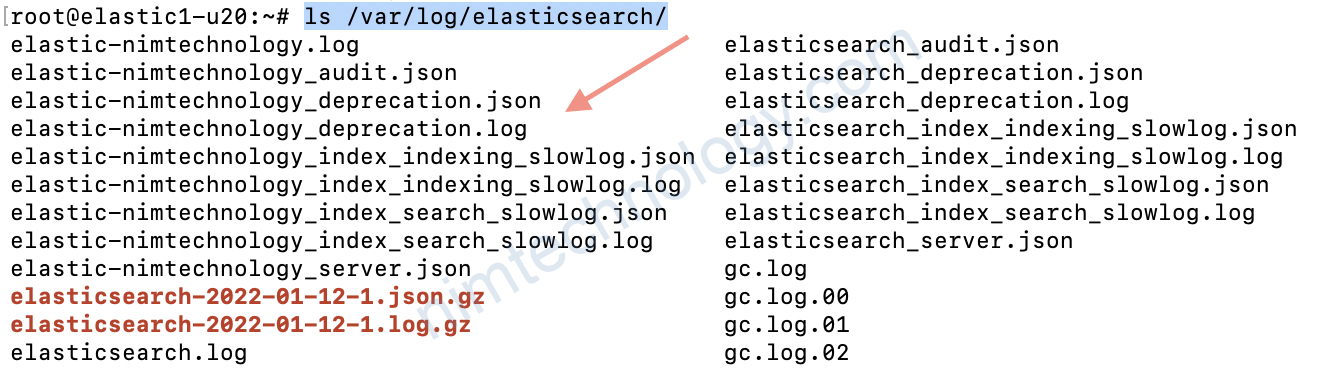
như ảnh ở trên thì ta biết được log và data của elastic lưu ở đâu.
Hiện tại mình đang lab để tìm hiểu về các tính năng nên mình chỉ sửa dụng 1 node elastic.
Nếu có nhu cầu nhiều node.
Mình sẽ note thêm.
3.2) Config Cluster name
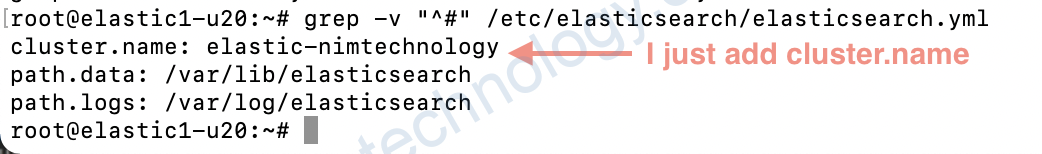
Bạn để ý là mình đã thêm cluster.name sàu đó mình:sudo systemctl restart elasticsearch.service
ls /var/log/elasticsearch/
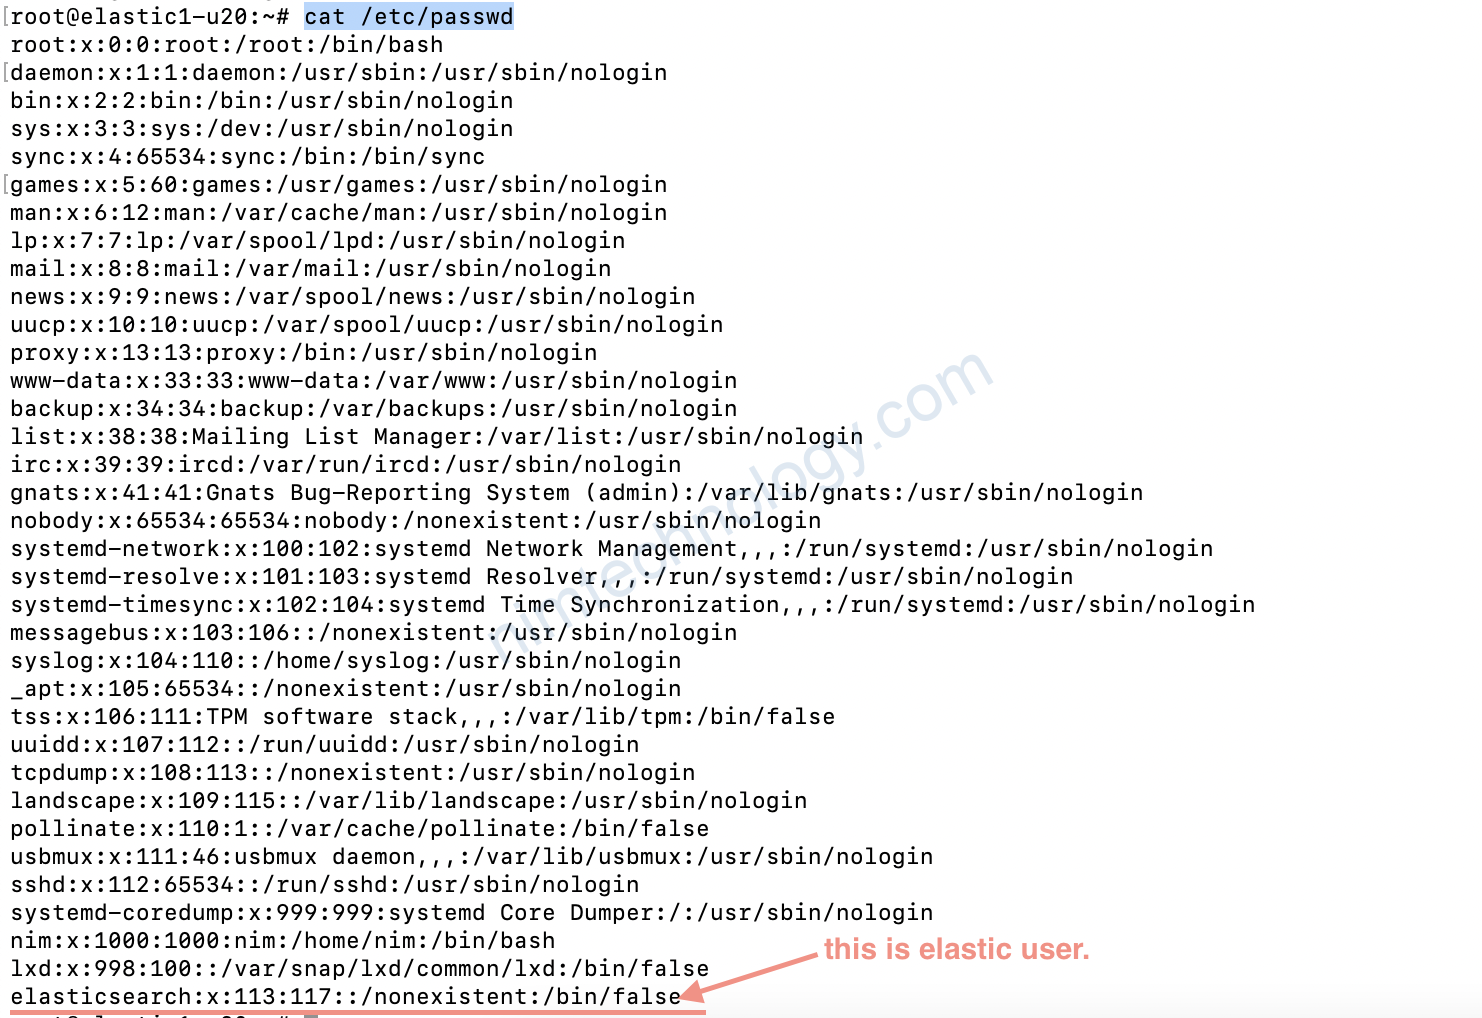
cat /etc/passwd
ss -nltpu
Netid  State   Recv-Q  Send-Q        Local Address:Port    Peer Address:Port  Process
udp    UNCONN  0       0             127.0.0.53%lo:53           0.0.0.0:*      users:(("systemd-resolve",pid=1002,fd=12))
tcp    LISTEN  0       4096          127.0.0.53%lo:53           0.0.0.0:*      users:(("systemd-resolve",pid=1002,fd=13))
tcp    LISTEN  0       128                 0.0.0.0:22           0.0.0.0:*      users:(("sshd",pid=1792,fd=3))
tcp    LISTEN  0       4096     [::ffff:127.0.0.1]:9200               *:*      users:(("java",pid=64200,fd=305))
tcp    LISTEN  0       4096                  [::1]:9200            [::]:*      users:(("java",pid=64200,fd=304))
tcp    LISTEN  0       4096     [::ffff:127.0.0.1]:9300               *:*      users:(("java",pid=64200,fd=302))
tcp    LISTEN  0       4096                  [::1]:9300            [::]:*      users:(("java",pid=64200,fd=301))
tcp    LISTEN  0       128                    [::]:22              [::]:*      users:(("sshd",pid=1792,fd=4))
3.3) Don’t auto update version elastic
Để ngắn ko tự app upgrade elastic là như sau:
root@elastic1-u20:~# apt-mark hold elasticsearch
elasticsearch set on hold.
3.4) Config to allow network connection
network.host: 0.0.0.0
3.5) Config single node
discovery.type: single-node
Issues
curl: (52) Empty reply from server
The setting xpack.security.enabled in Elasticsearch’s configuration file (elasticsearch.yml) controls the activation of security features. When set to true, it enables security, enforcing authentication and authorization. Conversely, setting it to false disables these security features, allowing unauthenticated access to the Elasticsearch cluster. Changing this setting to false can solve connection issues like the “curl: (52) Empty reply from server” error, but be aware that it makes your Elasticsearch cluster insecure as it allows unauthenticated and unauthorized access.
Nếu bạn dựng không dùng authen gì cả thì fix như sau:
In your elasticsearch.yml file, you might want to change the value of xpack.security.enabled to false. This action could resolve the “curl (52) empty reply from server elasticsearch Ubuntu” error you’re facing123.