Mình đã hỏi chat GPT và nó chỉ mình như sau:
1. Monitor I/O Performance Using ‘iostat’ Command: The first and most straightforward way to check disk performance in Linux is to use the ‘iostat’ utility to monitor I/O performance. ‘iostat’ can be used to monitor the I/O statistics of both CPUs and storage devices in a Linux system. It displays output in three sections; CPU utilization, device utilization, and a report of devices, including their read and write I/O throughput performance.
2. Monitor Disk Performance with ‘sar’ Command: You can also monitor disk performance in Linux with the ‘sar’ command. It’s part of the sysstat package, which is usually installed on Linux systems by default. It’s very similar to ‘iostat’, but it gives you a more in-depth view of what’s happening on your system. The ‘sar’ output has two main sections; one for I/O stats and one for block device statistics. Using ‘sar’, you can monitor write and read I/O per second, I/O capacity, I/O latency, and more.
3. Check IOPS with ‘fio’ Command: The ‘fio’ command is a tool that can be used to generate I/O performance data for both reads and writes. It running a series of tests on storage devices to measure their throughput, latency, and IOPS performance. The output of ‘fio’ will give you a rough idea of the I/O capability of your system, although it’s not as detailed as the ‘iostat’ and ‘sar’ tools.
4. Measure Latency and Performance with ‘ioping’ Command: The ‘ioping’ command is another useful tool for checking disk performance in Linux. It’s basically a utility for measuring disk latency, and gives you information on the average and maximum latency for your disk. Plus, it can also be used to measure I/O performance by running multiple I/O operations concurrently.
Sau đó thì mình quyết định sử dụng fio
Reference links:
https://cloud.google.com/compute/docs/disks/benchmarking-pd-performance
https://woshub.com/check-disk-performance-iops-latency-linux/
Bài test của mình trên kubernetes
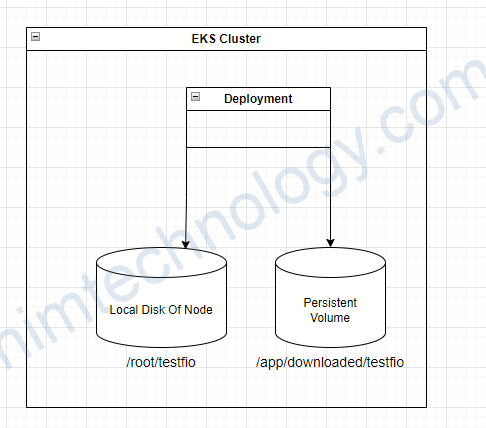
Mình so sánh local disk của node và pvc thì cài nào nhanh hơn
setup local disk of node: gp3 / IOPS: 3000 / Throughput: 125 MB/s / 200GB
PVC: gp3 / IOPS: 16,000 / Throughput: 600 MB/s
đây là file deployment của mình:
apiVersion: apps/v1
kind: Deployment
metadata:
  labels:
    app.kubernetes.io/instance: openvscode-server
    app.kubernetes.io/name: openvscode-server
  name: openvscode-server
  namespace: nimtechnology-engines-staging
spec:
  replicas: 1
  selector:
    matchLabels:
      app.kubernetes.io/instance: openvscode-server
      app.kubernetes.io/name: openvscode-server
  strategy:
    rollingUpdate:
      maxSurge: 25%
      maxUnavailable: 25%
    type: RollingUpdate
  template:
    metadata:
      labels:
        app.kubernetes.io/instance: openvscode-server
        app.kubernetes.io/name: openvscode-server
    spec:
      volumes:
        - name: file-service
          persistentVolumeClaim:
            claimName: pvc-file-service-smb-1
      nodeSelector:
        kubernetes.io/os: linux
      containers:
        - image: gitpod/openvscode-server:latest
          livenessProbe:
            failureThreshold: 3
            httpGet:
              path: /
              port: http
              scheme: HTTP
            periodSeconds: 10
            successThreshold: 1
            timeoutSeconds: 1
          name: openvscode-server
          ports:
            - containerPort: 3000
              name: http
              protocol: TCP
          readinessProbe:
            failureThreshold: 3
            httpGet:
              path: /
              port: http
              scheme: HTTP
            periodSeconds: 10
            successThreshold: 1
            timeoutSeconds: 1
          volumeMounts:
            - name: file-service
              mountPath: /app/downloaded
Install Fio
sudo apt update -y
sudo apt install fio
When running the test, an 8 GB file will be created. Then fio will read/write a 4KB block (a standard block size) with the 75/25% by the number of reads and writes operations and measure the performance. The command is as follows:
đây là bài test trên persistent volume.
fio --randrepeat=1 --ioengine=libaio --direct=1 --gtod_reduce=1 --name=fiotest --filename=/app/downloaded/testfio --bs=4k --iodepth=64 --size=8G --readwrite=randrw --rwmixread=75
fiotest: (g=0): rw=randrw, bs=(R) 4096B-4096B, (W) 4096B-4096B, (T) 4096B-4096B, ioengine=libaio, iodepth=64
fio-3.28
Starting 1 process
fiotest: Laying out IO file (1 file / 8192MiB)
Jobs: 1 (f=1): [m(1)][100.0%][r=36.7MiB/s,w=12.4MiB/s][r=9385,w=3181 IOPS][eta 00m:00s]
fiotest: (groupid=0, jobs=1): err= 0: pid=1038: Wed Feb  8 09:16:49 2023
  read: IOPS=6253, BW=24.4MiB/s (25.6MB/s)(6141MiB/251421msec)
   bw (  KiB/s): min=18352, max=37664, per=100.00%, avg=25015.65, stdev=3945.22, samples=502
   iops        : min= 4588, max= 9416, avg=6253.91, stdev=986.30, samples=502
  write: IOPS=2088, BW=8353KiB/s (8553kB/s)(2051MiB/251421msec); 0 zone resets
   bw (  KiB/s): min= 6120, max=12704, per=100.00%, avg=8353.98, stdev=1333.53, samples=502
   iops        : min= 1530, max= 3176, avg=2088.49, stdev=333.38, samples=502
  cpu          : usr=2.30%, sys=7.95%, ctx=2092258, majf=0, minf=6
  IO depths    : 1=0.1%, 2=0.1%, 4=0.1%, 8=0.1%, 16=0.1%, 32=0.1%, >=64=100.0%
     submit    : 0=0.0%, 4=100.0%, 8=0.0%, 16=0.0%, 32=0.0%, 64=0.0%, >=64=0.0%
     complete  : 0=0.0%, 4=100.0%, 8=0.0%, 16=0.0%, 32=0.0%, 64=0.1%, >=64=0.0%
     issued rwts: total=1572145,525007,0,0 short=0,0,0,0 dropped=0,0,0,0
     latency   : target=0, window=0, percentile=100.00%, depth=64

Run status group 0 (all jobs):
   READ: bw=24.4MiB/s (25.6MB/s), 24.4MiB/s-24.4MiB/s (25.6MB/s-25.6MB/s), io=6141MiB (6440MB), run=251421-251421msec
  WRITE: bw=8353KiB/s (8553kB/s), 8353KiB/s-8353KiB/s (8553kB/s-8553kB/s), io=2051MiB (2150MB), run=251421-251421msec
với bài test trên local disk
fio --randrepeat=1 --ioengine=libaio --direct=1 --gtod_reduce=1 --name=fiotest --filename=/root/testfio --bs=4k --iodepth=64 --size=8G --readwrite=randrw --rwmixread=75
fiotest: (g=0): rw=randrw, bs=(R) 4096B-4096B, (W) 4096B-4096B, (T) 4096B-4096B, ioengine=libaio, iodepth=64
fio-3.28
Starting 1 process
fiotest: Laying out IO file (1 file / 8192MiB)
Jobs: 1 (f=1): [m(1)][100.0%][r=5388KiB/s,w=1680KiB/s][r=1347,w=420 IOPS][eta 00m:00s]
fiotest: (groupid=0, jobs=1): err= 0: pid=3390: Wed Feb  8 07:55:33 2023
  read: IOPS=1279, BW=5118KiB/s (5241kB/s)(6141MiB/1228649msec)
   bw (  KiB/s): min= 2832, max= 5792, per=99.99%, avg=5118.98, stdev=273.84, samples=2456
   iops        : min=  708, max= 1448, avg=1279.73, stdev=68.46, samples=2456
  write: IOPS=427, BW=1709KiB/s (1750kB/s)(2051MiB/1228649msec); 0 zone resets
   bw (  KiB/s): min=  976, max= 2104, per=99.99%, avg=1709.37, stdev=126.73, samples=2456
   iops        : min=  244, max=  526, avg=427.32, stdev=31.69, samples=2456
  cpu          : usr=0.39%, sys=1.19%, ctx=2097307, majf=0, minf=7
  IO depths    : 1=0.1%, 2=0.1%, 4=0.1%, 8=0.1%, 16=0.1%, 32=0.1%, >=64=100.0%
     submit    : 0=0.0%, 4=100.0%, 8=0.0%, 16=0.0%, 32=0.0%, 64=0.0%, >=64=0.0%
     complete  : 0=0.0%, 4=100.0%, 8=0.0%, 16=0.0%, 32=0.0%, 64=0.1%, >=64=0.0%
     issued rwts: total=1572145,525007,0,0 short=0,0,0,0 dropped=0,0,0,0
     latency   : target=0, window=0, percentile=100.00%, depth=64

Run status group 0 (all jobs):
   READ: bw=5118KiB/s (5241kB/s), 5118KiB/s-5118KiB/s (5241kB/s-5241kB/s), io=6141MiB (6440MB), run=1228649-1228649msec
  WRITE: bw=1709KiB/s (1750kB/s), 1709KiB/s-1709KiB/s (1750kB/s-1750kB/s), io=2051MiB (2150MB), run=1228649-1228649msec
Bạn có thể tham khảo thêm các command khác.
https://gist.github.com/githubfoam/a678cfc813c7ede6ca9ecb93e34edd8e