1) Introduction
VictoriaMetrics is a fast, cost-effective and scalable time series database. It can be used as a long-term remote storage for Prometheus. It is recommended using single-node version instead of cluster version for ingestion rates lower than a million of data points per second.
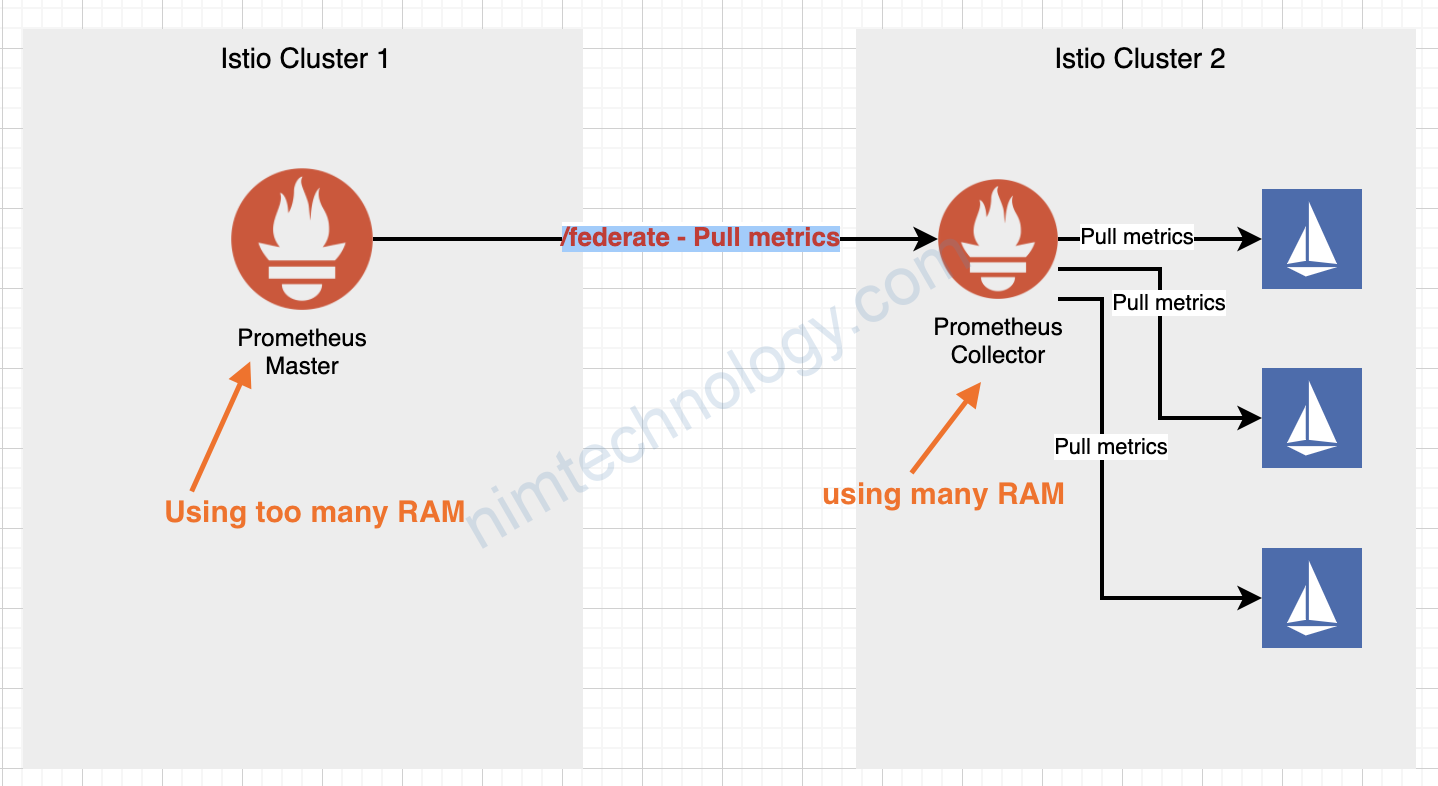
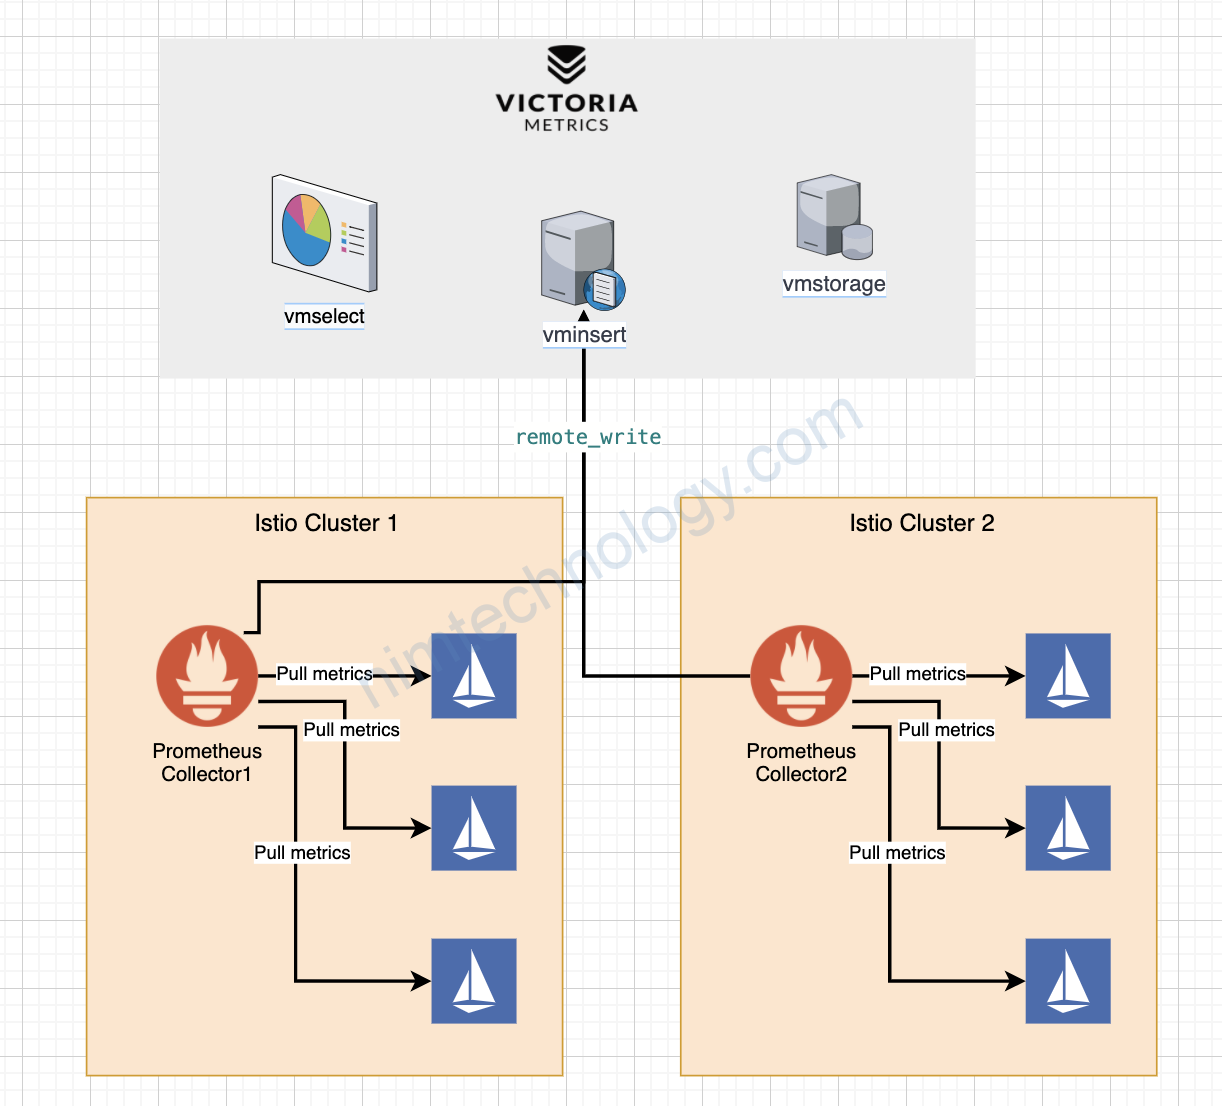
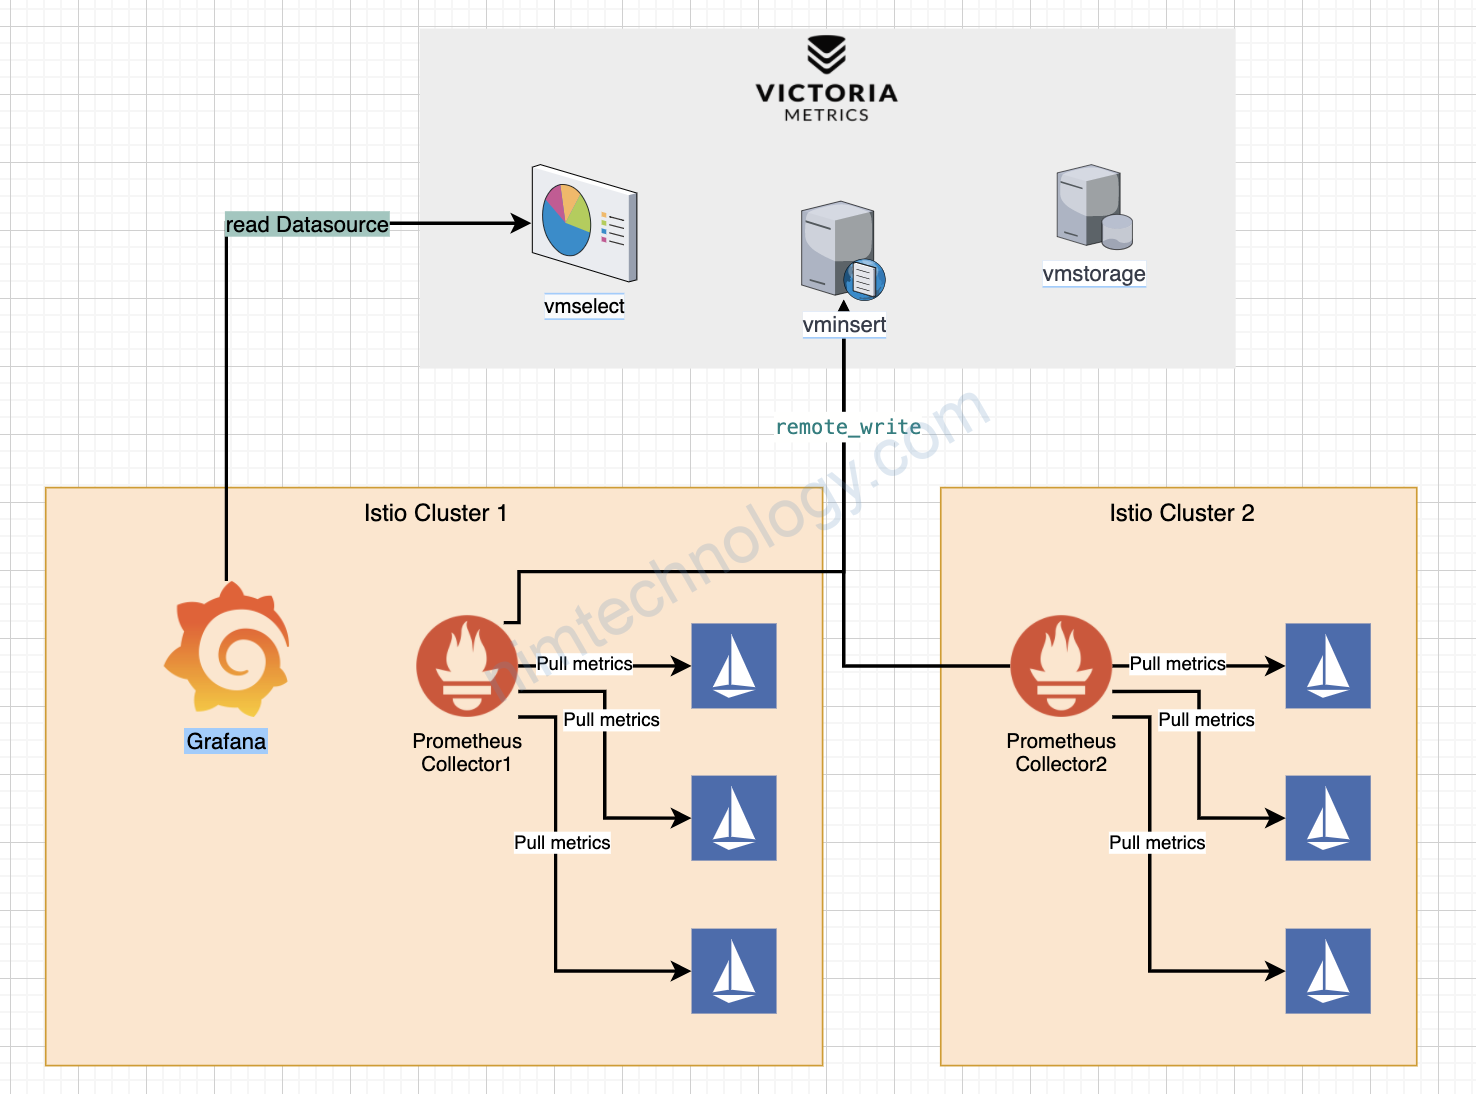
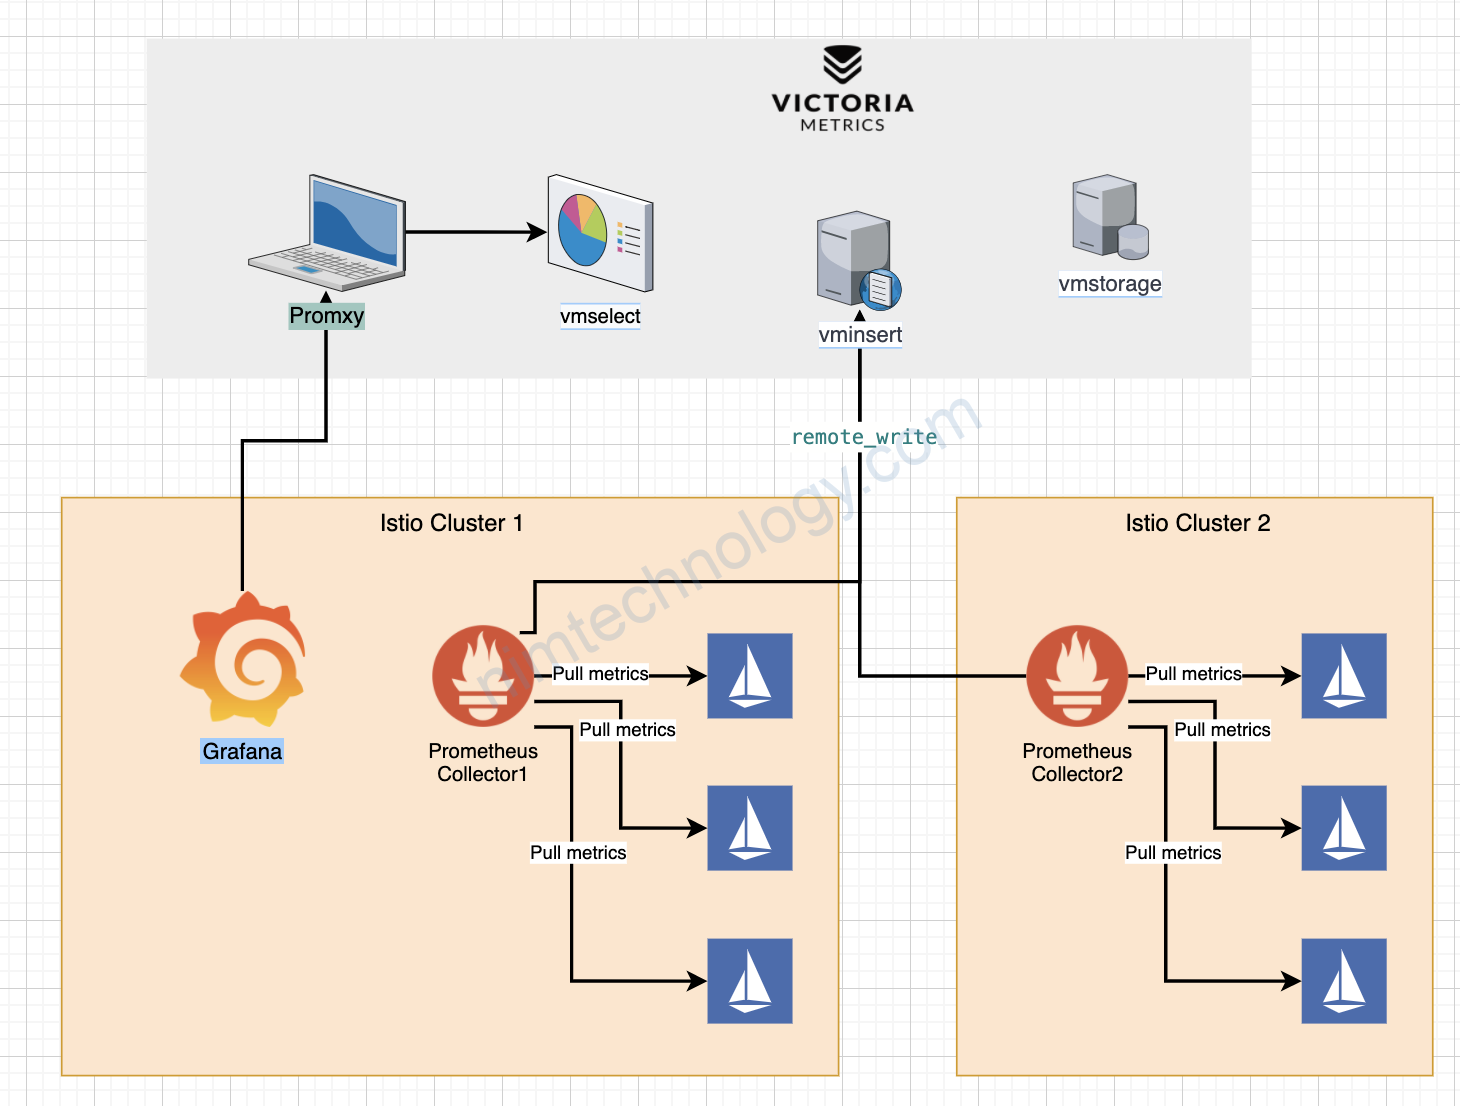
Mình sẽ hợp với VictoriaMetrics với mô hình mutil Prometheus hoặc là công ty của bạn có rất nhiều con prometheus thì có thể sài cách này.
bạn có thể đọc chơi cho dui.
2) Install VictoriaMetrics
2.1) Config VictoriaMetrics
Hướng dẫn cài thì trong link bên dưới bằng helm3
https://docs.victoriametrics.com/guides/k8s-monitoring-via-vm-cluster.html
tao namespace: vm
helm repo add vm https://victoriametrics.github.io/helm-charts/

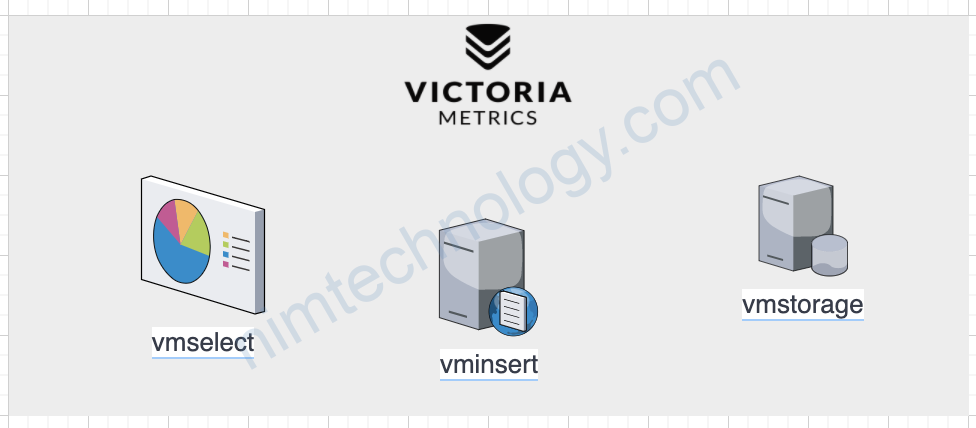
Một cluster VictoriaMetrics thì gồm 3 con chính nếu bạn cài bằng helm he. Mình sẽ ko đi sau kiến trúc, rồi data, network, … các kiểu. Nhưng thứ chi tiết như thế bạn cứ nghiên cứu docx chỉnh của họ he.
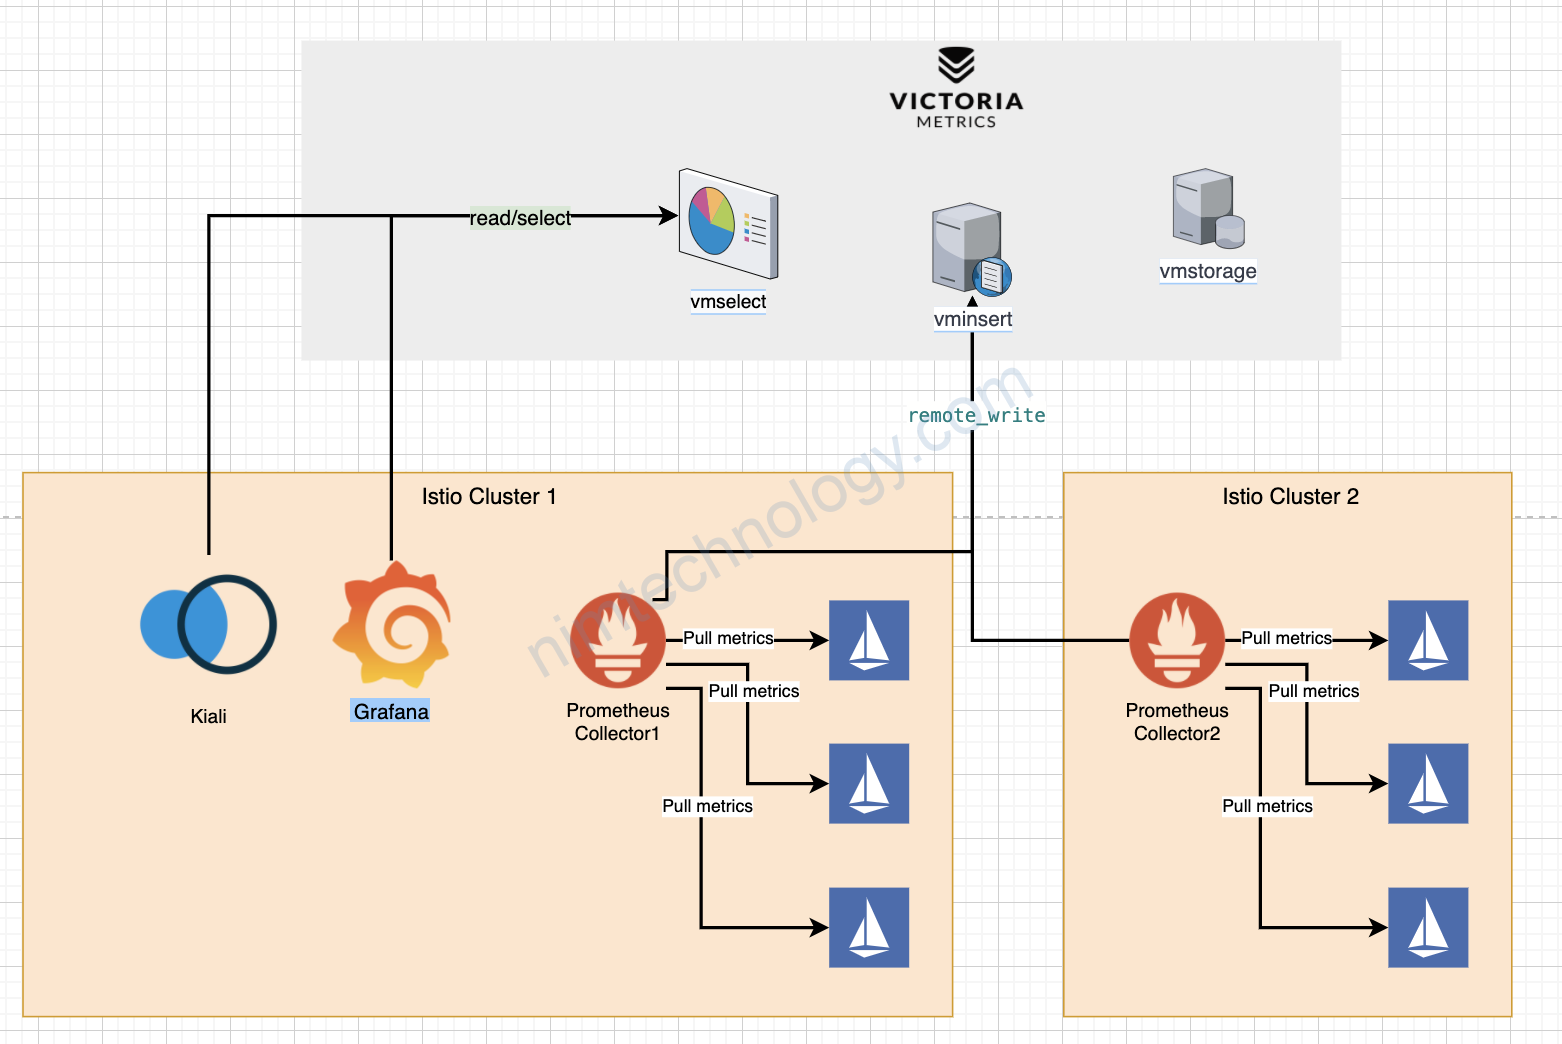
VictoriaMetrics cluster consists of the following services:
vmstorage– stores the raw data and returns the queried data on the given time range for the given label filtersvminsert– accepts the ingested data and spreads it amongvmstoragenodes according to consistent hashing over metric name and all its labelsvmselect– performs incoming queries by fetching the needed data from all the configuredvmstoragenodes
Câu lệnh port-forward
Get the Victoria Metrics insert service URL by running these commands in the same shell:
  export POD_NAME=$(kubectl get pods --namespace vm -l "app=vminsert" -o jsonpath="{.items[0].metadata.name}")
  kubectl --namespace vm port-forward $POD_NAME 8480
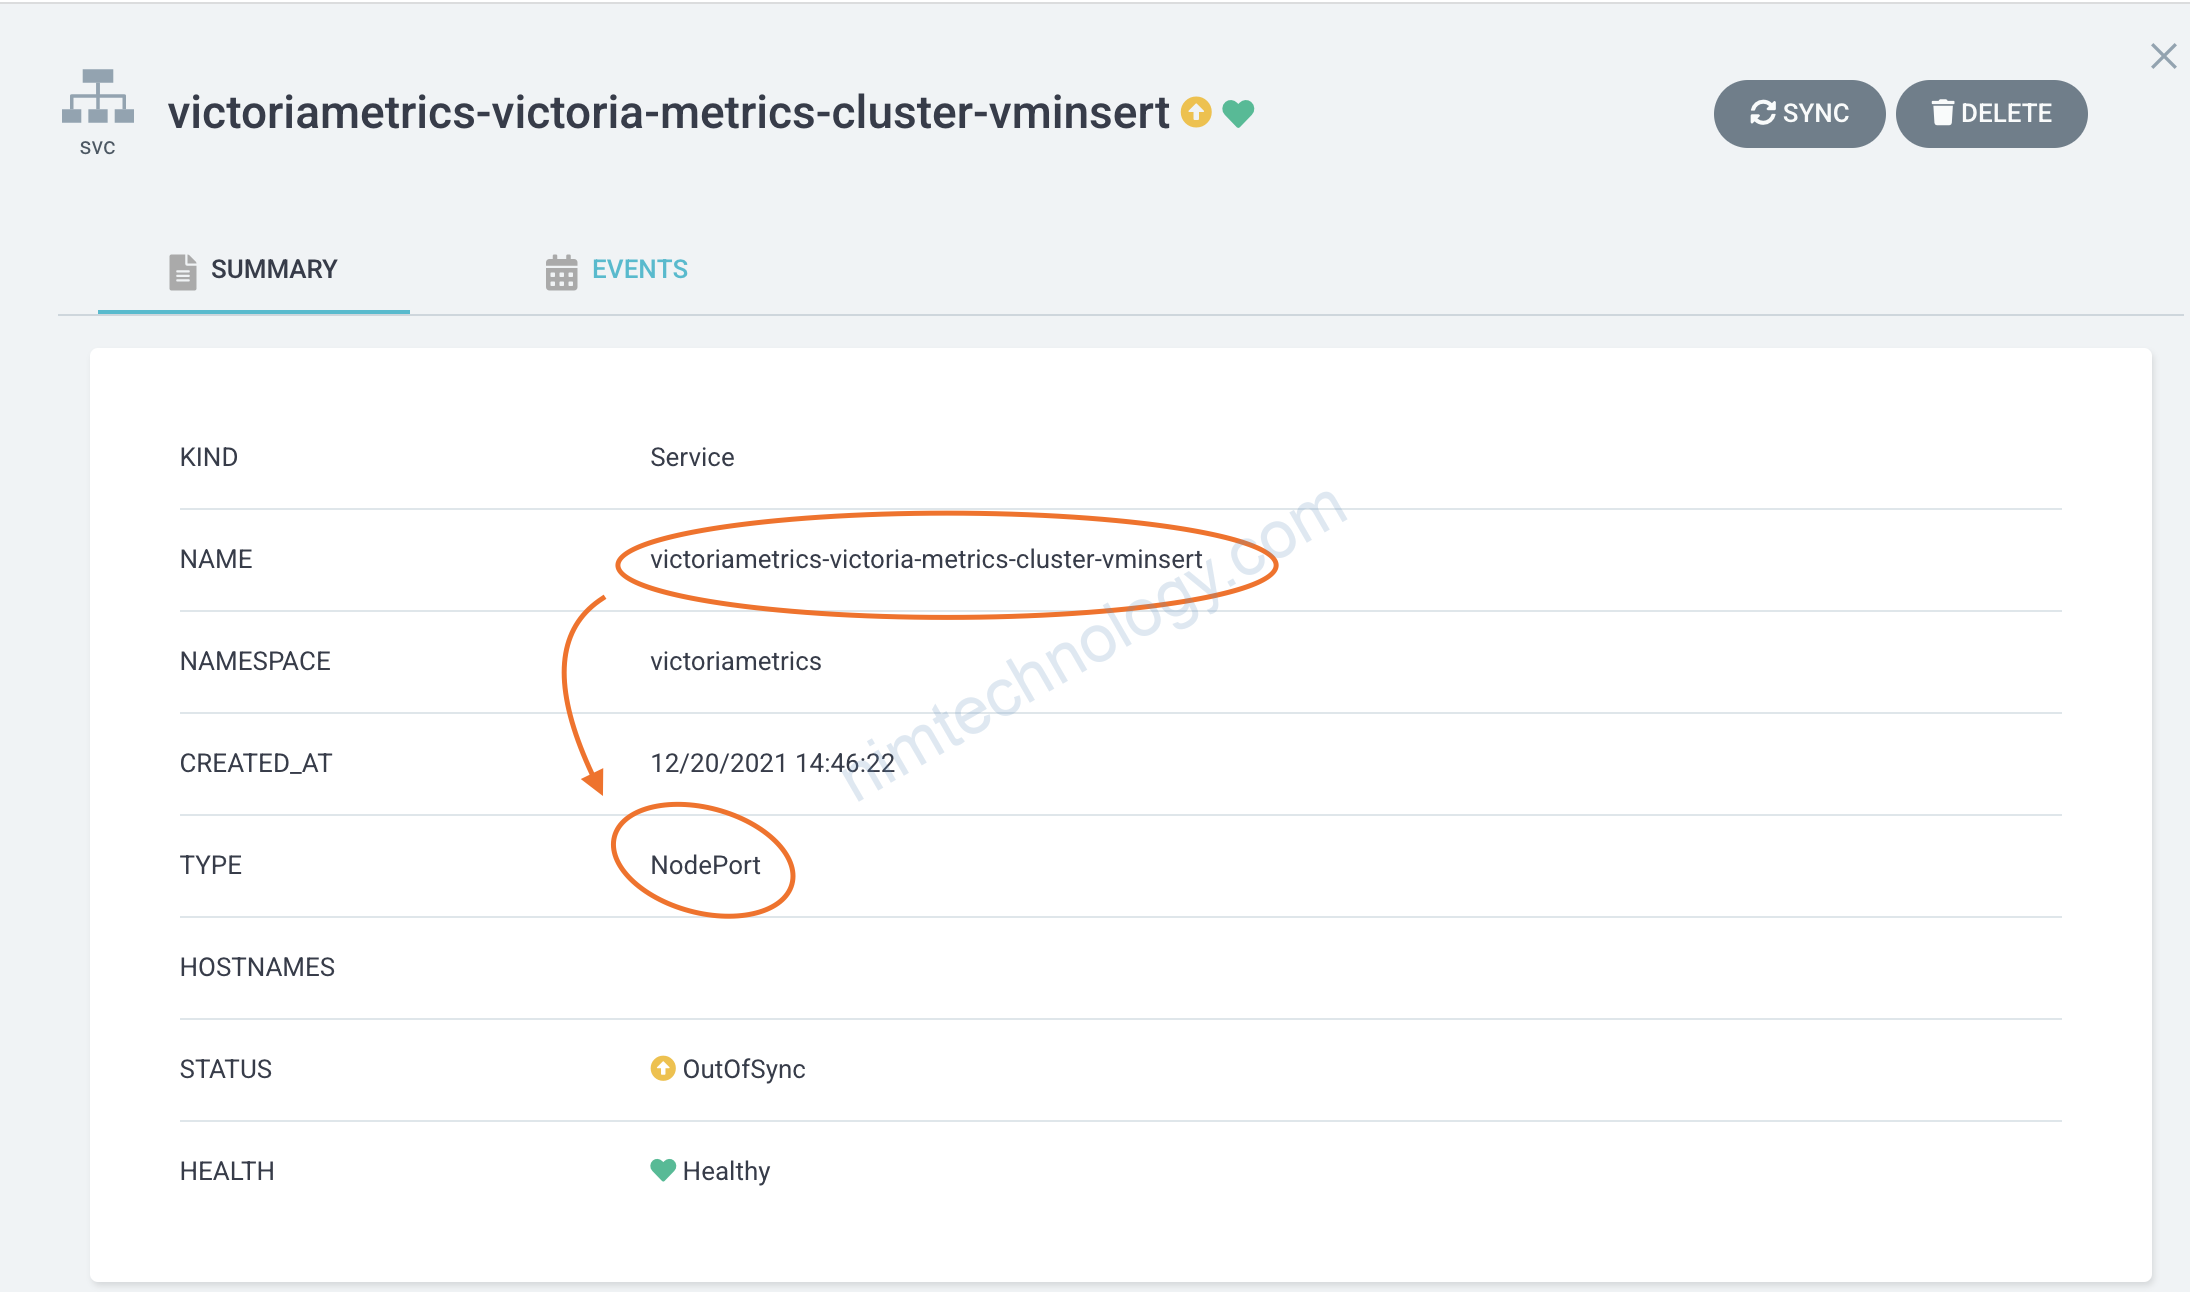
victoriametrics-victoria-metrics-cluster-vminsert
thành NodePort
2.2) Config prometheus
Tiếp đến là Để prometheus send log vào Victoria.
prometheus.yml

    remote_write:
      - url: "http://<insert-service>/insert/0/prometheus/"
apiVersion: v1
data:
  alerting_rules.yml: |
    {}
  alerts: |
    {}
  prometheus.yml: |
    global:
      external_labels:
        datacenter: prometheus-cluster1 ##đặt thêm label
      evaluation_interval: 1m
      scrape_interval: 15s
      scrape_timeout: 10s
    remote_write:
      - url: "http://victoriametrics-victoria-metrics-cluster-vminsert.victoriametrics.svc.cluster.local:8480/insert/0/prometheus/"
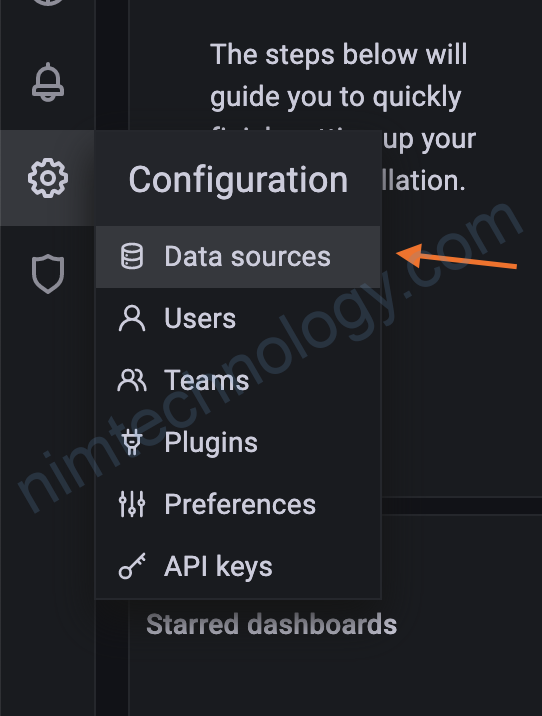
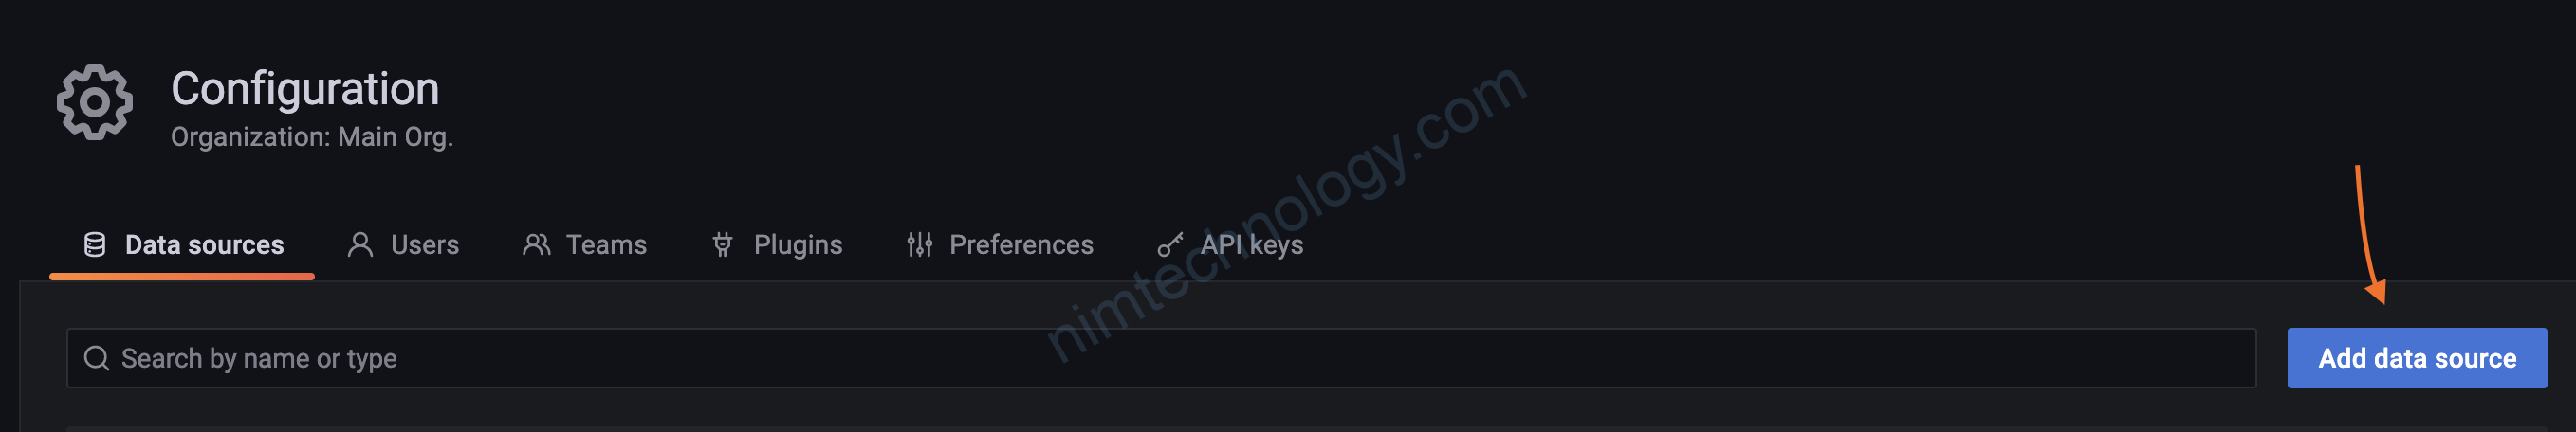
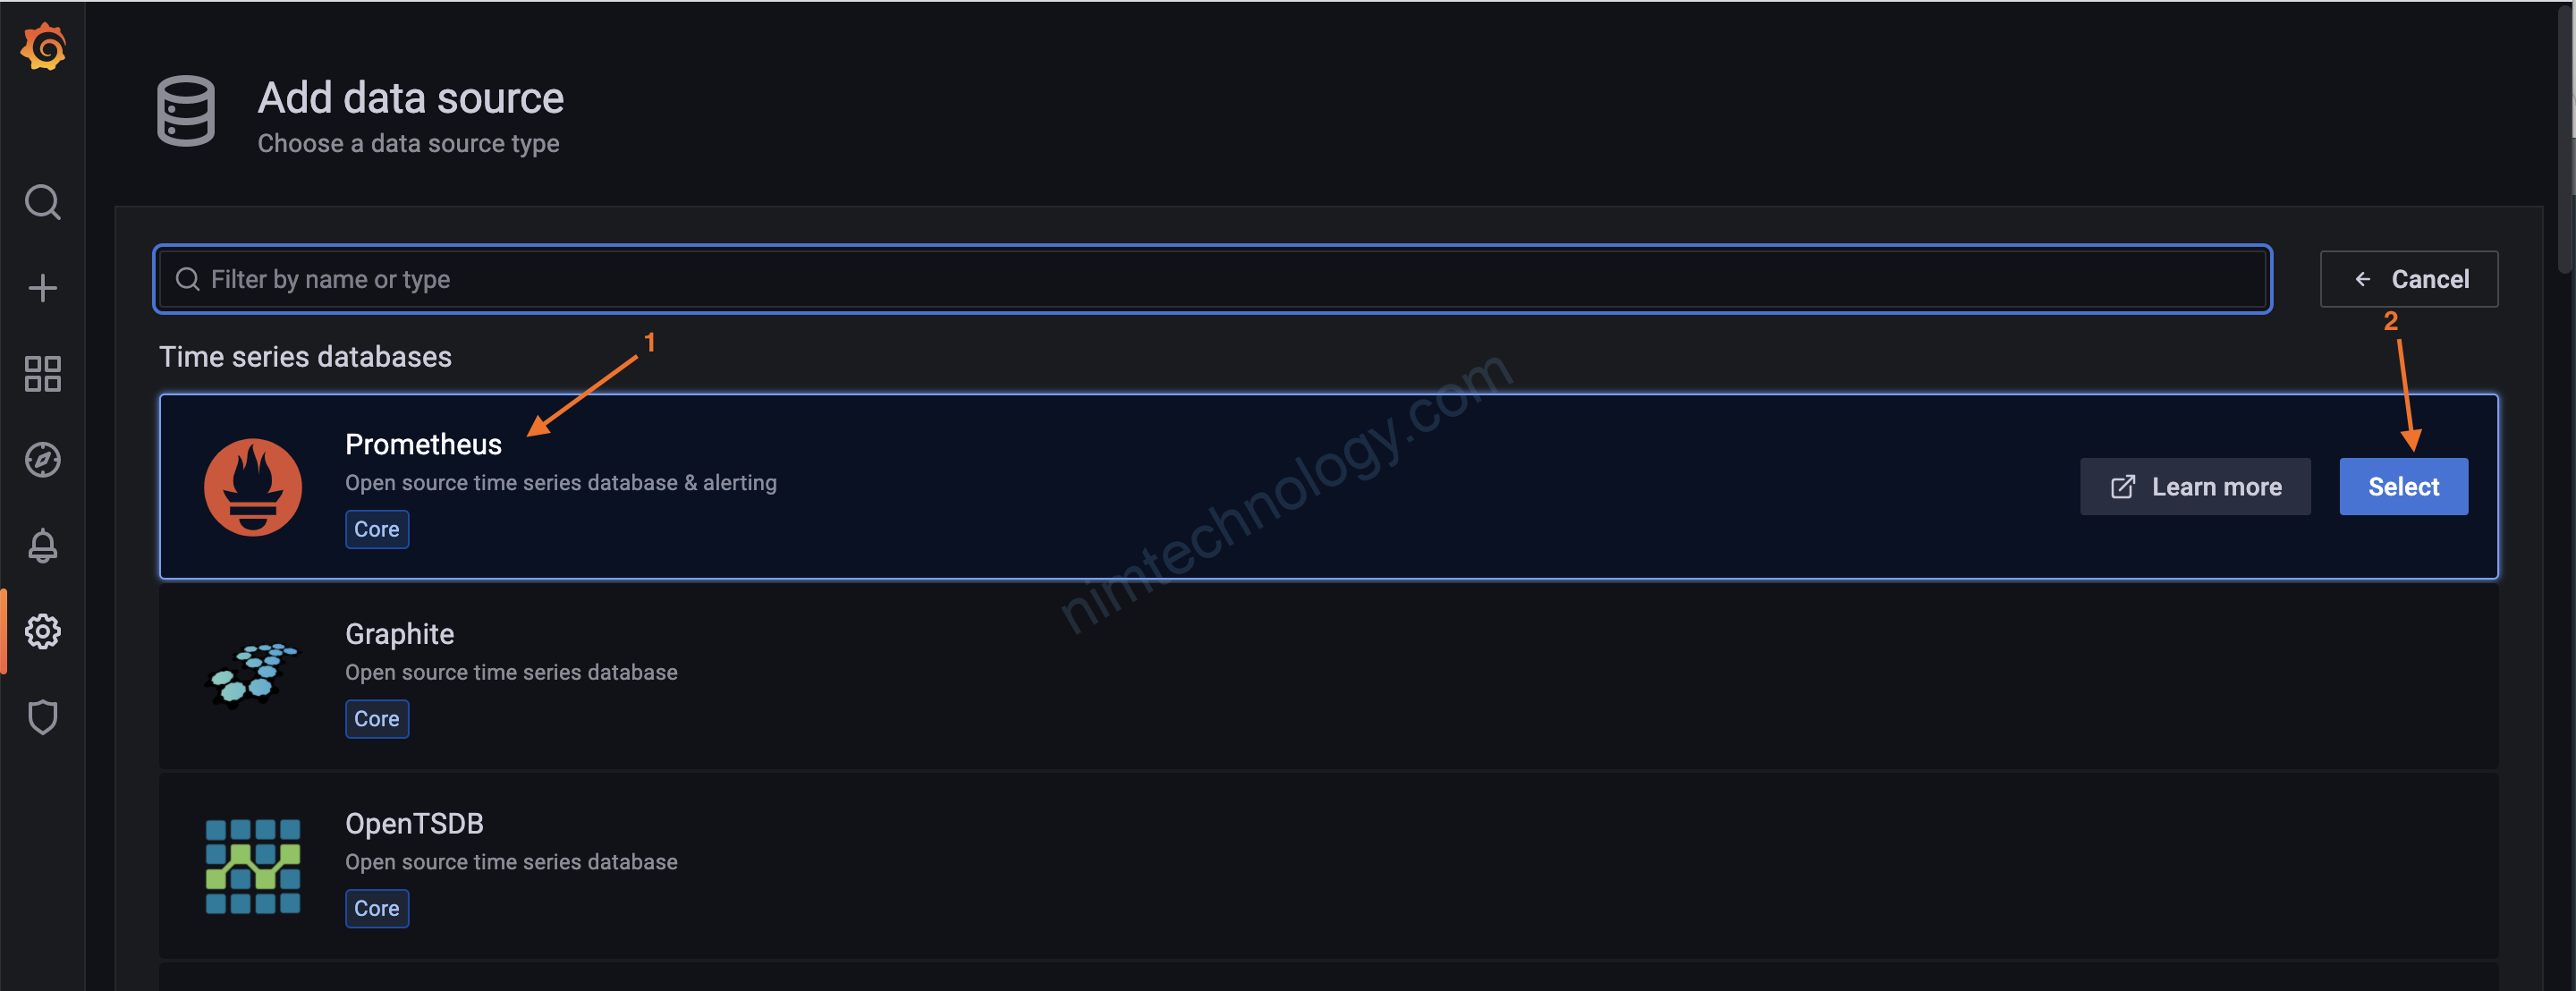
2.3) Config Grafana
Giờ cần lấy metrics từ victoria lên grafana:
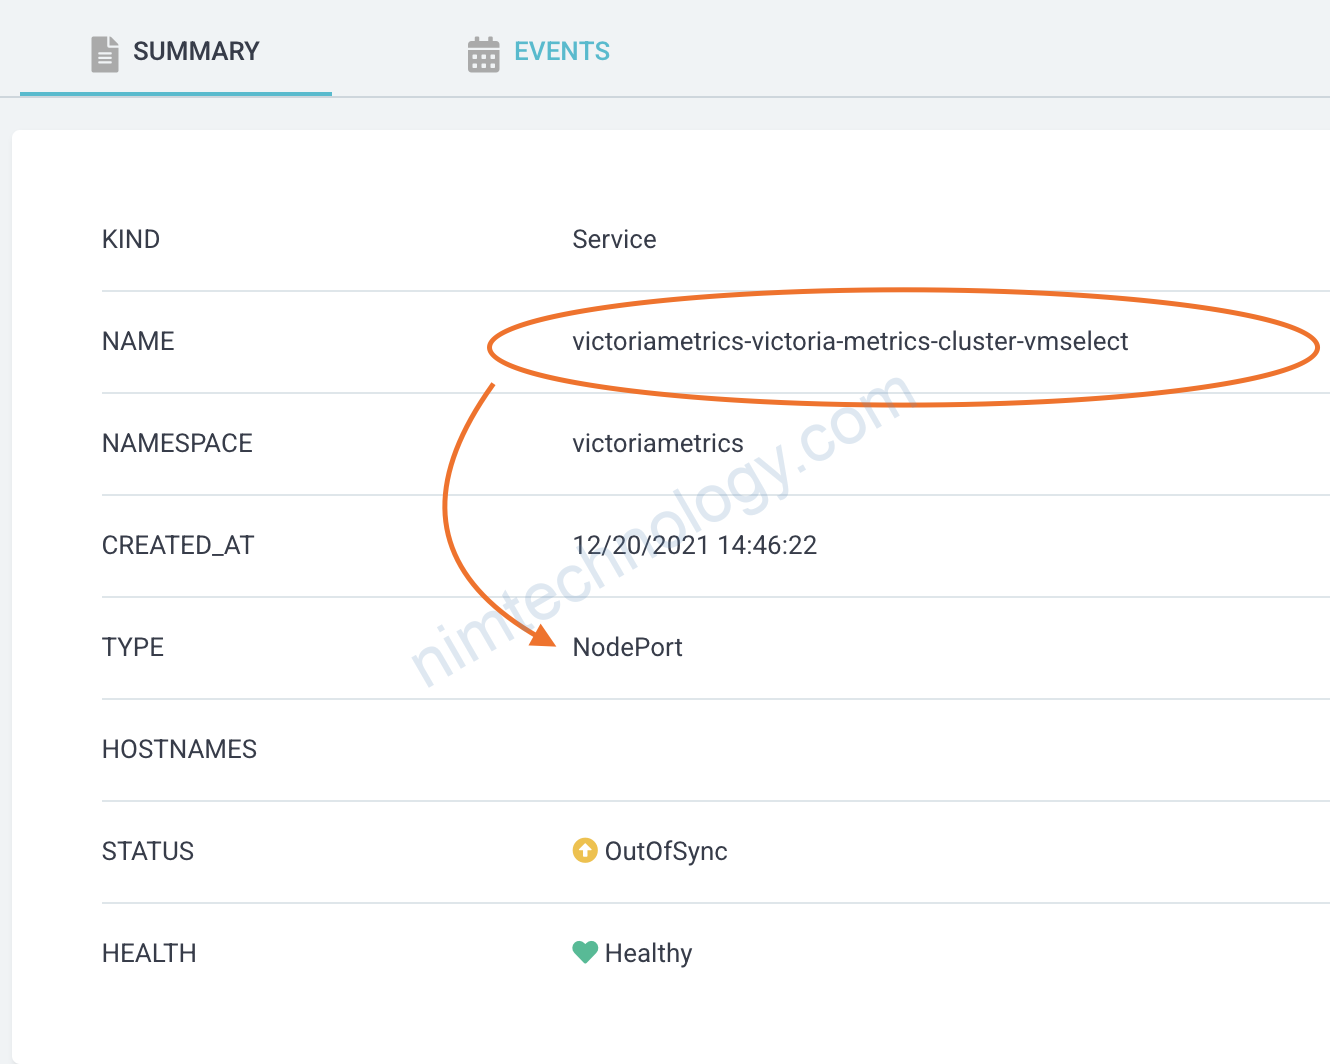
Chúng ta sẽ chỉnh service
victoriametrics-victoria-metrics-cluster-vmselect về NodePort vì mình lười he
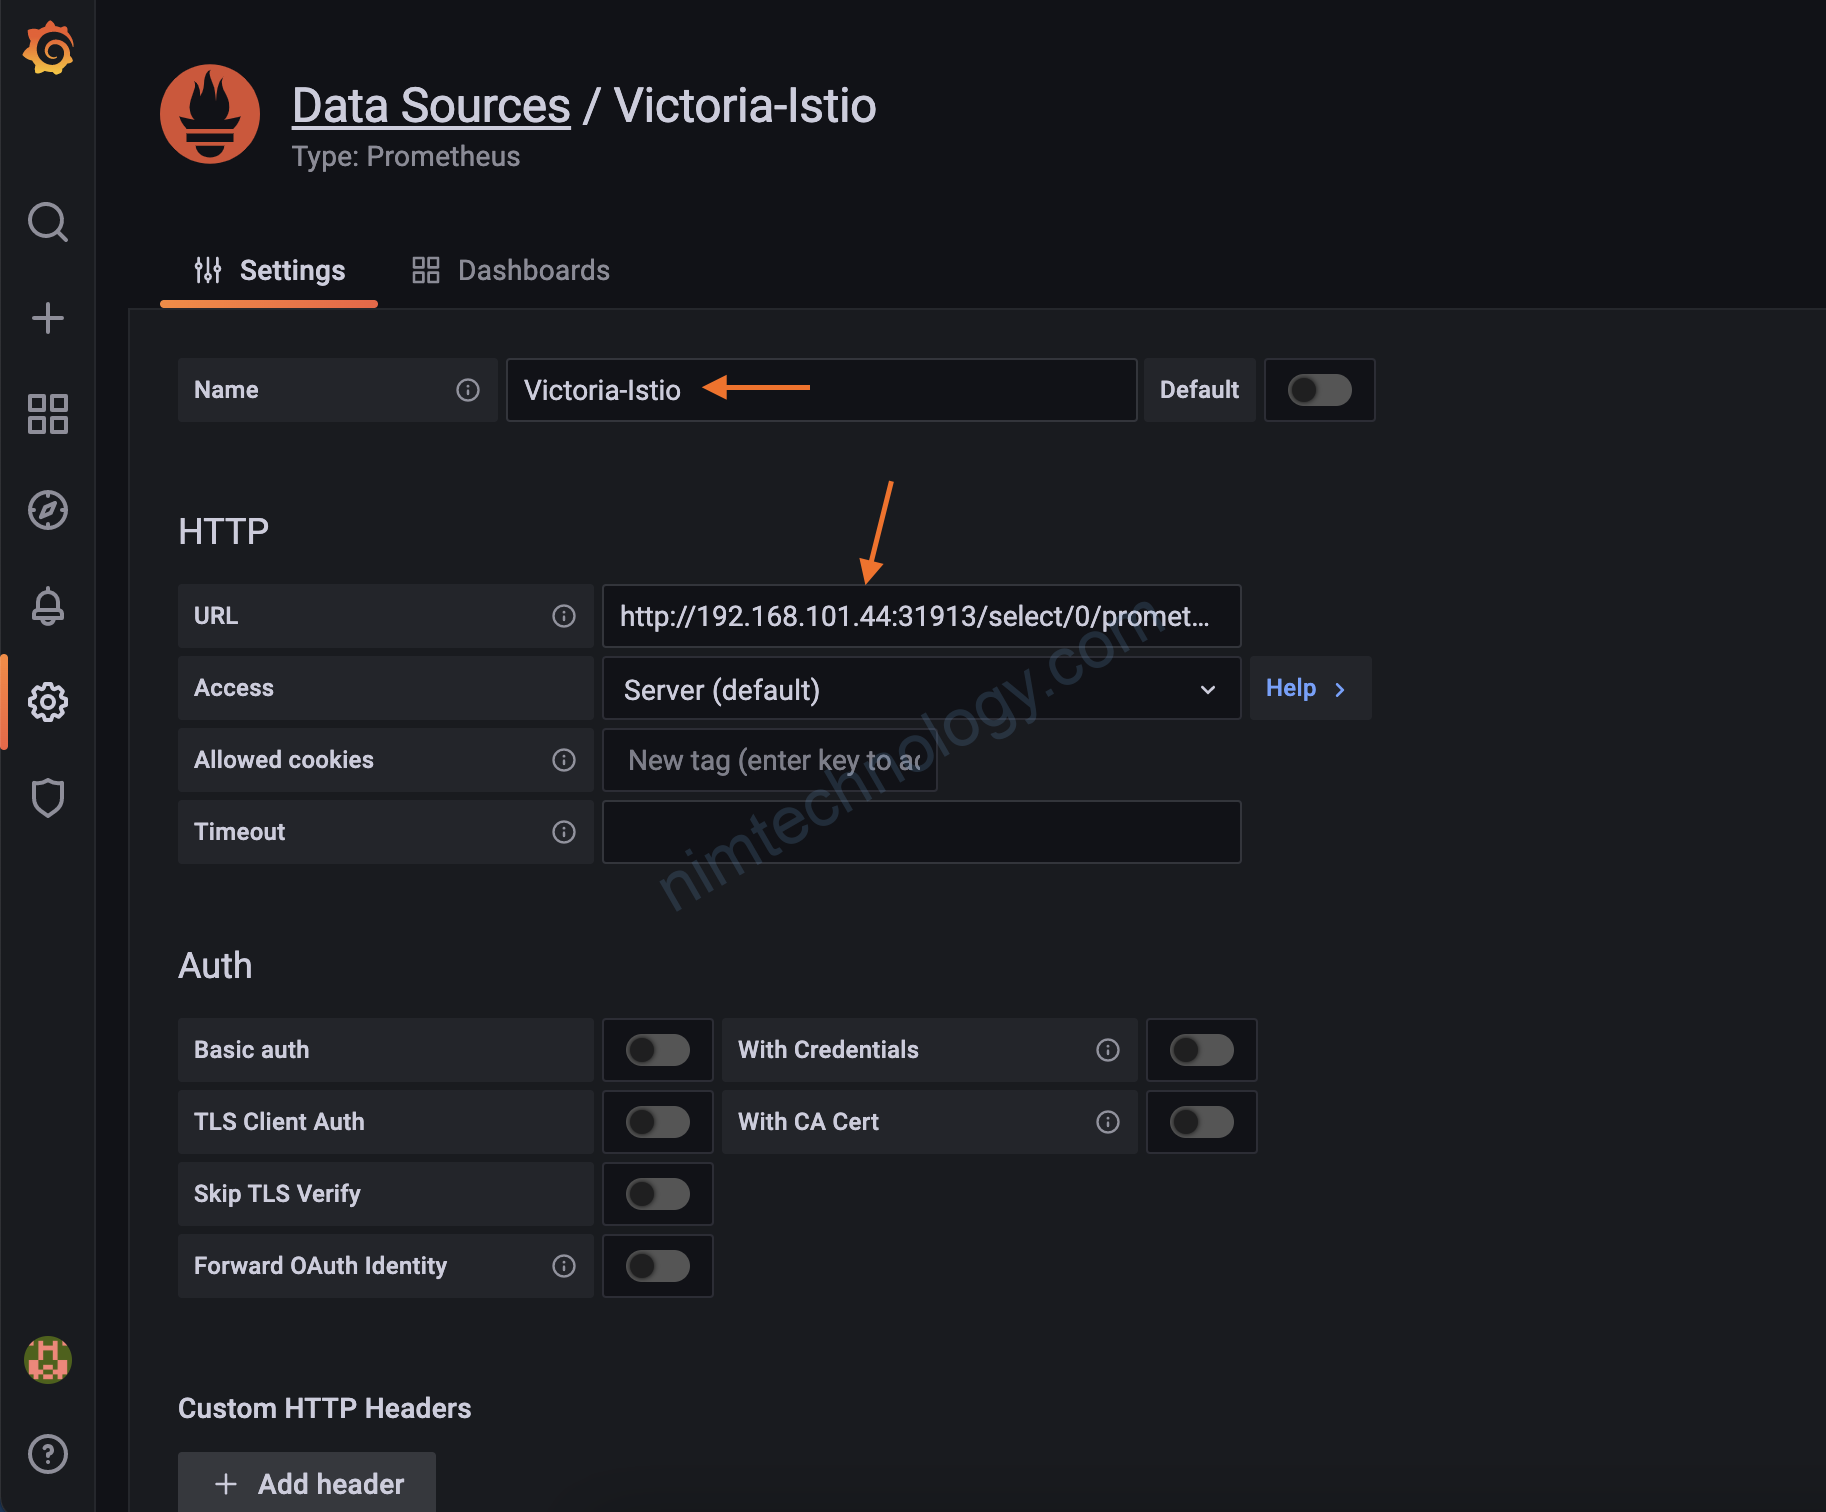
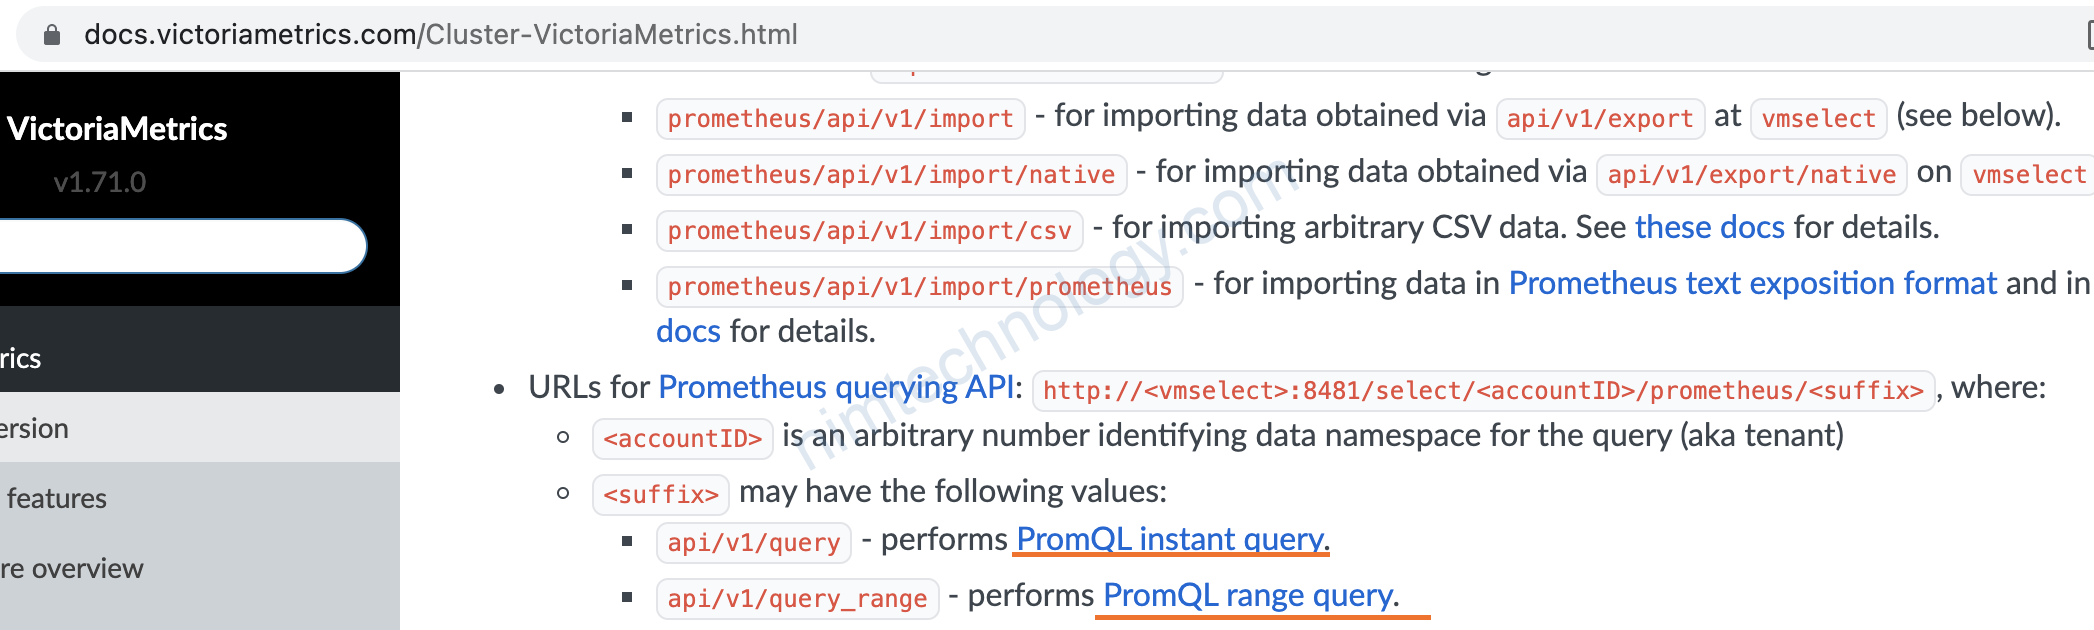
Bạn để ý path giữa insert và select sẽ có sự liên quan nha.
2.4) Install and config promxy
https://mojo-zd.github.io/2019/06/26/promtheus-VictoriaMetrics%E7%BB%84%E5%90%88%E6%8A%80/
https://github.com/mojo-zd/docs/tree/master/kubernetes/prometheus/high-availability
Bạn thân thì victoria-metrics ko có UI.
nếu bạn muốn query như prometheus thì làm sao???
Bạn cài promxy read/select vào victoria-metrics.
Bạn cần chú ý ConfigMap nhé
apiVersion: v1
data:
  config.yaml: |
    ### Promxy configuration 仅需要配置victoriametrics select组件地址及接口
    ### Promxy configuration only needs to configure the victoriametrics select component address and interface
    promxy:
      server_groups:
        - static_configs:
            - targets:
              - vmcluster-victoria-metrics-cluster-vmselect.vm.svc.cluster.local:8481
          path_prefix: /select/0/prometheus
kind: ConfigMap
metadata:
  name: promxy-config
  # namespace: vm
---
apiVersion: v1
kind: Service
metadata:
  labels:
    app: promxy
  name: promxy
  # namespace: vm
spec:
  ports:
  - name: promxy
    port: 8082
    protocol: TCP
    targetPort: 8082
  type: NodePort
  selector:
    app: promxy
---
apiVersion: apps/v1
kind: Deployment
metadata:
  labels:
    app: promxy
  name: promxy
  # namespace: vm
spec:
  replicas: 1
  selector:
    matchLabels:
      app: promxy
  template:
    metadata:
      labels:
        app: promxy
    spec:
      containers:
      - args:
        - "--config=/etc/promxy/config.yaml"
        - "--web.enable-lifecycle"
        command:
        - "/bin/promxy"
        image: quay.io/jacksontj/promxy:latest
        imagePullPolicy: Always
        livenessProbe:
          httpGet:
            path: "/-/healthy"
            port: 8082
          initialDelaySeconds: 3
        name: promxy
        ports:
        - containerPort: 8082
        readinessProbe:
          httpGet:
            path: "/-/ready"
            port: 8082
          initialDelaySeconds: 3
        volumeMounts:
        - mountPath: "/etc/promxy/"
          name: promxy-config
          readOnly: true
      # container to reload configs on configmap change
      - args:
        - "--volume-dir=/etc/promxy"
        - "--webhook-url=http://localhost:8082/-/reload"
        image: jimmidyson/configmap-reload:v0.1
        name: promxy-server-configmap-reload
        volumeMounts:
        - mountPath: "/etc/promxy/"
          name: promxy-config
          readOnly: true
      volumes:
      - configMap:
          name: promxy-config
        name: promxy-config
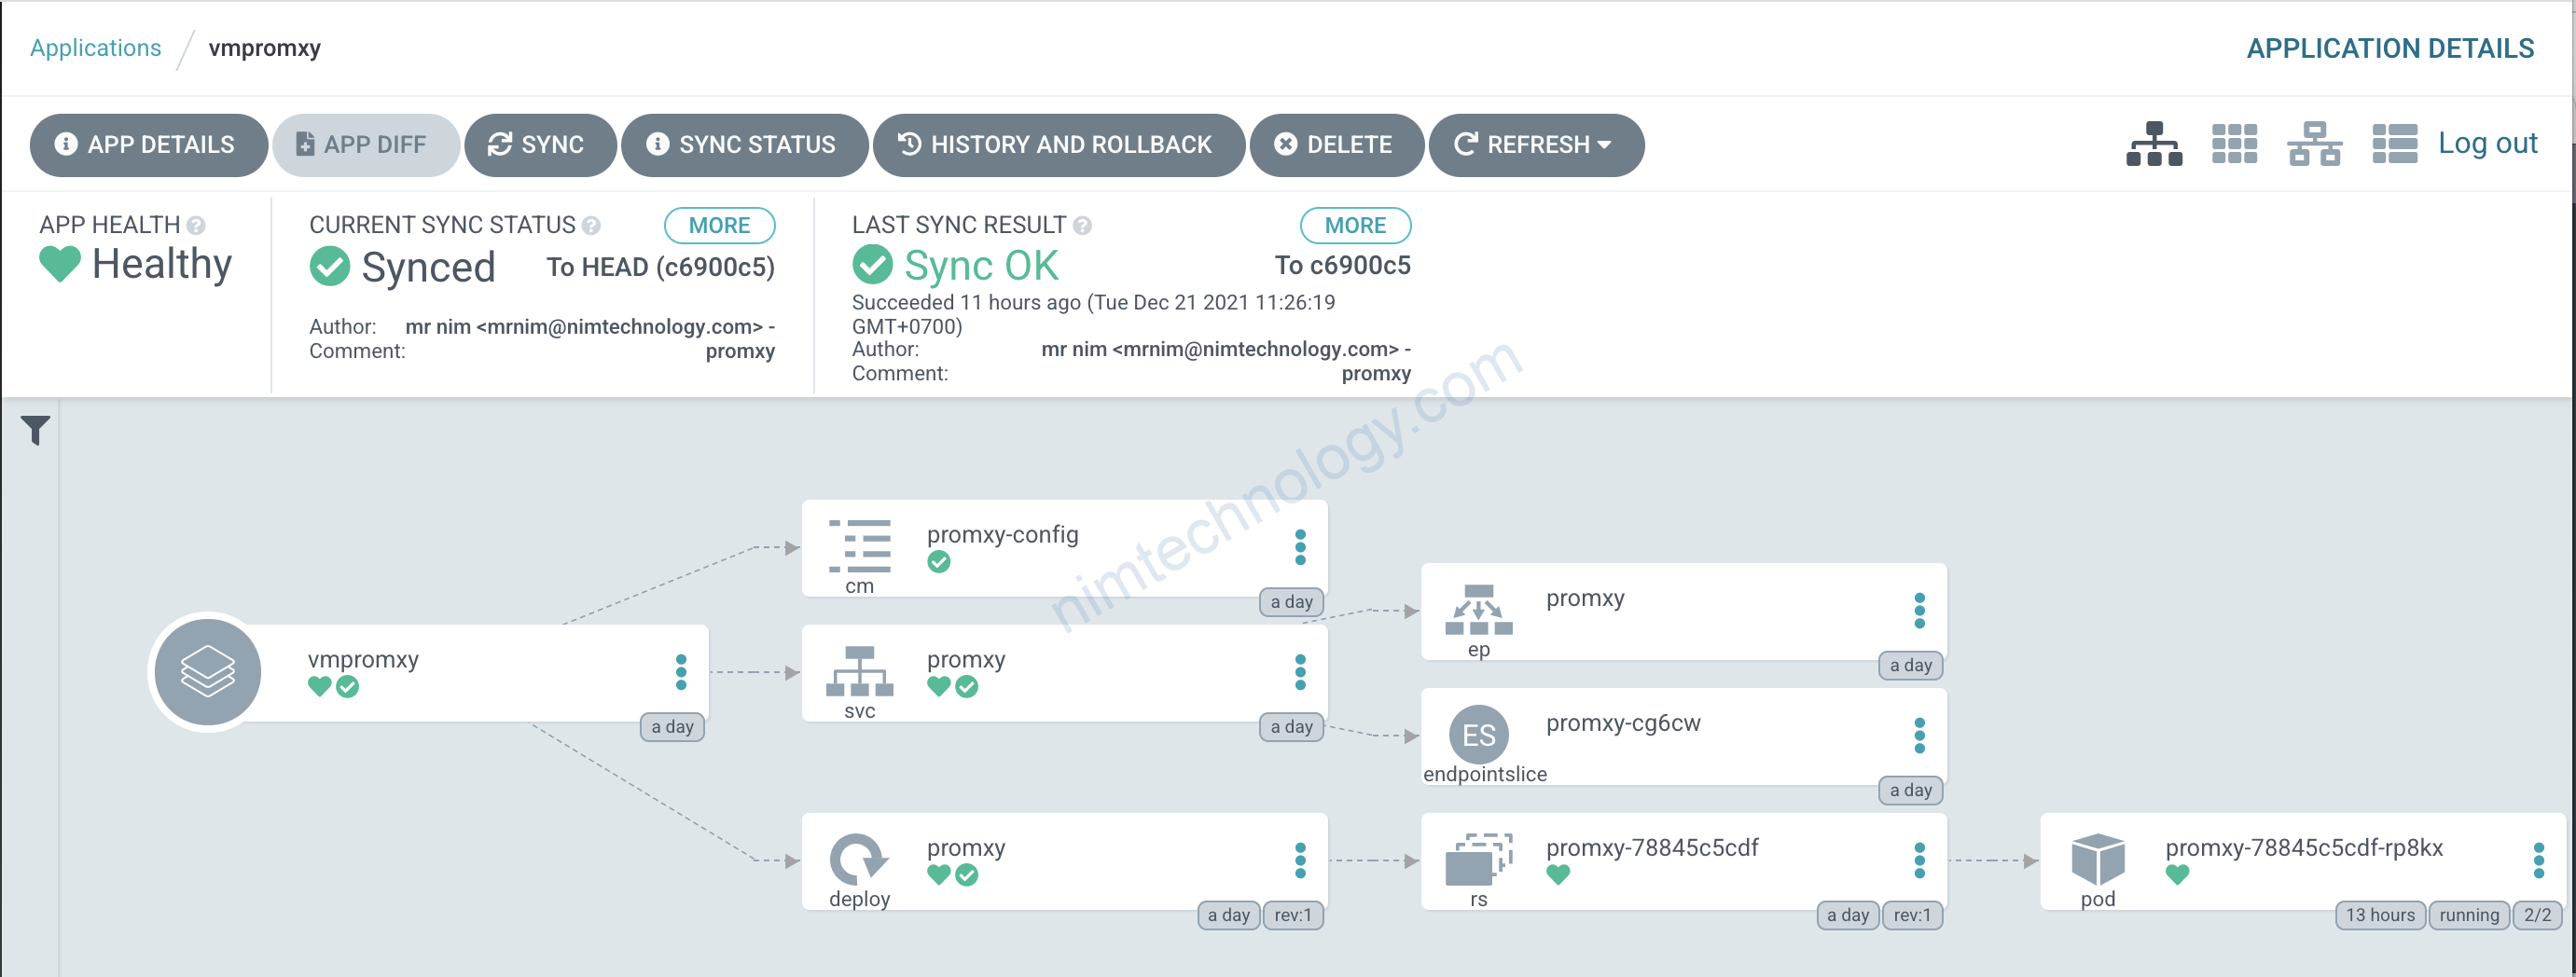
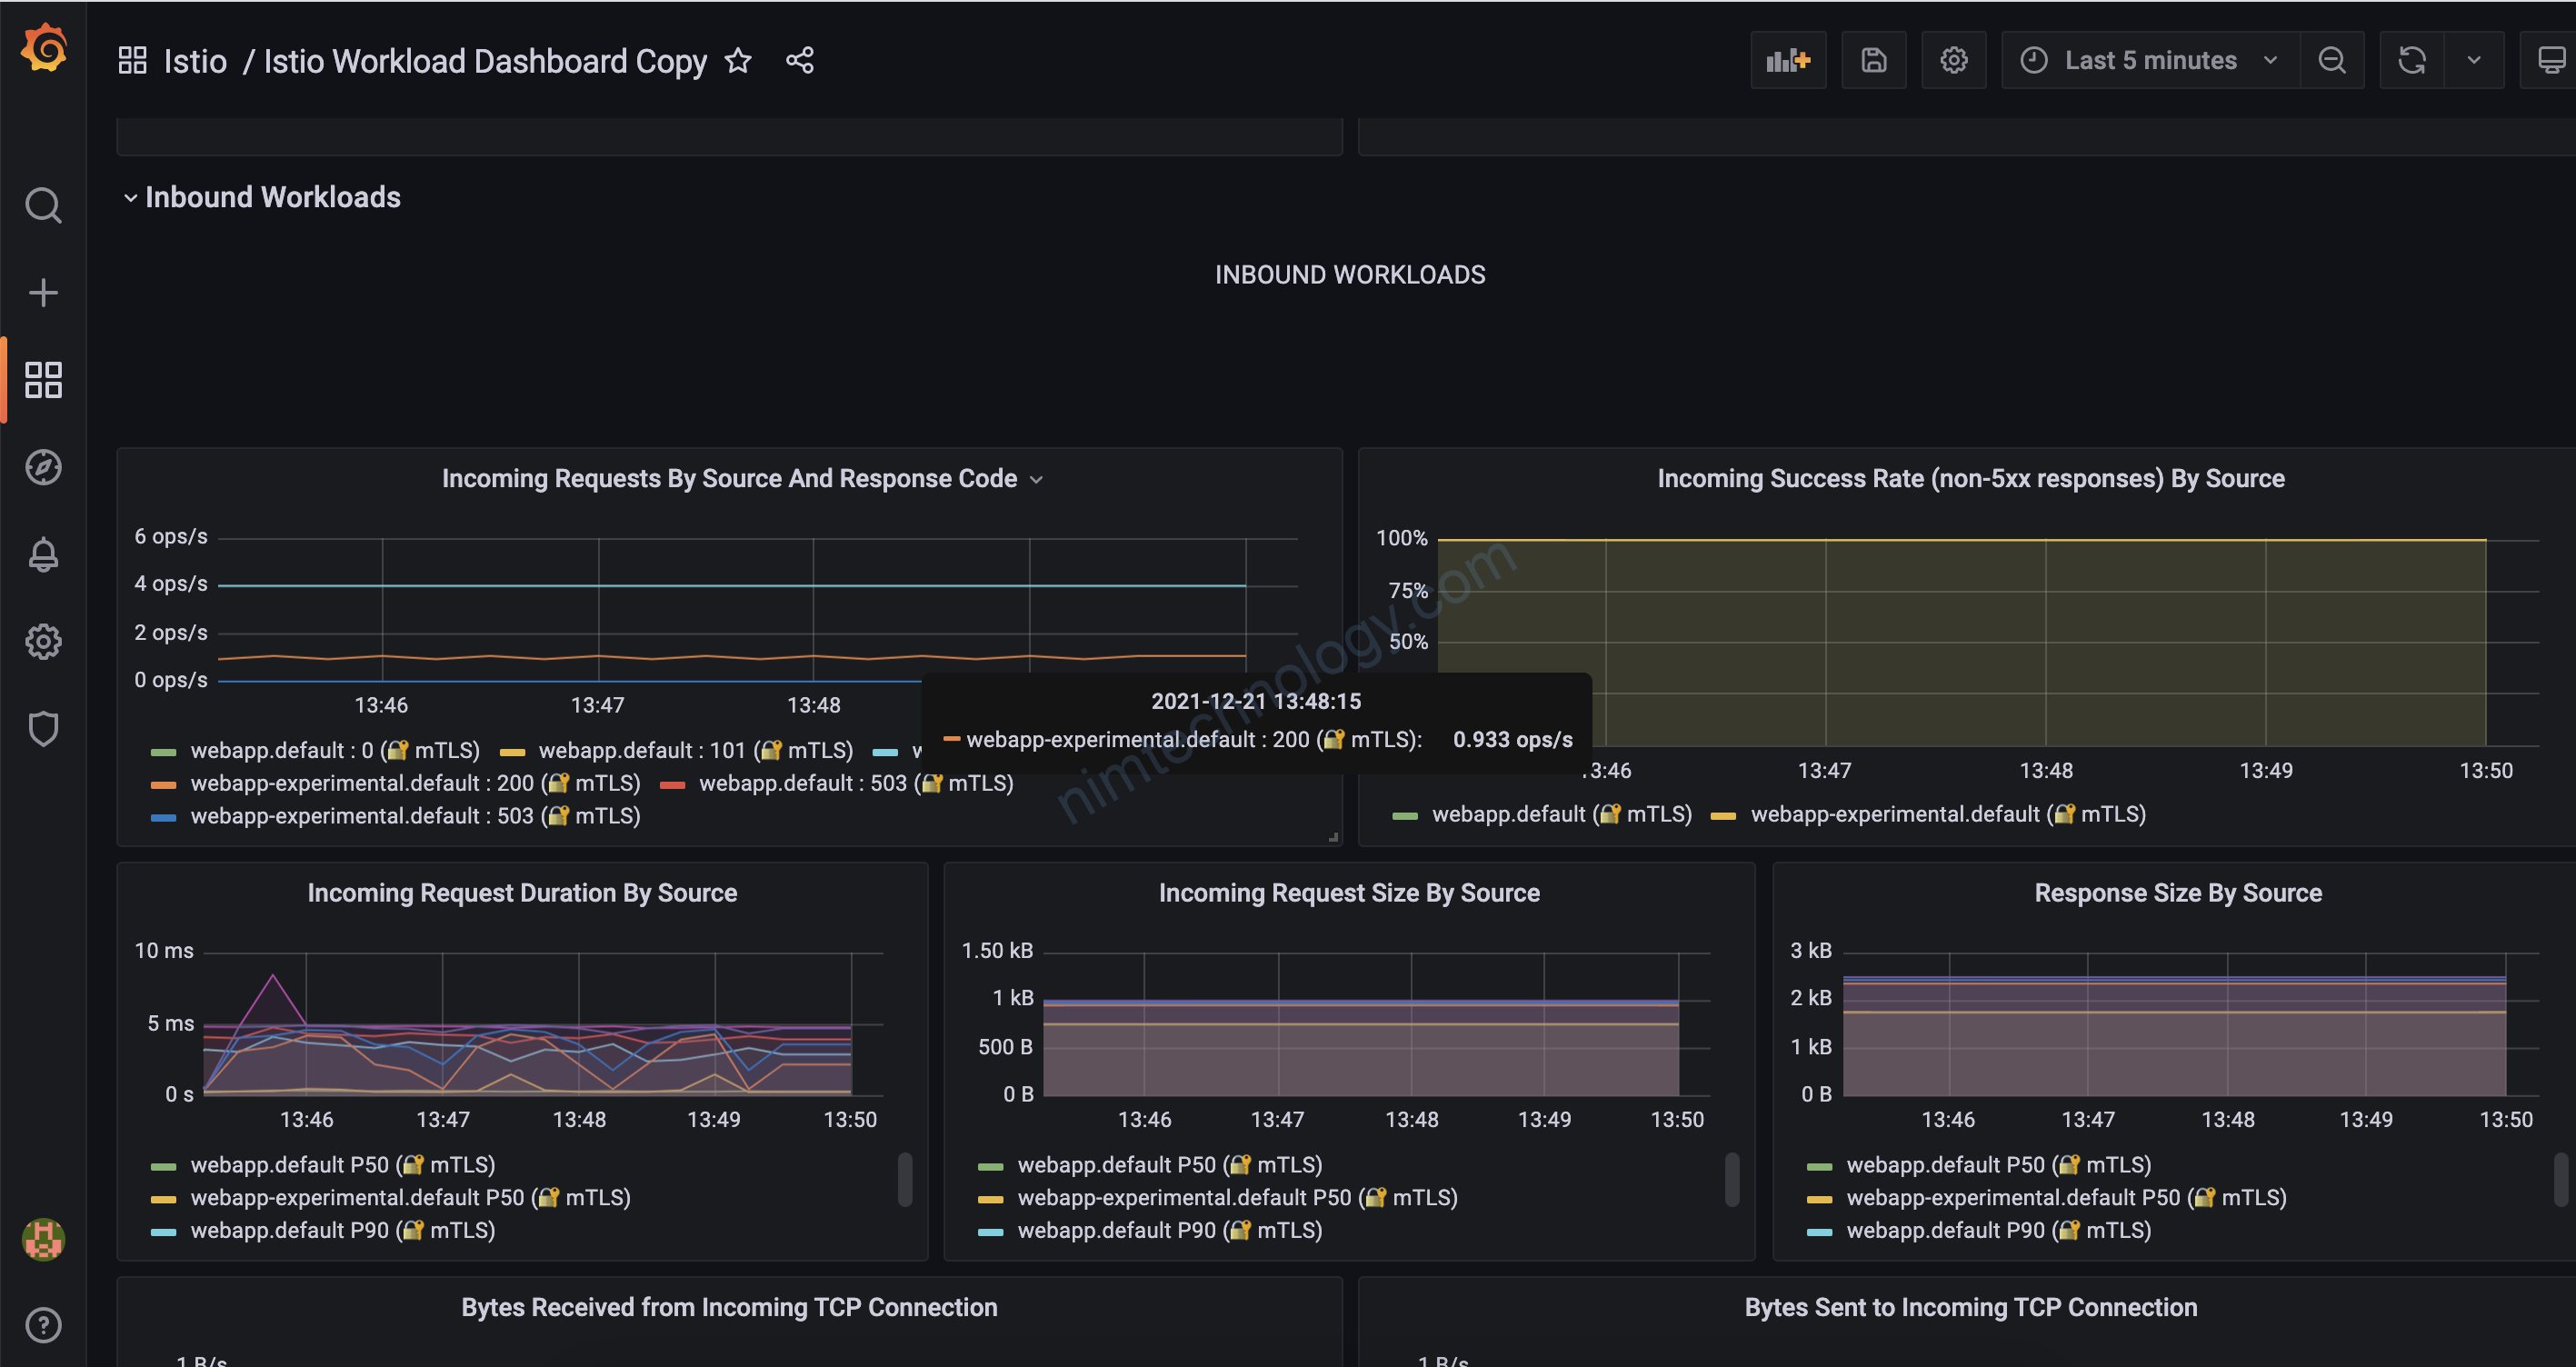
Rất tiện để anh em mình kiếm tra luôn metric bên trong VictoriaMetrics như thế nào.
3) Problem
3.1) resolve
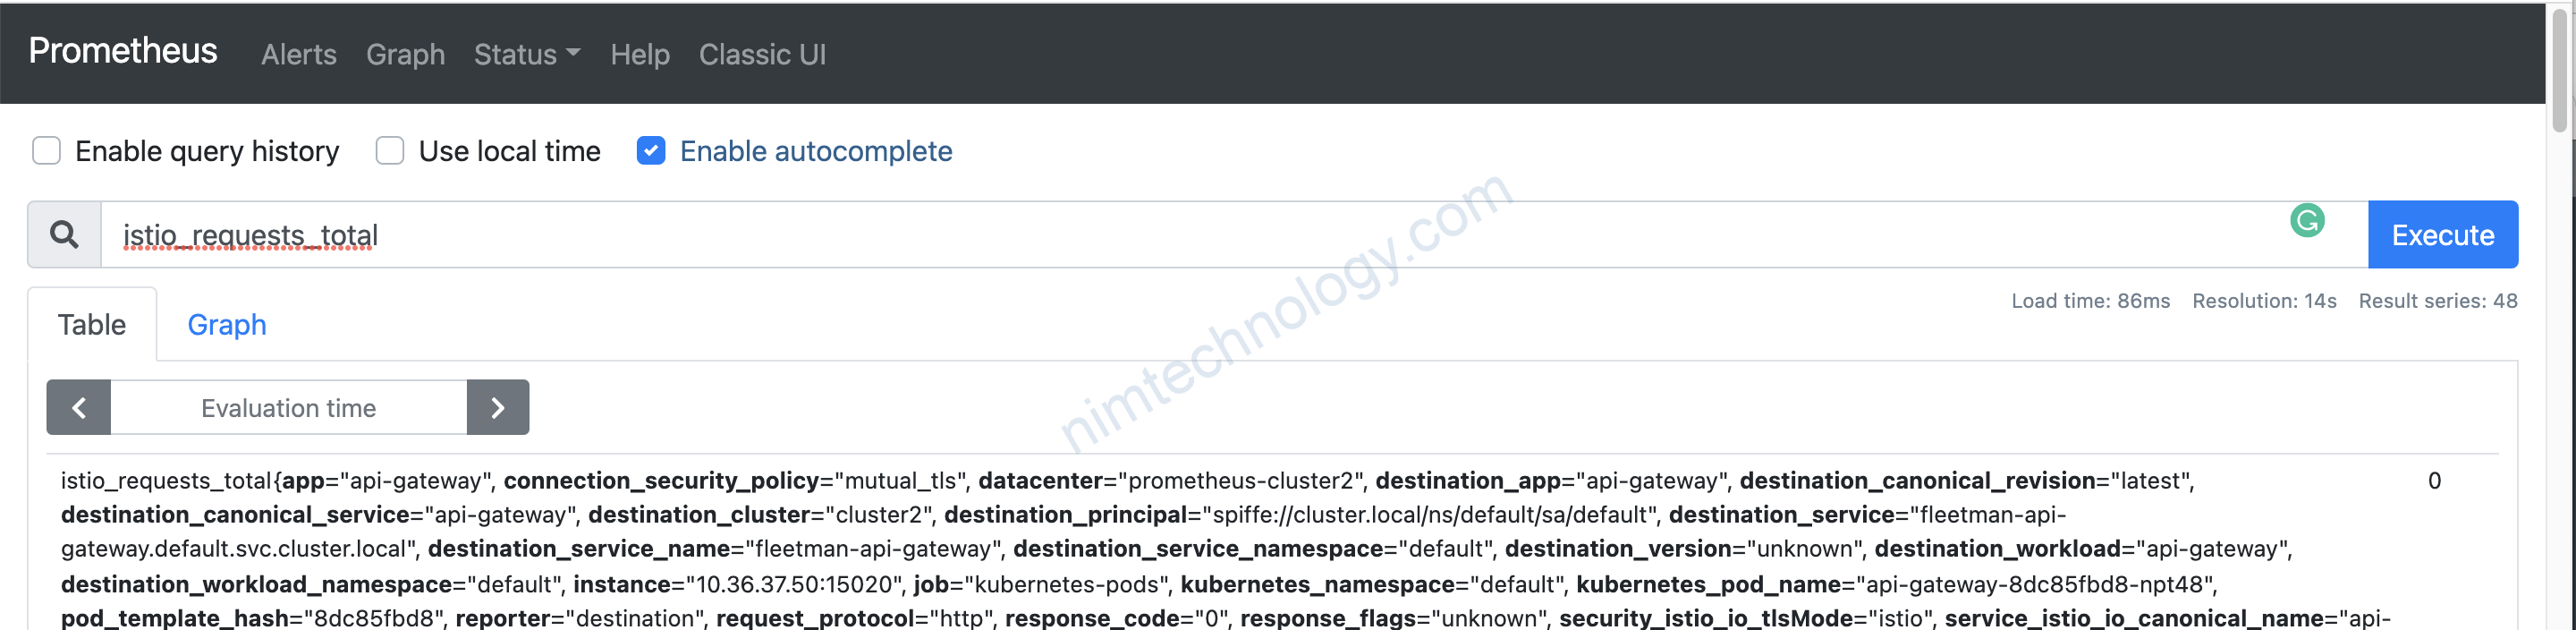
Có 1 vấn đề mà mình gặp ngay là:
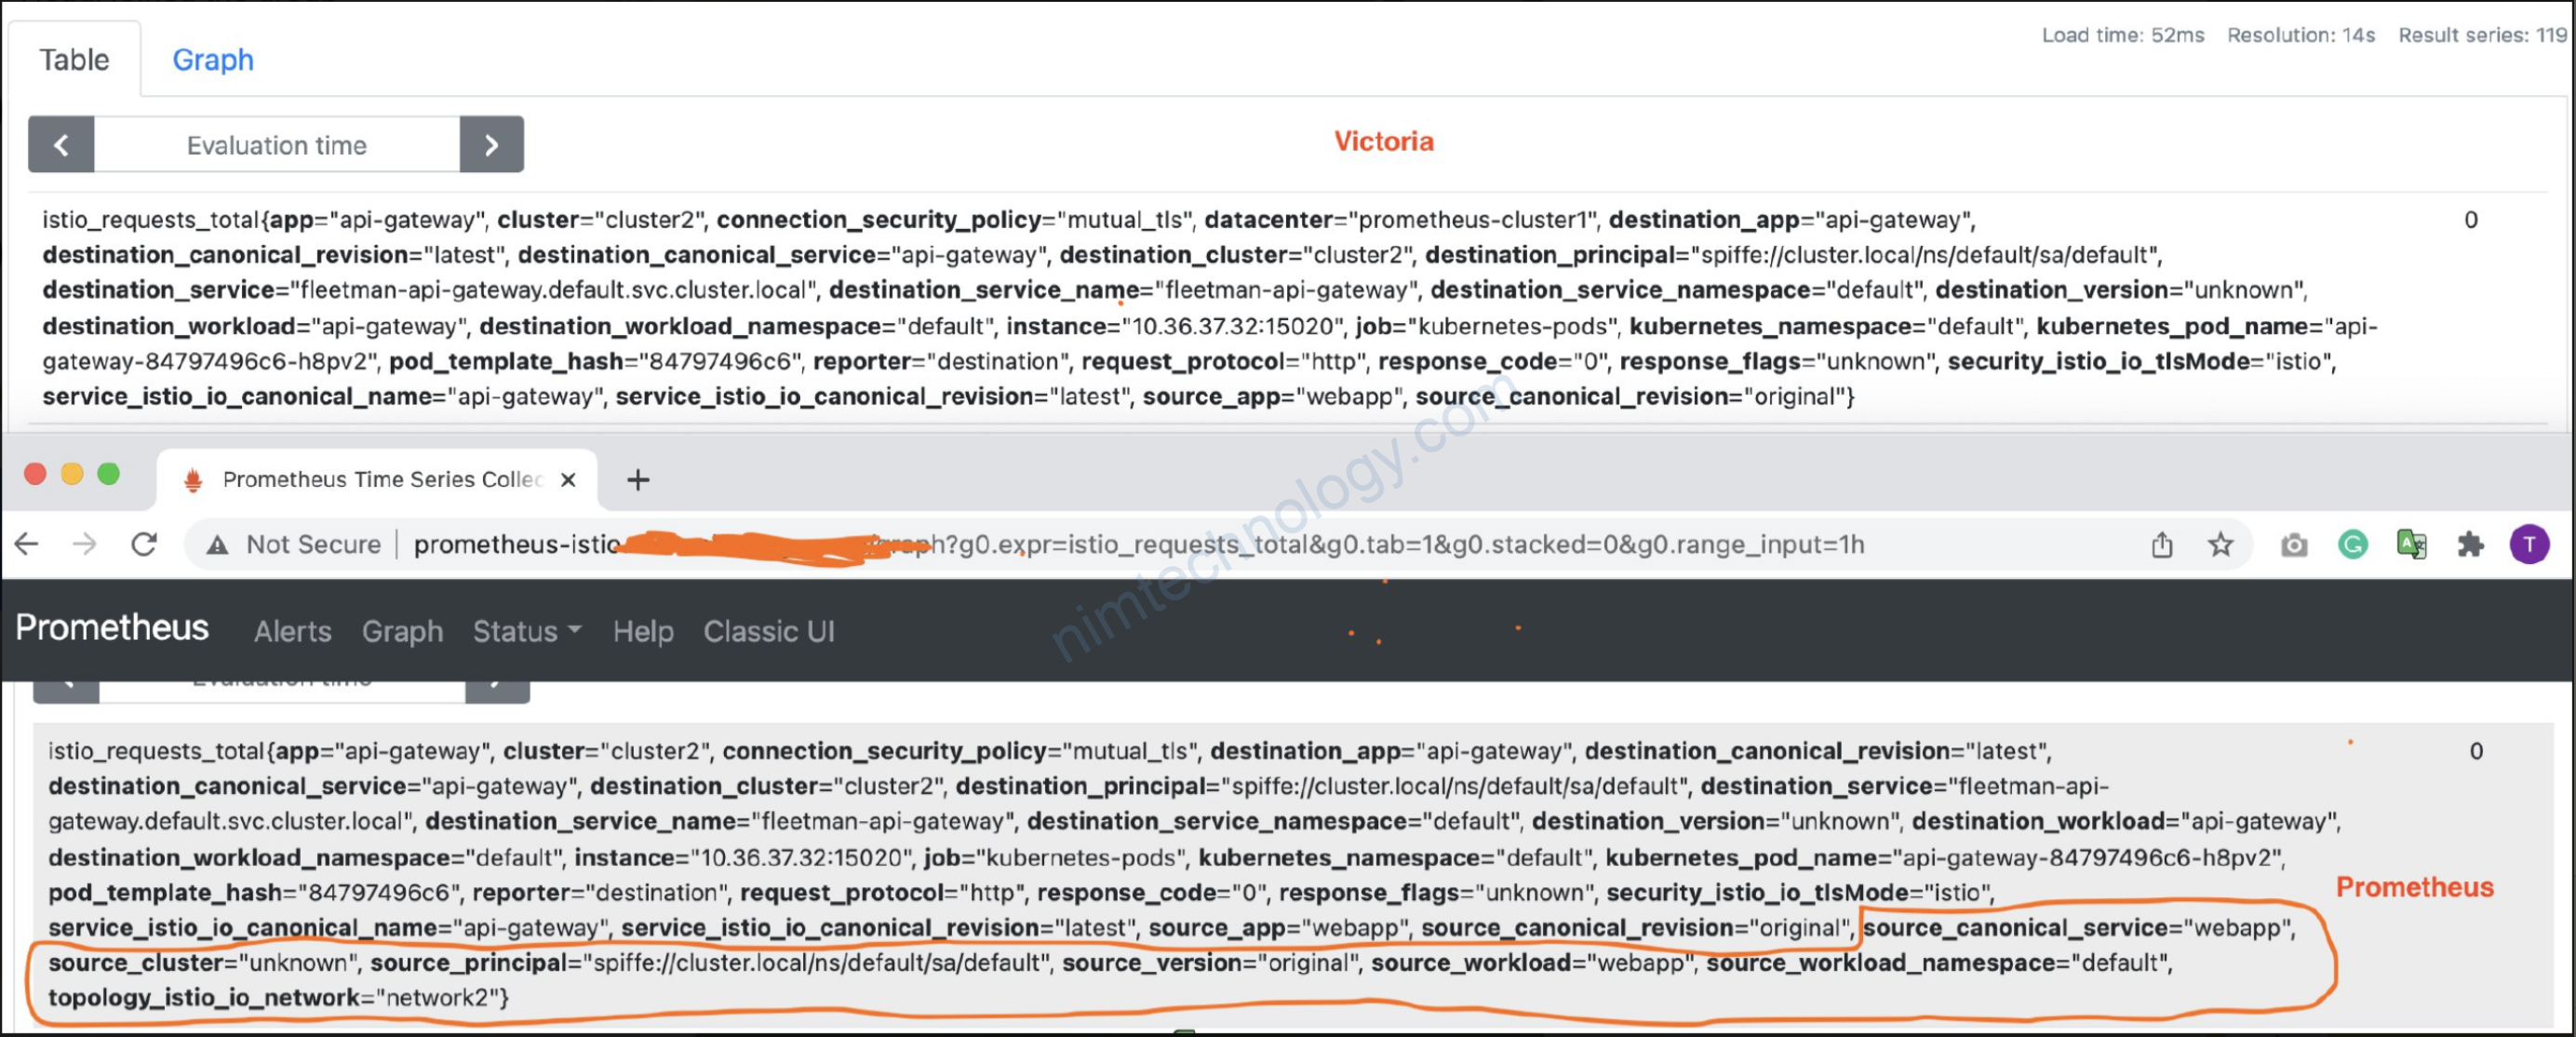
Metrics bị drop label trong gửi sang victoria????
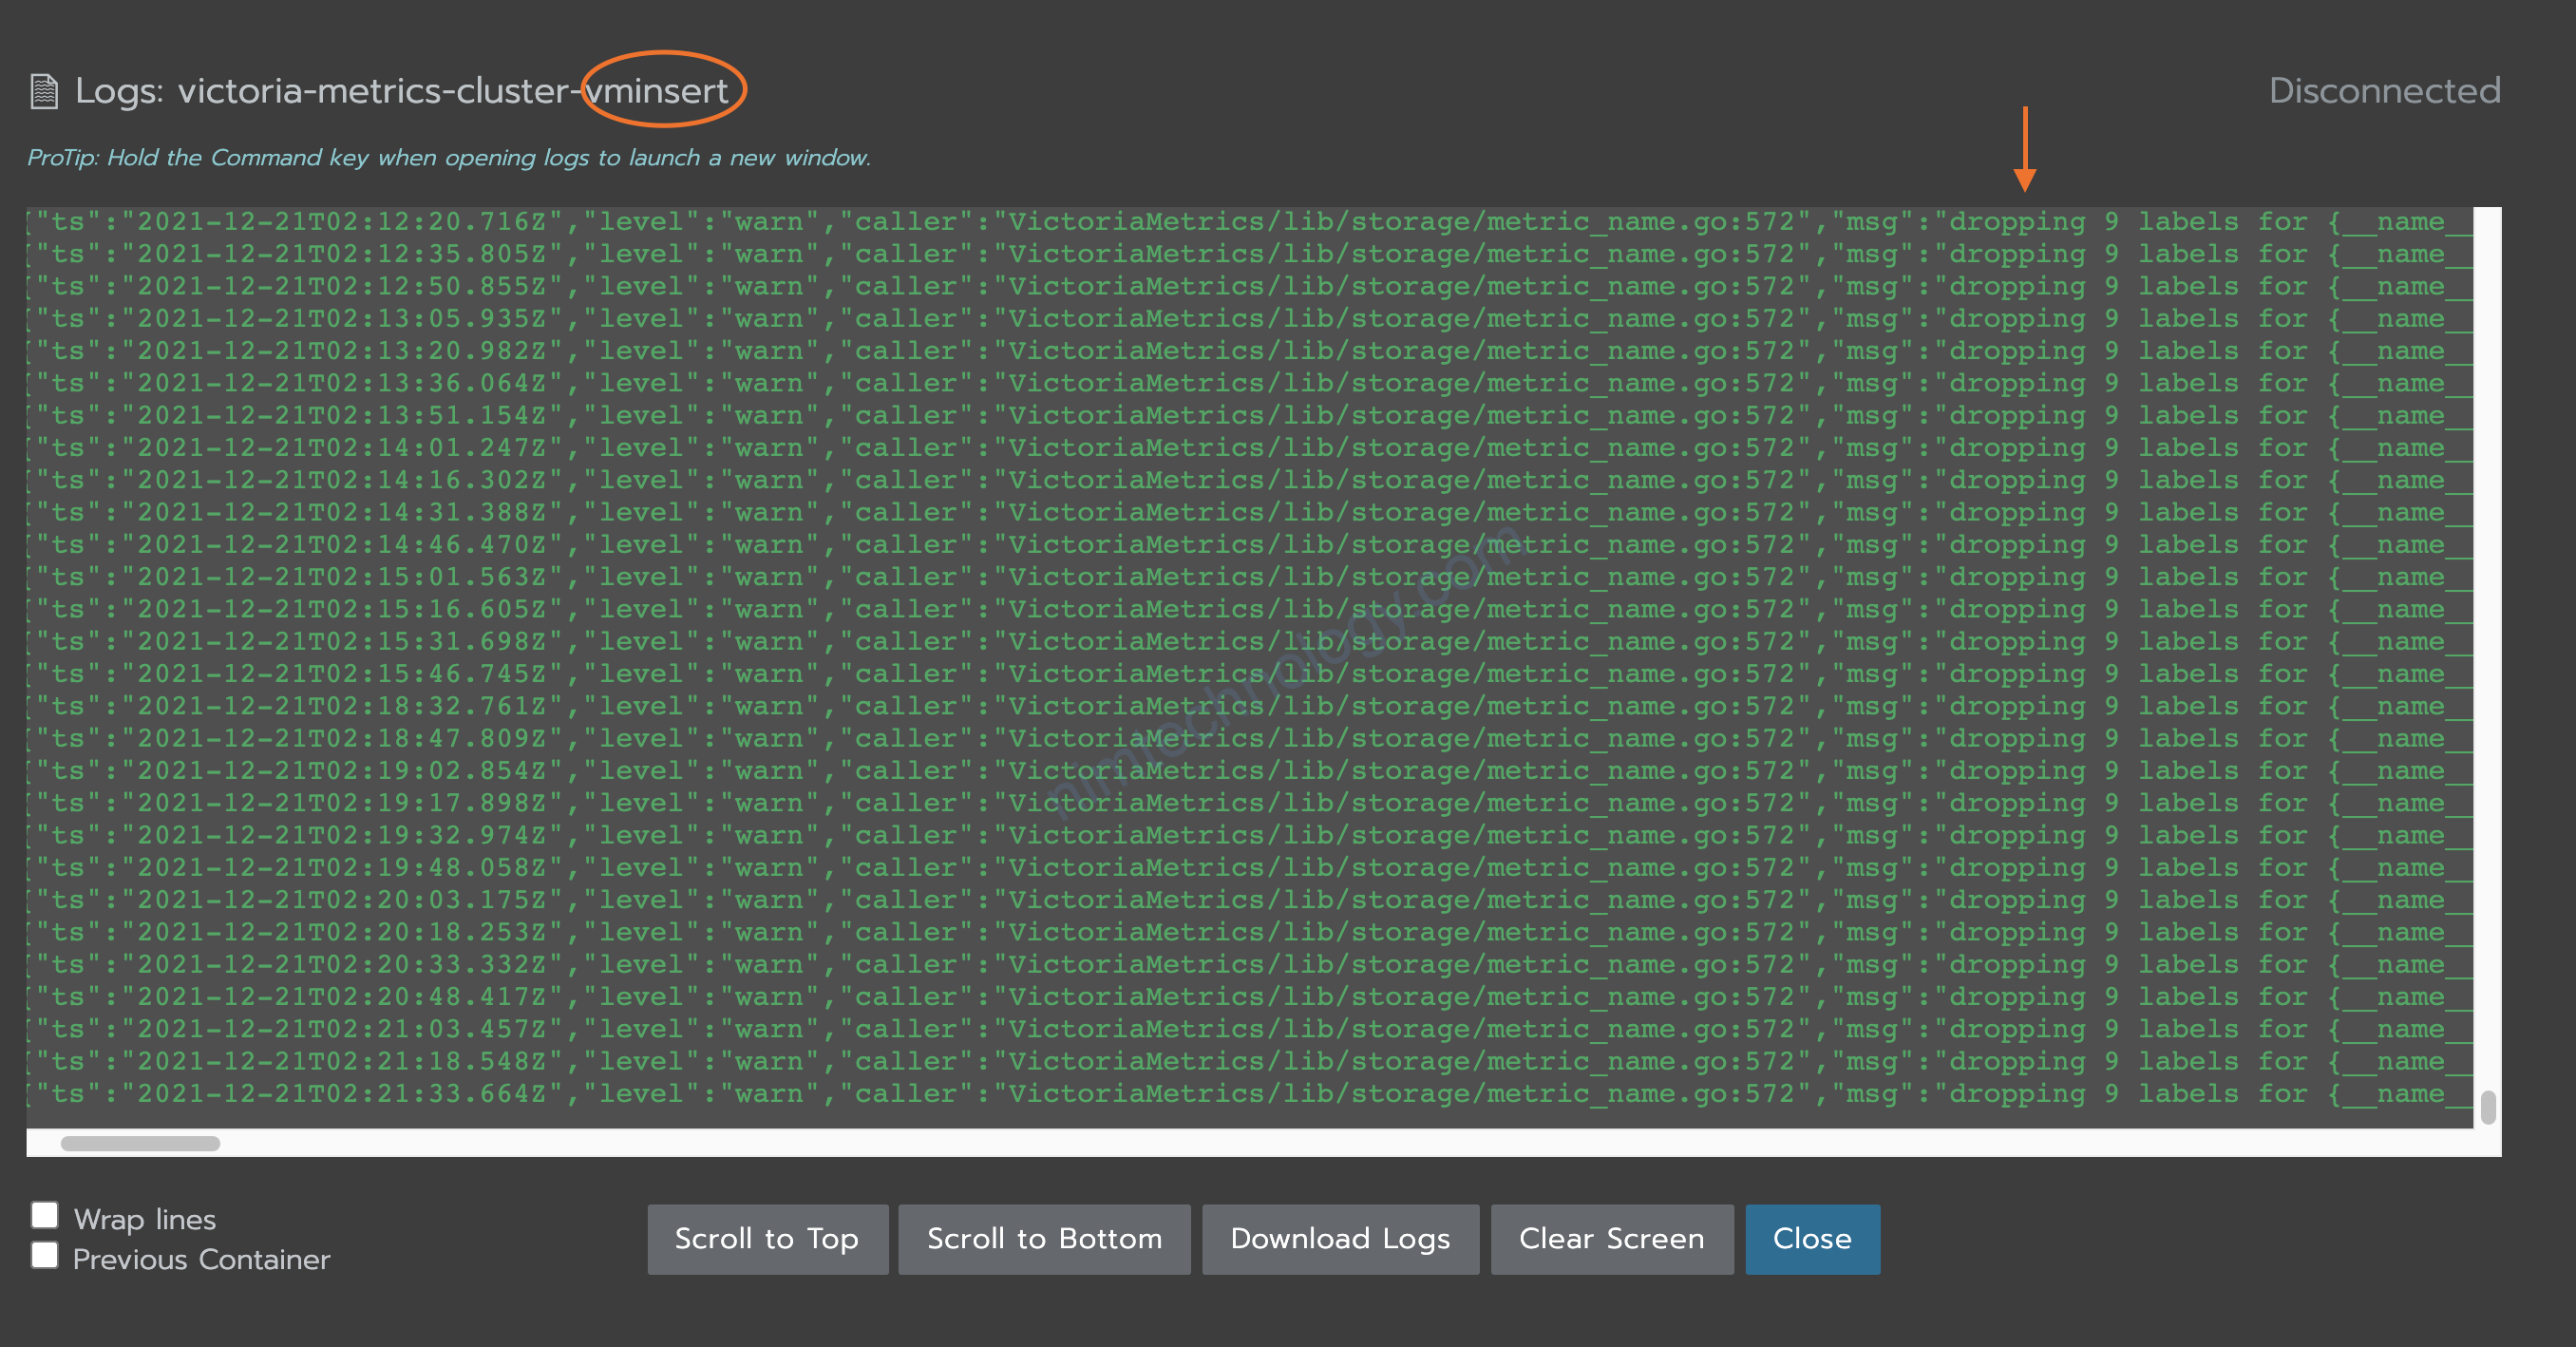
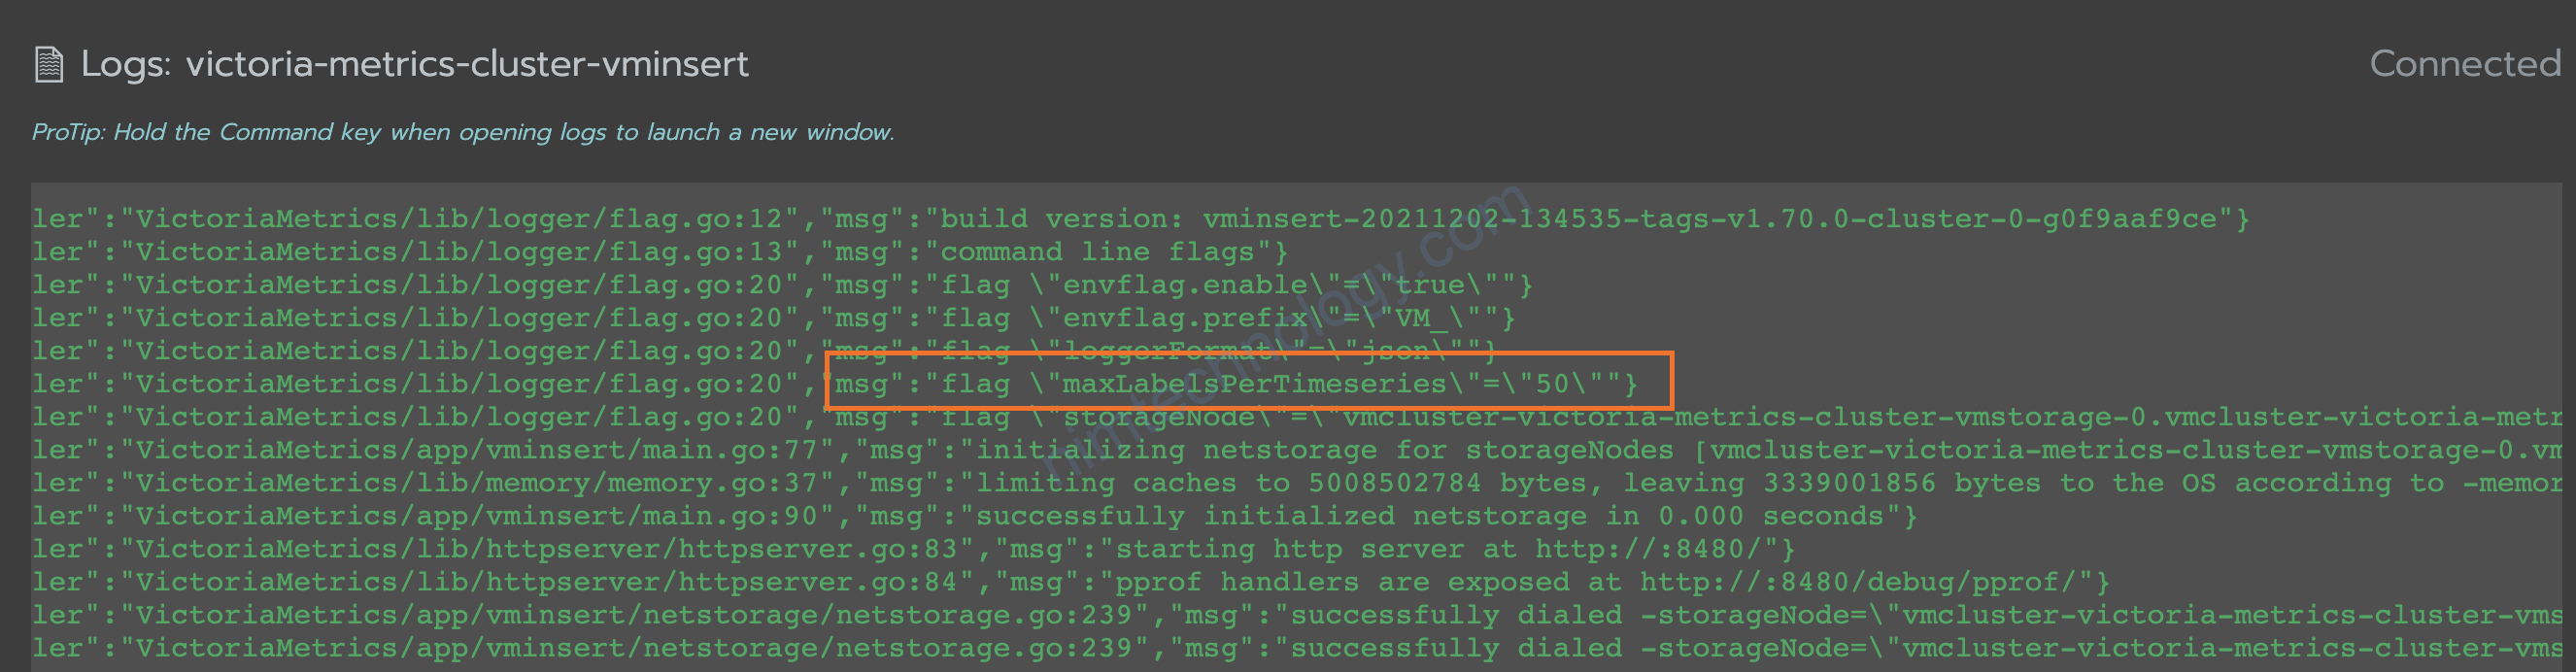
Xong coi log mới biết là do vminsert Drop label
https://golangrepo.com/repo/VictoriaMetrics-VictoriaMetrics-go-database#troubleshooting
anh em nhớ đọc cài này, nó có các vấn đề mà anh em sẽ gặp phải.
VictoriaMetrics limits the number of labels per each metric with -maxLabelsPerTimeseries command-line flag. This prevents from ingesting metrics with too many labels. It is recommended monitoring vm_metrics_with_dropped_labels_total metric in order to determine whether -maxLabelsPerTimeseries must be adjusted for your workload.
  -maxLabelsPerTimeseries int
    	The maximum number of labels accepted per time series. Superfluous labels are dropped. In this case the vm_metrics_with_dropped_labels_total metric at /metrics page is incremented (default 30)
Giờ chúng ta cần thêm “maxLabelsPerTimeseries” vào Argument của vminsert
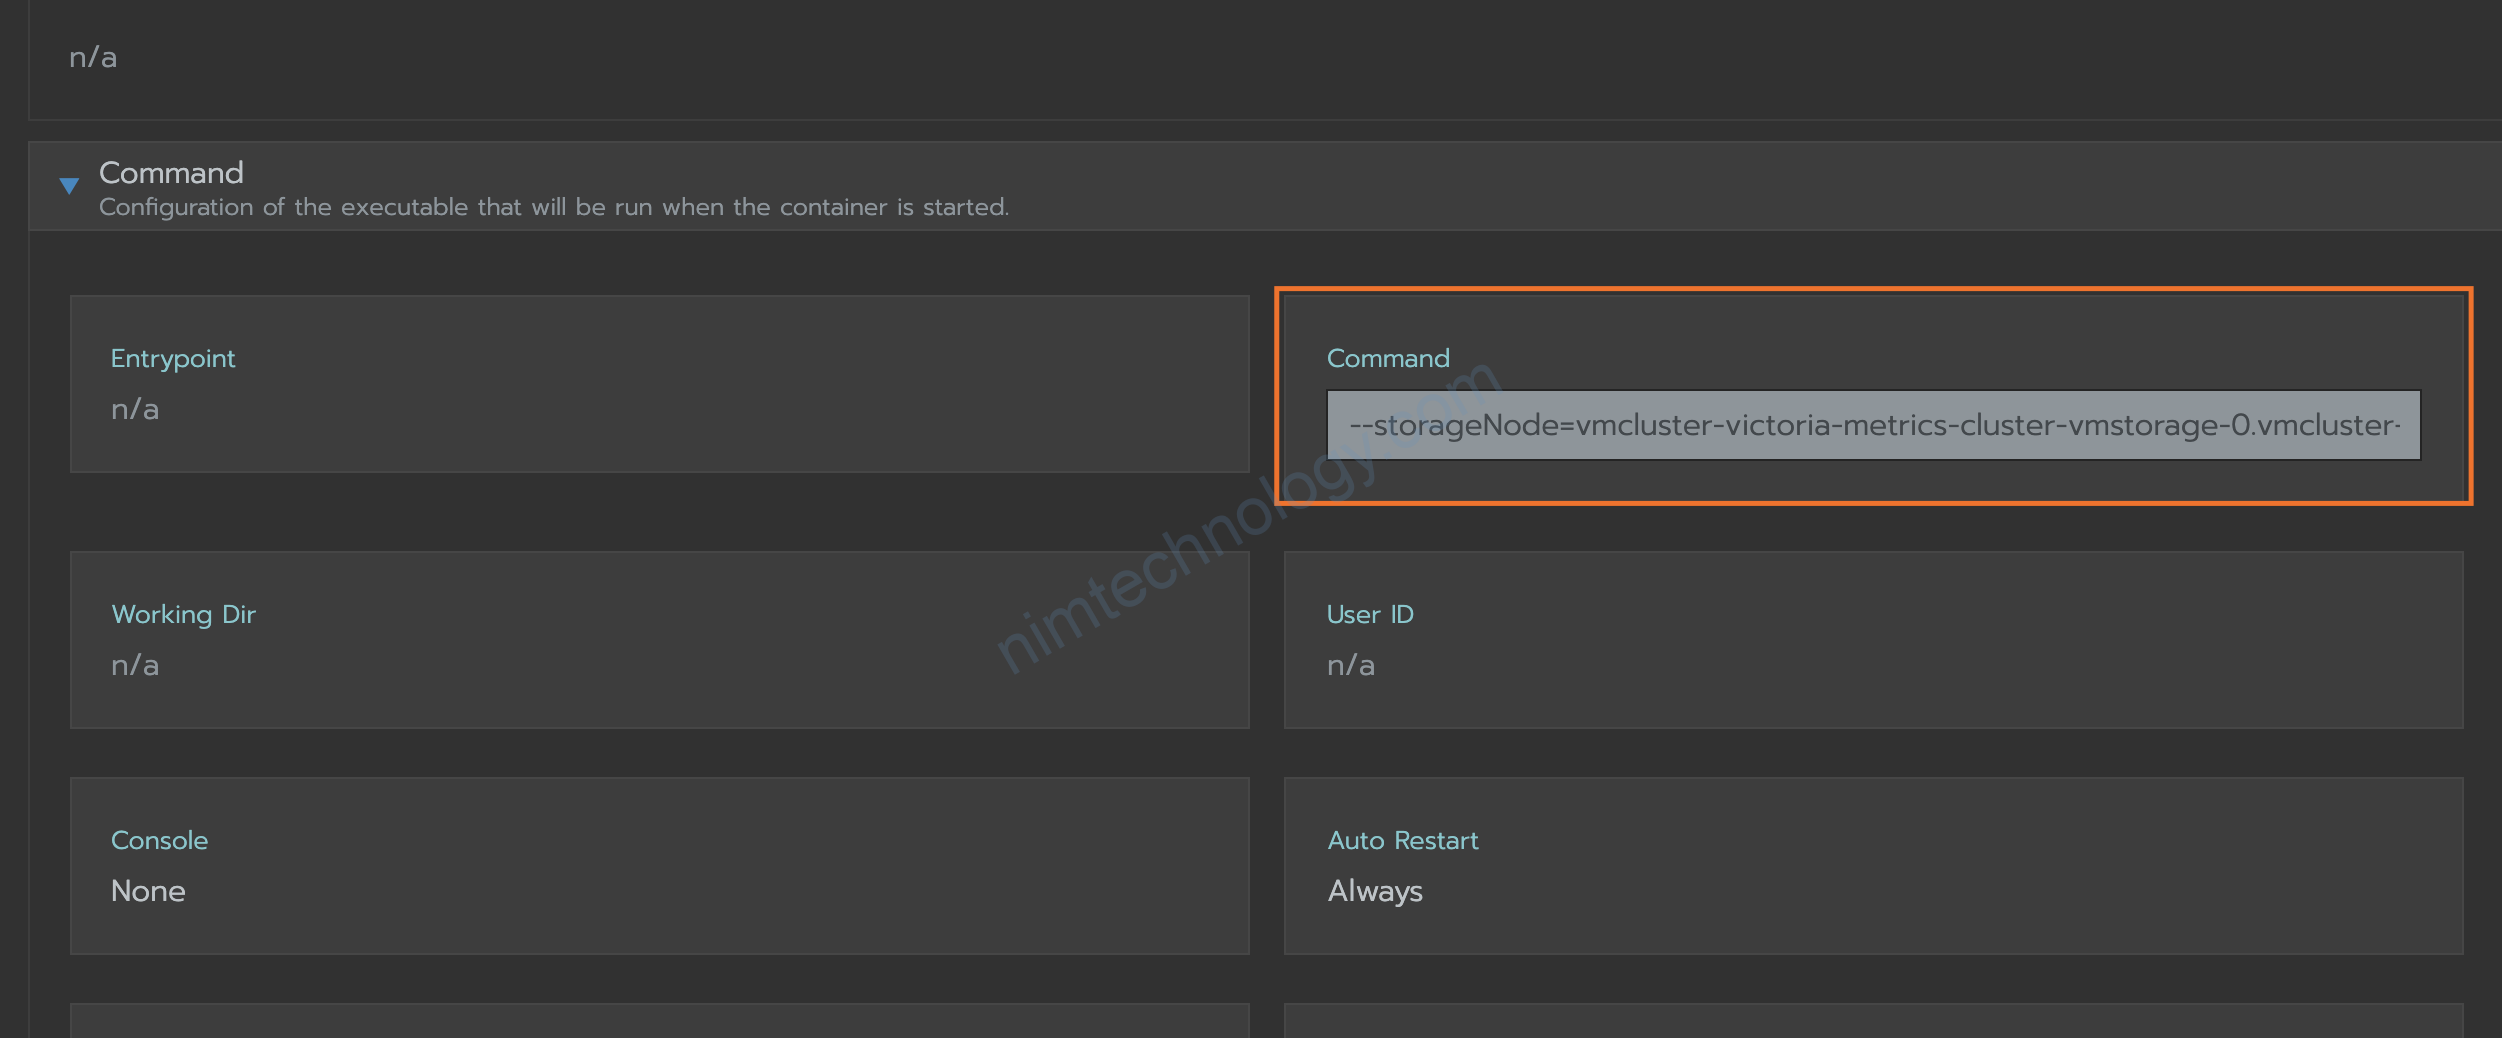
    spec:
      automountServiceAccountToken: true
      containers:
      - args:
        - --storageNode=vmcluster-victoria-metrics-cluster-vmstorage-0.vmcluster-victoria-metrics-cluster-vmstorage.vm.svc.cluster.local:8400
        - --storageNode=vmcluster-victoria-metrics-cluster-vmstorage-1.vmcluster-victoria-metrics-cluster-vmstorage.vm.svc.cluster.local:8400
        - --envflag.enable=true
        - --envflag.prefix=VM_
        - --loggerFormat=json
        - --maxLabelsPerTimeseries=50
Giờ bạn config send metrics từ Prometheus -> victoria metrics.
apiVersion: v1
data:
  alerting_rules.yml: |
    {}
  alerts: |
    {}
  prometheus.yml: |
    global:
      external_labels:
        datacenter: prometheus-cluster1
      scrape_interval: 15s
      scrape_timeout: 10s
    remote_write:
      - url: "http://vmcluster-victoria-metrics-cluster-vminsert.vm.svc.cluster.local:8480/insert/0/prometheus"
        queue_config:
          max_samples_per_send: 20000
          capacity: 30000
          max_shards: 100
Bạn nhớ để ý phần này nhe “/insert/0/prometheus” có thời gian mình sẽ tìm hiểu sau về path này.
Để đơn giản thì bạn cứ hiểu là đây path mà prometheus gửi vào thì tý bạn ghét cho đúng.
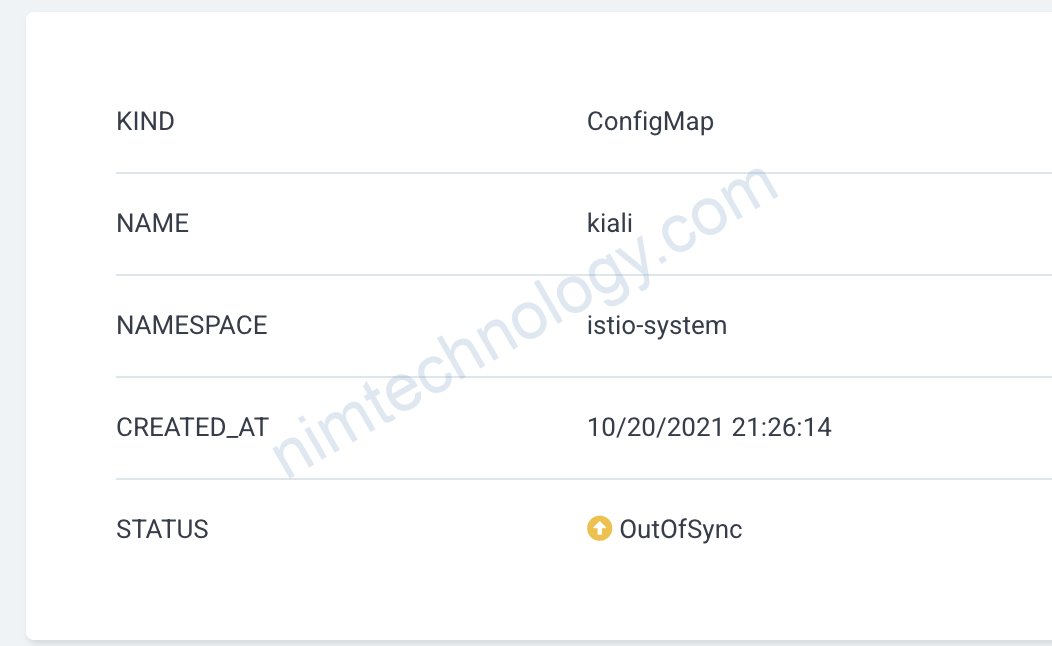
3.2) Config kiali.
Giờ mình cấu hình kiali đọc Victoria.
https://kiali.io/docs/faq/istio-component-status/
    external_services:
      prometheus:
        url: "http://vmcluster-victoria-metrics-cluster-vmselect.vm.svc.cluster.local:8481/select/0/prometheus/"
      custom_dashboards:
        enabled: true
Mình trở ra kiali thì thấy nó đọc được các bạn ạ.
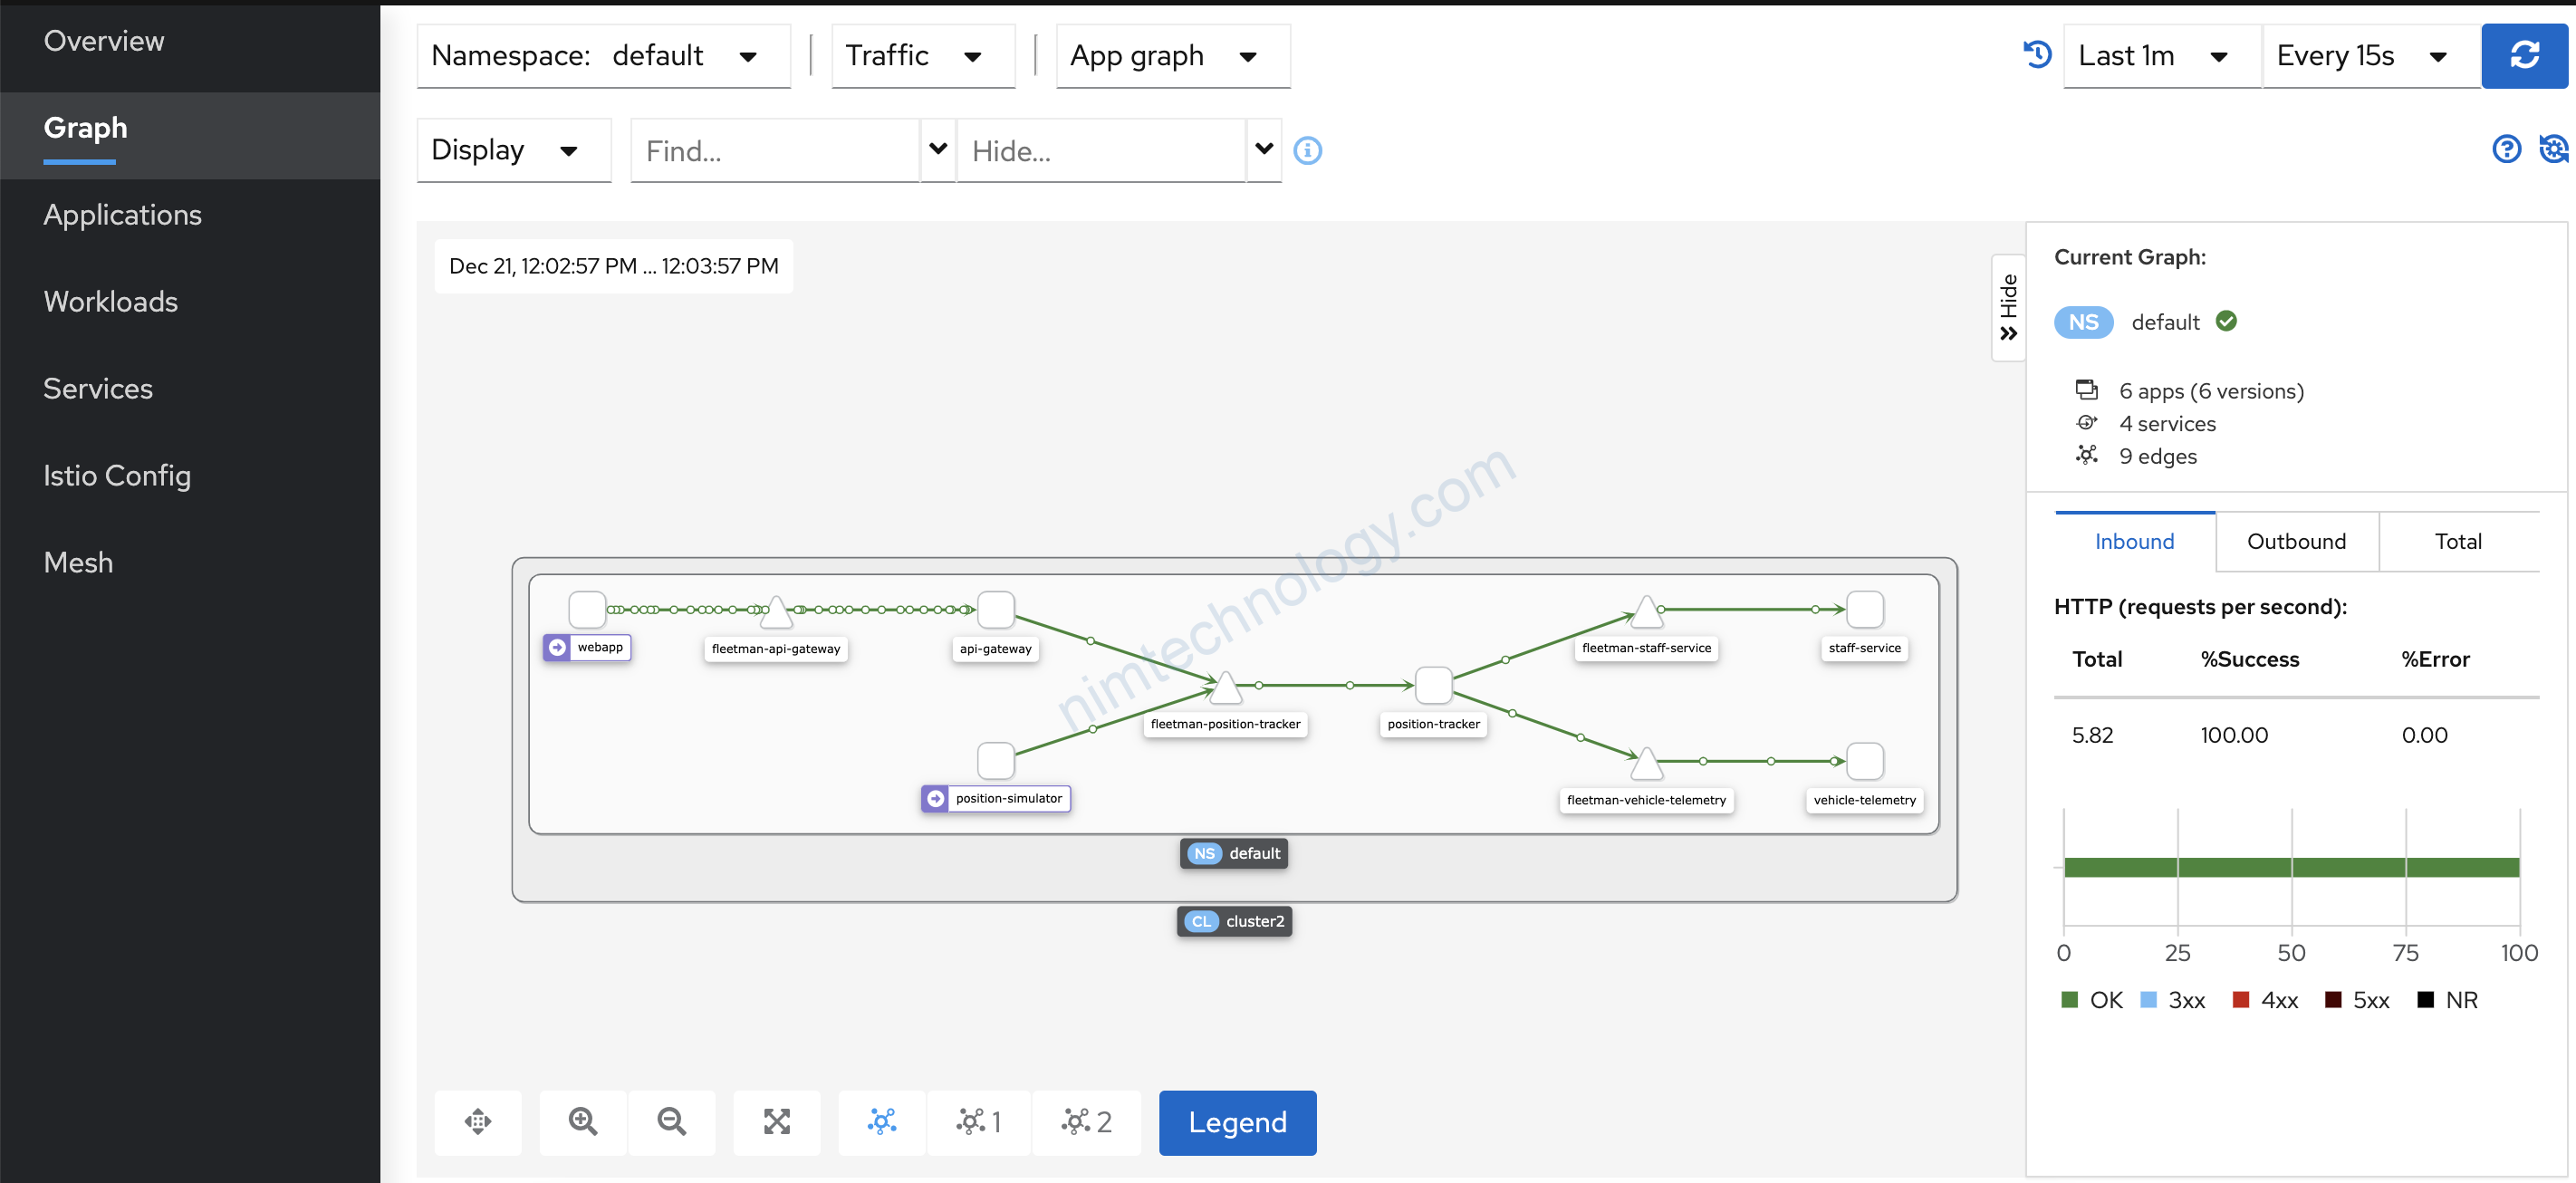
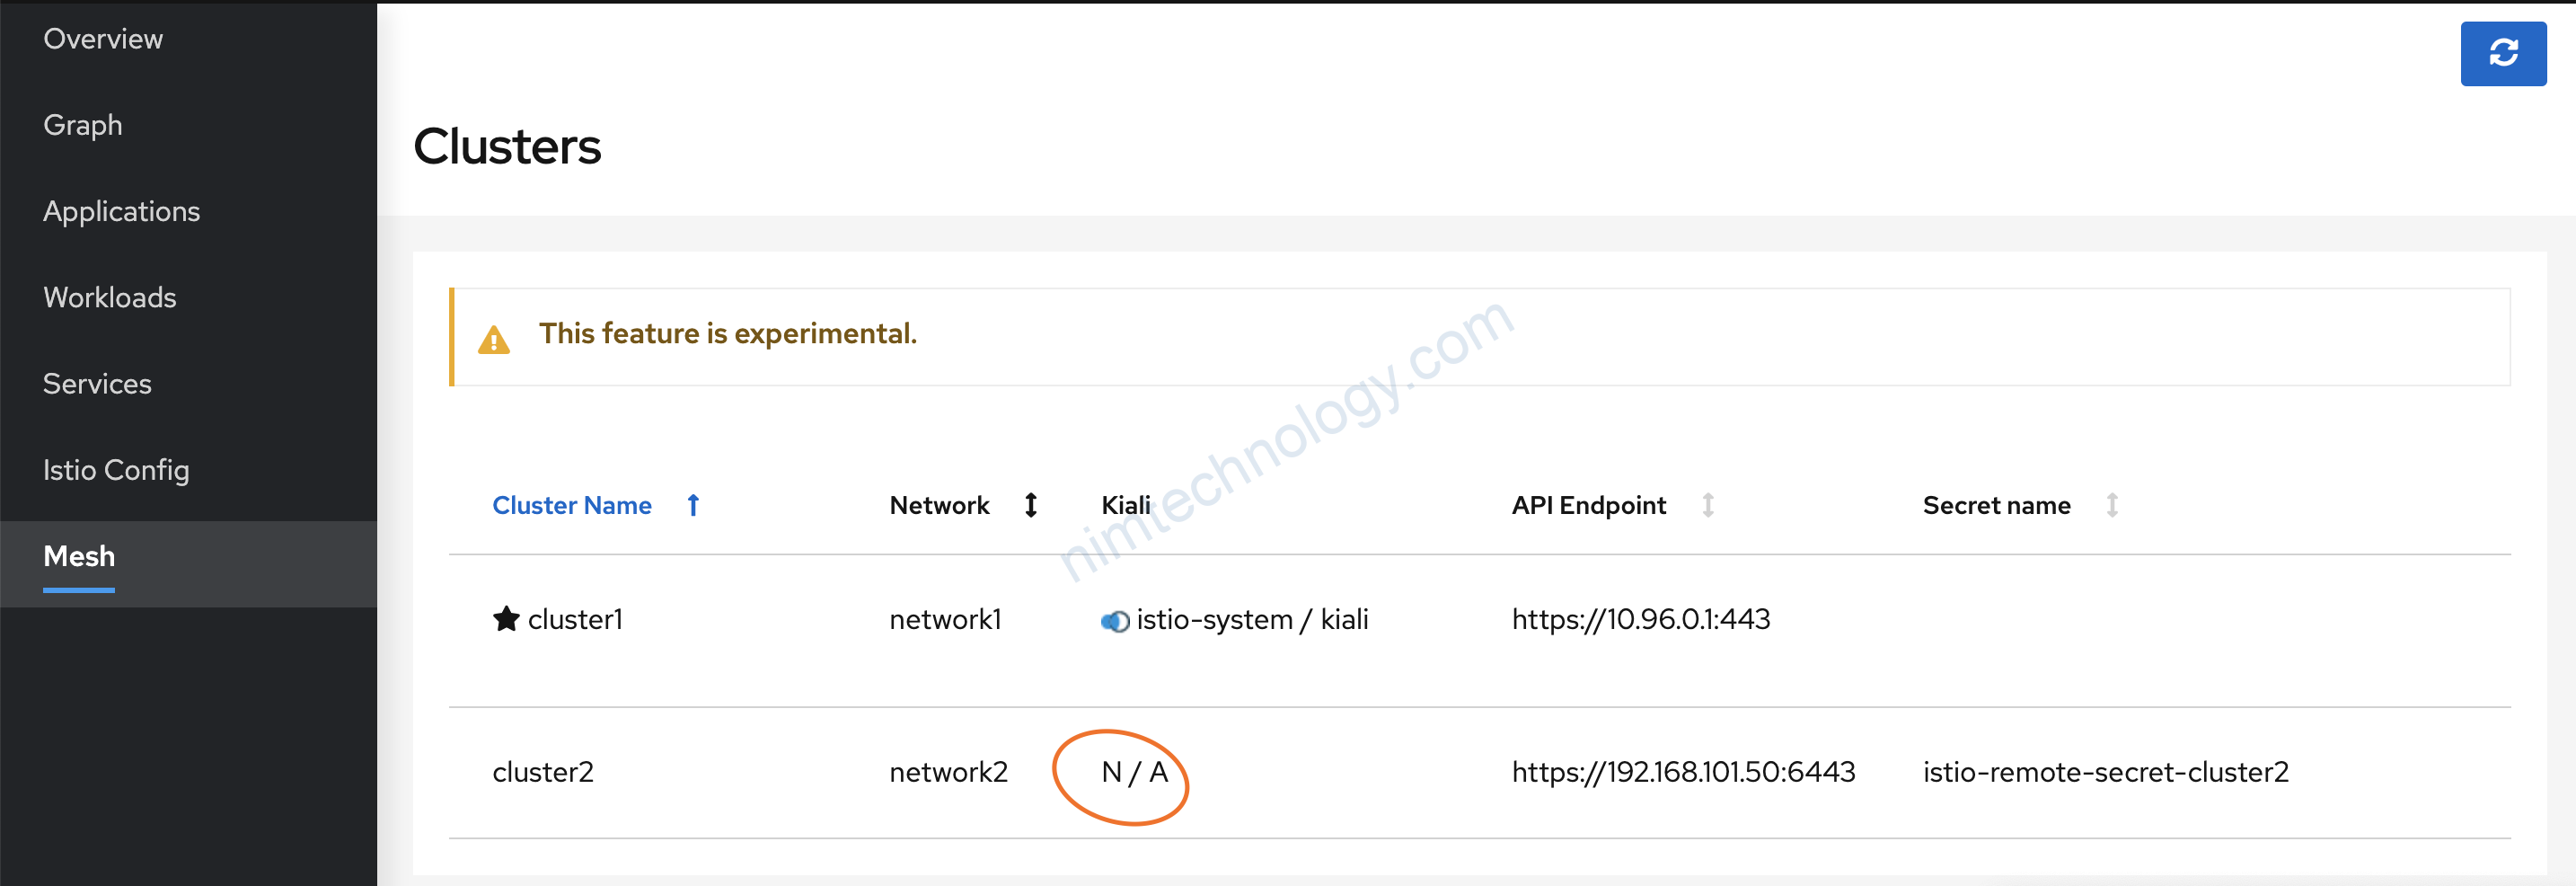
Vẫn chạy ngon lành he.
Chứng tó là kiali chỉ cần lấy metrics từ Prometheus là ngon òi.
4) Materials to refer to.
https://segmentfault.com/a/1190000040075964
mình note tạm
https://mojo-zd.github.io/2019/06/26/promtheus-VictoriaMetrics%E7%BB%84%E5%90%88%E6%8A%80/
https://www.joyk.com/dig/detail/1558605608214852?page=3#how-to-apply-new-config–upgrade-victoriametrics
https://segmentfault.com/a/1190000022809727
https://golangrepo.com/repo/VictoriaMetrics-VictoriaMetrics-go-database#troubleshooting
Mình note link để gợi ý. nhúng kiali vào html:
$url = "$kialiUrl/kiali/console/graph/node/namespaces/$this->namespace/applications/$this->name?edges=noEdgeLabels&layout=cose-bilkent&injectServiceNodes=true&graphType=app&duration=3600&refresh=0&unusedNodes=true&animation=true";


Hi,
I try to configure kiali to read Victoria, but it’s not working.
I have the same architecture you have.
I installed Kiali Operator helm chart.
than apply this Kiali with the following configuration:
“`
external_services:
prometheus:
cache_duration: 10
cache_enabled: true
cache_expiration: 300
url: “http://vmselect-vm-stack-victoria-metrics-k8s-stack.vm.svc.cluster.local:8481/select/0/prometheus/”
health_check_url: “http://vmselect-vm-stack-victoria-metrics-k8s-stack.vm.svc.cluster.local:8481/health”
“`
From the kiali pod I can call the external_service but in the UI there is no data.
Any advise please?
You can refer to this links: https://nimtechnology.com/2021/12/21/victoriametrics-grafana-prometheus-kiali-victoriametrics-is-a-fast-cost-effective-and-scalable-time-series-database/#3_Problem
Because victoria-metrics will drop labels if it is greater than 30 labels.