1) Overview of the situation.
Tình huống là như sau:
Bạn có 1 đoạn log trên hệ thông như sau:
time="2023-12-12T17:32:44Z" level=info msg="getRepoObjs stats" application=argocd/longhorn build_options_ms=0 helm_ms=14 plugins_ms=0 repo_ms=13 time_ms=126 unmarshal_ms=97 version_ms=0Manager talk that:

Em dùng kĩ năng của một devops vẽ cho anh 1 chart time_ms của 1 application và em có thể lấy thông tin log trên.

Sau khi dùng hết kĩ năng để search thì tôi tìm ra 2 ứng cứ viên sáng giá là Logstash và Vector

Logstash thì thuộc họ nhà ELK một tool để control log rất nổi tiếng.
thanh niên này khá là nhanh, tuổi đời lâu, nên document cũng đầy đủ.
Có 1 điều mình không thích ở thanh niên này là nó ăn nhiều RAM.
Quay qua Vector:

Một ứng cứ viên tiềm năng, được việt bằng ngôn ngữ rust
Maybe It will be light and fast.

Ok giờ thì architecture như sau:
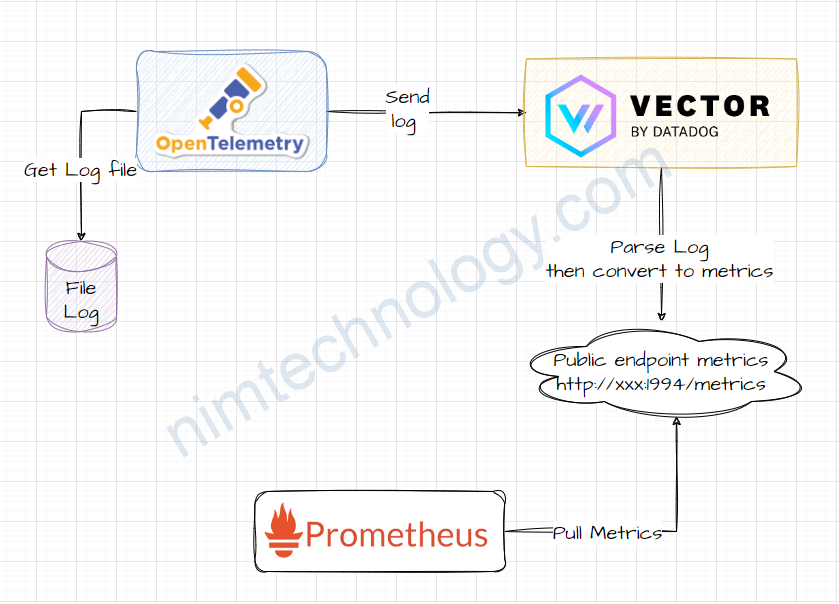
1) Opentelemetry sends the logs to Vector.
Để send logs từ otel-collector sang Vector thì mình có tham khảo 2 tài liệu.
https://www.techetio.com/2023/04/29/sending-opentelemetry-logs-to-vector-using-python/
https://intelops.ai/blog/connecting-the-opentelemetry-collector-to-vecor/
mình sẽ export logs sang cho vector thông qua otlphttp
The OTLP/HTTP exporter in the OpenTelemetry Collector is designed to send metrics, traces, and logs through HTTP using the OTLP format. This exporter supports traces, metrics, and logs pipeline types. To include it in your configuration, you need to specify certain settings:
https://github.com/open-telemetry/opentelemetry-collector/tree/main/exporter/otlphttpexporter
....
    exporters:
      otlphttp:
        endpoint: "http://vector-headless.default:4318"
....
    service:
      pipelines:
        logs:
          exporters:
          - coralogix
          - otlphttp #look at
          processors:
          - k8sattributes
          - attributes/insert
          - filter/regexp_resource
          - batch
          receivers:
          - otlp
          - filelog
2) How to configure Vector
2.1) Install vector on Kubernetes
REPO URL: https://helm.vector.dev
CHART: vector:0.29.0
Bạn có thể tùy chọn thay đôi version nếu muốn.
2.2) Vector receives, process logs from the otel-collector
2.1.1) Source:
Chỗ này chúng ta sẽ nhận log từ opentelemetry:
https://vector.dev/docs/reference/configuration/sources/opentelemetry/
customConfig:
  api:
    enabled: true
    address: 127.0.0.1:8686
    playground: true
  sources:
    otel_collector:
      type: opentelemetry
      grpc:
        address: '0.0.0.0:4317'
      http:
        address: '0.0.0.0:4318'
    # Add your log source here if needed

  sinks:
    console_logs:
      type: console
      encoding:
        codec: text
      inputs:
        - "otel_collector.logs"

service:
  ports:
    - name: otel-collector-http
      port: 4318
      protocol: TCP
    - name: metrics
      port: 9598
      protocol: TCP
Có 2 điểm chú ý: Dec 13th, 2023
The opentelemetry source only supports log events at this time.
Received log events will go to this output stream. Use <component_id>.logs as an input to downstream transforms and sinks.
Nghĩa là khi bạn khai báo input của trên another component such as sink or transform thì nó sẽ là <component_id>.logs

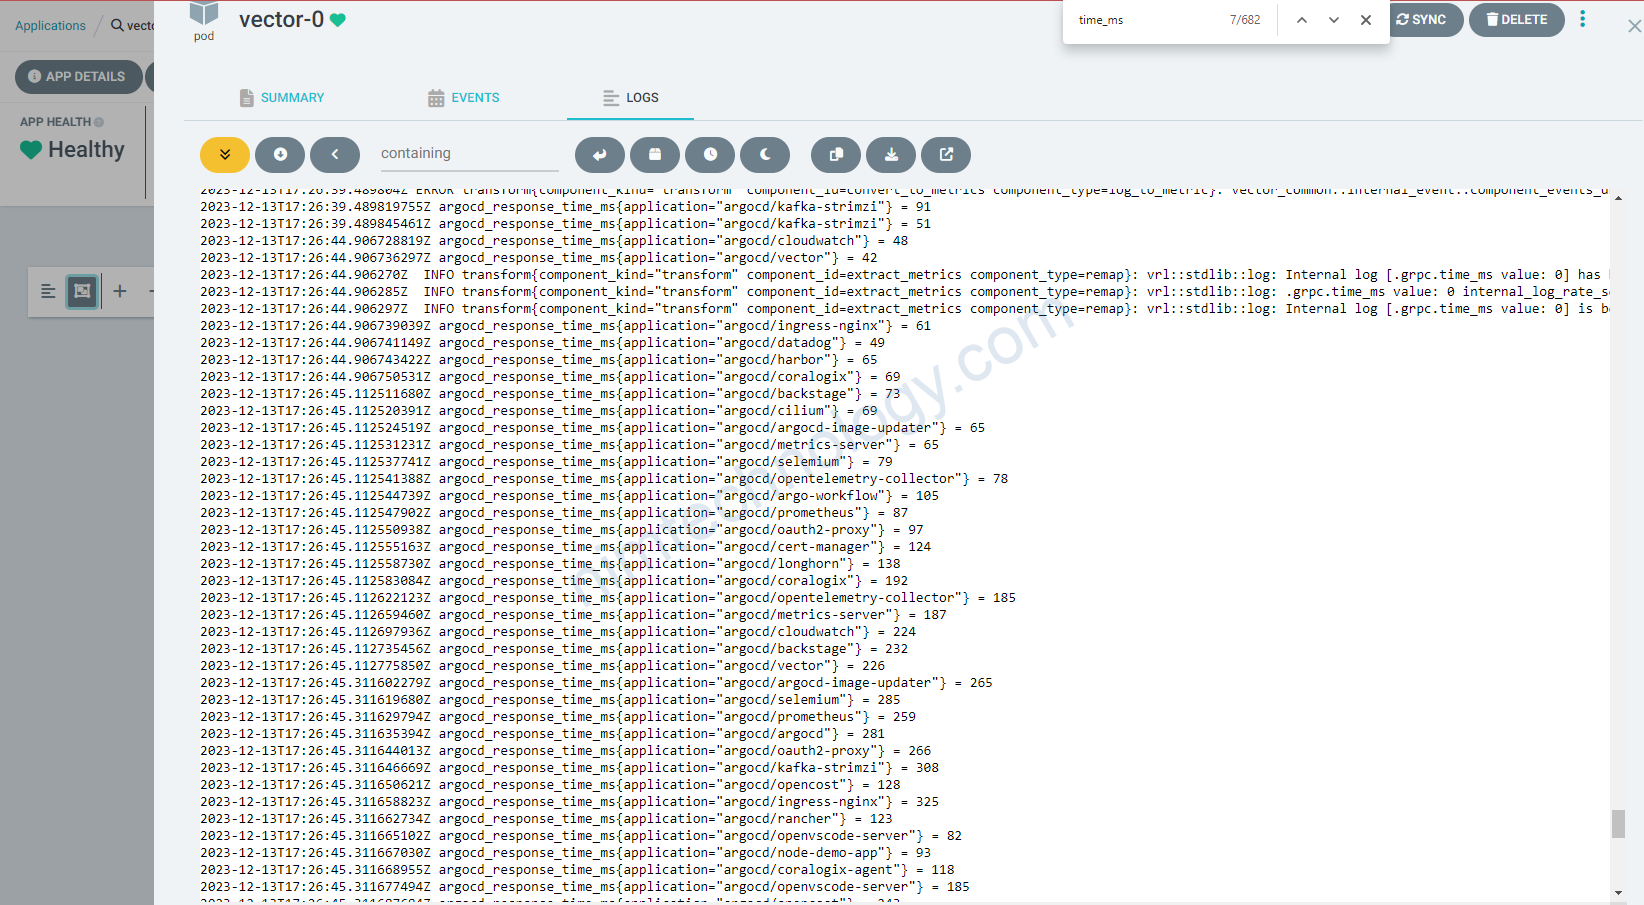
Khi này nếu config ok thì bạn show log của vector sẽ thấy nó stdout khá nhiều log.
2) Transforms:
2.1) parse_key_value funtion in vector4
Khi transform chúng ta sẽ dùng type là remap
The “remap” transform type in Vector is primarily used for parsing, shaping, and transforming observability data, such as logs and metrics, within your data processing topology. This transform utilizes the Vector Remap Language (VRL), a language designed for the safe and efficient processing of observability data. VRL is expression-oriented and aligns closely with the data models used in Vector.
Bạn sẽ thấy nội dung của message có dạng key và value.

Trong remap chúng ta sẽ sử dụng function parse_key_value
Parses the value in key-value format. Also known as logfmt.
- Keys and values can be wrapped with
". "characters can be escaped using\.
customConfig:
  api:
    enabled: true
    address: 127.0.0.1:8686
    playground: true
  sources:
    otel_collector:
      type: opentelemetry
      grpc:
        address: '0.0.0.0:4317'
      http:
        address: '0.0.0.0:4318'
    # Add your log source here if needed

  transforms:
    parse_logs:
      type: remap
      inputs:
        - "otel_collector.logs"
      source: |
          . = parse_key_value!(string!(.message))
2.2) change key
Phần này mình có thể giải thích thêm
không phải key nào cũng có định dang dễ chịu như time-ms hoặc time_ms
mà nó sẽ là như thế này: grpc.time_ms
Nếu bạn cần phải convert từ grpc.time_ms sang grpc_time_ms thì chúng ta sẽ dùng: to_float
to_float: Coerces the value into a float.
  transforms:
    parse_logs:
      type: remap
      inputs:
        - "otel_collector.logs"
      source: |
          . = parse_key_value!(string!(.message))
    extract_metrics:
      type: remap
      inputs:
        - parse_logs
      source: |
          grpc_time_ms, err_convert = to_float(.grpc.time_ms)
          if err_convert != null {
            log("Unable to convert To Float: " + err_convert, level: "error")
          } else {
            .grpc_time_ms = grpc_time_ms
            log(".grpc.time_ms value: " + to_string(grpc_time_ms), level: "info")
          }
2.3) Convert log to metrics by Vector
Đây là phần mà mình muốn nhất:
  transforms:
    parse_logs:
      type: remap
      inputs:
        - "otel_collector.logs"
      source: |
          . = parse_key_value!(string!(.message))
    extract_metrics:
      type: remap
      inputs:
        - parse_logs
      source: |
          grpc_time_ms, err_convert = to_float(.grpc.time_ms)
          if err_convert != null {
            log("Unable to convert To Float: " + err_convert, level: "error")
          } else {
            .grpc_time_ms = grpc_time_ms
            log(".grpc.time_ms value: " + to_string(grpc_time_ms), level: "info")
          }

    convert_to_metrics:
      type: log_to_metric
      inputs:
        - extract_metrics
      metrics:
        - type: gauge
          field: time_ms
          name: response_time_ms
          namespace: argocd
          tags:
            application: '{{ printf "{{ application }}" }}'
log_to_metric: Convert log events to metric events
trong phần example của vector thì bạn sẽ thấy

Nhưng vì dùng trong helm value nên là:
tags:
  application: '{{ printf "{{ application }}" }}'
Dưới đây là các code sưu tầm.
2.4) (Optional)parse syslog by Vector
the configuration using the remap transform:
- Parse the JSON Log: Use the
remaptransform to parse the JSON log. - Extract the
time_msValue: Extract thetime_msvalue from the nestedmessagefield. - Transform to Metric: Convert the extracted
time_msvalue into a metric.
Here is the revised YAML configuration:
customConfig:
  api:
    enabled: true
    address: 127.0.0.1:8686
    playground: true
  sources:
    otel_collector:
      type: opentelemetry
      grpc:
        address: '0.0.0.0:4317'
      http:
        address: '0.0.0.0:4318'
    # Add your log source here if needed

  transforms:
    remap_argocd:
      type: remap
      inputs:
        - "otel_collector.logs"
      source: |
        parsed, err = parse_syslog(.message)
        if err != null {
          log_msg, err = if .message != null && is_string(.message) {
            "Unable to parse SysLog: " + .message
          } else {
            "Unable to parse SysLog: message field is missing or not a string"
          }
          if err != null {
            log("Error constructing log message: " + err, level: "error")
          } else {
            log(log_msg, level: "error")
          }
        } else {
          . = parsed
        }

  sinks:
    console_sink:
      type: console
      encoding:
        codec: text
      inputs:
        - remap_argocd

service:
  ports:
    - name: otel-collector-http
      port: 4318
      protocol: TCP
The parse_and_extract_time_ms transform in the provided YAML configuration is a Vector transform that uses the remap language. This transform is designed to parse a JSON log message and then extract a specific value (time_ms) from it. Here’s a breakdown of each part of the transform:
# Parsing JSON and extracting time_ms
parse_and_extract_time_ms:
  type: remap
  inputs: ["my_source_id"]
  source: |
    . = parse_json!(string!(.message))
    .time_ms = to_float!(.log_message.time_ms)
- Type:
type: remapchỉ định rằng transform náy sử dụng Vector’sremaplanguage, mà nó là 1 powerful tool for việc sử lý log và metric data.
- Inputs:
inputs: ["my_source_id"]specifies the input to this transform, which in this case ismy_source_id. This should be the ID of a source or another transform that precedes this one in your Vector configuration.
- Source:
- The
sourcefield contains the actual remap script:. = parse_json!(string!(.message)):string!(.message): phần này converts themessagefield of the log trong một string. cái dấu"!"chỉ định rằng đây là 1 quả quyết – if the conversion fails, an error will be logged, and the event will be dropped.parse_json!(...): This part attempts(nỗ lực) to parse the stringifiedmessageas JSON. Again, the!asserts(khẳng định) that this must succeed, or an error will occur, and the event will be dropped.. = ...: This sets the root object (.) in the remap context to the result of theparse_json!function. This means the entire log event is now replaced with the parsed JSON object.
.time_ms = to_float!(.log_message.time_ms):- This line extracts the
time_msvalue from the parsed JSON object. It assumes that after parsing the JSON, there is a fieldlog_messagewhich containstime_ms. to_float!(...): This converts thetime_msvalue to a floating-point number. The!asserts that this conversion must succeed..time_ms = ...: This sets a new fieldtime_msat the root of the event with the converted floating-point number.
- This line extracts the
- The
2.5) (Optional)parse grok by Vector (same as logstash)
customConfig:
  api:
    enabled: true
    address: 127.0.0.1:8686
    playground: true
  sources:
    otel_collector:
      type: opentelemetry
      grpc:
        address: '0.0.0.0:4317'
      http:
        address: '0.0.0.0:4318'
    # Add your log source here if needed

  transforms:
    remap_argocd:
      type: remap
      inputs:
        - "otel_collector.logs"
      source: |
        parsed, err_parsed = parse_grok(
          .message,
          "time=\"%{TIMESTAMP_ISO8601:timestamp}\" level=%{LOGLEVEL:level} msg=\"%{GREEDYDATA:msg}\" application=%{GREEDYDATA:application} build_options_ms=%{NUMBER:build_options_ms:int} helm_ms=%{NUMBER:helm_ms:int} plugins_ms=%{NUMBER:plugins_ms:int} repo_ms=%{NUMBER:repo_ms:int} time_ms=%{NUMBER:time_ms:int} unmarshal_ms=%{NUMBER:unmarshal_ms:int} version_ms=%{NUMBER:version_ms:int}"
        )
        if err_parsed != null {
          log_msg, err_log_msg = "Unable to parse Grok: " + .message
          if err_log_msg != null {
            log(err_log_msg, level: "error")
          }
          log(log_msg, level: "error")
        } else {
          . = parsed
        }
    log2metric_argocd:
      type: log_to_metric
      inputs:
        - remap_argocd
      metrics:
        - type: gauge
          field: time_ms
          name: response_time_ms
          namespace: service
          tags:
            application: '{{ printf "{{ application }}" }}'

  sinks:
    console_sink:
      type: console
      encoding:
        codec: text
      inputs:
        - log_to_metric
    prometheus_exporter:
      type: prometheus_exporter
      inputs:
        - log2metric_argocd
      address: "0.0.0.0:1994"

service:
  ports:
    - name: otel-collector-http
      port: 4318
      protocol: TCP
    - name: metrics
      port: 1994
      protocol: TCP
2.6) Parse JSON from log
2025-07-29 04:17:47 [36m[INFO ][0m { "scanResults": { "scan_details": { "rocketcyber": { "eng_id": "rocketcyber", "scan_result_i": 23, "scan_time": 2, "threat_found": "", "db_package_version": "1753747200", "def_time": "2025-07-29T03:45:35.631Z", "eng_package_version": "09_07_2024-363", "inqueue_time": 26 }, "avira": { "eng_id": "avira", "scan_result_i": 0, "scan_time": 10, "threat_found": "", "db_package_version": "1753746925", "def_time": "2025-07-29T03:55:37.097Z", "eng_package_version": "4.15.26-2281", "inqueue_time": 20 }, }, }, "stat": { "request_inqueue_time": 87796, "result_inqueue_time": 1371, "total_inqueue_time": 89167, "total_engine_scan_time": 87731, "aggregated_time": 1632, "total_scan_time": 1724 }, "priority": "ARCHIVE", "current_level": 15, "current_number": 9269, "esIndexName": "results" }transforms:
parse_json_from_log:
type: remap
inputs:
- otel_collector.logs
source: |
# Find the start of the JSON object in the log message
json_start_index = find!(.message, "{")
# Proceed only if a '{' character is found
if json_start_index != null {
# Slice the message from the start of the JSON to the end
json_string = slice!(.message, json_start_index)
# Parse the extracted JSON string and replace the event with it.
# The '!' drops events that fail to parse.
. = parse_json!(json_string)
} else {
# If no JSON is found, drop the event to prevent errors downstream
abort
}
Đầu tiên nó tìm ký tự bắt đầu của chuỗi Json:
# Find the start of the JSON object in the log message
json_start_index = find!(.message, "{")Nếu trong message nó không tìm thấy “{“ nó sẽ trả về null
và nếu nó tìm thấy “{“ thì nó sẽ trả về 1 number giống như là 1, 5, 7
Và code If tiếp theo chỉ Run khi json_start_index khác null
# Slice the message from the start of the JSON to the end
json_string = slice!(.message, json_start_index)Điều này cắt bỏ original log message, bắt đầu từ vị trí của ký tự { cho đến hết chuỗi.
# Parse the extracted JSON string and replace the event with it.
# The '!' drops events that fail to parse.
. = parse_json!(json_string)Nó sẽ lấy json_string và parse thành một structured object.
Sau bước này thì log sẽ như sau:
{
"scanResults": {
"scan_details": {
"rocketcyber": {
"eng_id": "rocketcyber",
"scan_result_i": 23,
"scan_time": 2,
"threat_found": "",
"db_package_version": "1753747200",
"def_time": "2025-07-29T03:45:35.631Z",
"eng_package_version": "09_07_2024-363",
"inqueue_time": 26
},
"avira": {
"eng_id": "avira",
"scan_result_i": 0,
"scan_time": 10,
"threat_found": "",
"db_package_version": "1753746925",
"def_time": "2025-07-29T03:55:37.097Z",
"eng_package_version": "4.15.26-2281",
"inqueue_time": 20
},
},
},
"stat": {
"request_inqueue_time": 87796,
"result_inqueue_time": 1371,
"total_inqueue_time": 89167,
"total_engine_scan_time": 87731,
"aggregated_time": 1632,
"total_scan_time": 1724
},
"priority": "ARCHIVE",
"current_level": 15,
"current_number": 9269,
"esIndexName": "results"
}
2.7) Convert value trong message log.
{
"scanResults": {
"scan_details": {
"rocketcyber": {
"eng_id": "rocketcyber",
"scan_result_i": 23,
"scan_time": 2,
"threat_found": "",
"db_package_version": "1753747200",
"def_time": "2025-07-29T03:45:35.631Z",
"eng_package_version": "09_07_2024-363",
"inqueue_time": 26
},
"avira": {
"eng_id": "avira",
"scan_result_i": 0,
"scan_time": 10,
"threat_found": "",
"db_package_version": "1753746925",
"def_time": "2025-07-29T03:55:37.097Z",
"eng_package_version": "4.15.26-2281",
"inqueue_time": 20
},
},
},
"stat": {
"request_inqueue_time": 87796,
"result_inqueue_time": 1371,
"total_inqueue_time": 89167,
"total_engine_scan_time": 87731,
"aggregated_time": 1632,
"total_scan_time": 1724
},
"priority": "ARCHIVE",
"current_level": 15,
"current_number": 9269,
"esIndexName": "results"
}
Ở trên là bạn thấy total_scan_time là milisecond.
Giờ mình cần chuyển nó sang second. và không ảnh hưởng object Json
convert_ms_to_s:
type: remap
inputs:
- parse_json_from_log
source: |
# Create a new field in seconds
.stat.total_scan_time_seconds = to_float!(.stat.total_scan_time) / 1000.0
tôi thực hiện chia lại total_scan_time chia cho 1000 để ra second.
Sau chúng ta tạo thêm object total_scan_time_seconds và gán vào stat thông qua dòng này .stat.total_scan_time_seconds = to_float!(.stat.total_scan_time) / 1000.0
2.8) Create an array of metrics from the log
{
"scanResults": {
"scan_details": {
"rocketcyber": {
"eng_id": "rocketcyber",
"scan_result_i": 23,
"scan_time": 2,
"threat_found": "",
"db_package_version": "1753747200",
"def_time": "2025-07-29T03:45:35.631Z",
"eng_package_version": "09_07_2024-363",
"inqueue_time": 26
},
"avira": {
"eng_id": "avira",
"scan_result_i": 0,
"scan_time": 10,
"threat_found": "",
"db_package_version": "1753746925",
"def_time": "2025-07-29T03:55:37.097Z",
"eng_package_version": "4.15.26-2281",
"inqueue_time": 20
},
},
},
"stat": {
"request_inqueue_time": 87796,
"result_inqueue_time": 1371,
"total_inqueue_time": 89167,
"total_engine_scan_time": 87731,
"aggregated_time": 1632,
"total_scan_time": 1724
},
"priority": "ARCHIVE",
"current_level": 15,
"current_number": 9269,
"esIndexName": "results"
}
Chúng ta có log: scanResults -> scan_details
Lấy giá trị của từng engine tạo ra metrics:
Mình muốn là nó sẽ đi vào từng engine và tạo ra các metrics như sau:
nim_engine_inqueue_time{engine_name="aegislab",pool="ARCHIVE"} 33 1753763291241
nim_engine_inqueue_time{engine_name="ahnlab",pool="ARCHIVE"} 20 1753763291241
nim_engine_inqueue_time{engine_name="avira",pool="ARCHIVE"} 53 1753763291241
# Creates an array of objects, with each object containing an engine's name and scan time.
create_engine_metrics_array:
type: remap
inputs:
- parse_json_from_log
source: |
.engine_scans = []
if exists(.scanResults.scan_details) {
for_each(object!(.scanResults.scan_details)) -> |key, value| {
.engine_scans = push(.engine_scans, {
"engine_name": key,
"scan_time": value.scan_time,
"inqueue_time": value.inqueue_time
})
}
}
# If the array is empty, drop the event so `explode` doesn't generate empty logs.
if length(.engine_scans) == 0 {
del(.)
}
Đầu tiên nó sẽ tạo event mới là .engine_scans = []
if exists(.scanResults.scan_details) { nếu trong .scanResults.scan_details có giá trị thì thực hiện đi vào if.
for_each(object!(.scanResults.scan_details)) -> |key, value| {Đây là 1 vòng loop
object!: Hàm này đảm bảo rằng .scanResults.scan_details là một structured object.
for_each(…): Điều này lặp qua từng cặp key-value bên trong đối tượng đó.
-> |key, value|: Trong mỗi vòng lặp , key sẽ giữ engine’s name (e.g., “tachyon”, “k7”), và value sẽ chứa đối tượng tương ứng chứa thông tin chi tiết về công cụ đó.
.engine_scans = push(.engine_scans, {
"engine_name": key,
"scan_time": value.scan_time,
"inqueue_time": value.inqueue_time
})
- push(…): Hàm này thêm một phần tử vào một mảng.
- The new object: Đó là một đối tượng có cấu trúc chứa ba trường:
- engine_name: The name of the engine (from the key).
- scan_time: The scan time for that engine (from value.scan_time).
- inqueue_time: The in-queue time for that engine (from value.inqueue_time).
# Takes the .engine_scans array and creates a separate log event for each element.
explode_engine_scans:
type: lua
inputs:
- create_engine_metrics_array
version: "2"
hooks:
process: |
function (event, emit)
local engine_scans = event.log.engine_scans
if engine_scans and type(engine_scans) == "table" then
for i, engine_data in ipairs(engine_scans) do
local new_event = {
log = {
engine_name = engine_data.engine_name,
scan_time = engine_data.scan_time,
inqueue_time = engine_data.inqueue_time,
priority = event.log.priority
}
}
emit(new_event)
end
end
end
type: lua
version: "2"- type: lua: Chỉ định rằng phép biến đổi này sẽ thực thi một Lua script.
- version: “2”: Chọn phiên bản hiện đại, được khuyến nghị của API chuyển đổi Lua trong Vector.
hooks:
process: |- hooks: Đây là nơi bạn xác định mã Lua sẽ được thực thi.
- process: |: cái process hook chạy script của nó cho tất cả các single event mà đi qua cái transform này.
function (event, emit)- event: This is the incoming log event object from the previous transform (create_engine_metrics_array). It contains the engine_scans array we created. Đây là một incoming log event object từ transform trước đó (create_engine_metrics_array). Nó chứa mảng engine_scans mà chúng ta đã tạo.
- emit: Đây là một hàm đặc biệt được cung cấp bởi Vector mà bạn gọi để gửi một sự kiện mới xuống hạ nguồn đến transform tiếp theo trong pipeline.
local engine_scans = event.log.engine_scansNó lấy mảng engine_scans từ event và lưu trữ nó vào một local Lua variable named engine_scans để dễ dàng truy cập.
if engine_scans and type(engine_scans) == "table" thenĐây là một kiểm tra an toàn.Nó đảm bảo rằng engine_scans thực sự tồn tại (engine_scans) và nó là một table (which is Lua’s data type for both arrays and objects).
for i, engine_data in ipairs(engine_scans) do- Đây là vòng lặp cốt lõi lặp qua mảng engine_scans.
- ipairs: Đây là một hàm Lua tiêu chuẩn để lặp qua một mảng.
- engine_data: Trong mỗi lần lặp, `engine_data` sẽ là một trong các đối tượng từ mảng, ví dụ: { “engine_name”: “tachyon”, “scan_time”: 13, “inqueue_time”: 1 }.
local new_event = {
log = {
engine_name = engine_data.engine_name,
scan_time = engine_data.scan_time,
inqueue_time = engine_data.inqueue_time,
priority = event.log.priority
}
}
- Bên trong vòng lặp, điều này tạo ra một event hoàn toàn mới, sạch sẽ.
- It constructs a log object containing only the specific data for the current engine in the loop, plus the priority from the original event.
- Nó tạo một log object chỉ chứa dữ liệu cụ thể (data) cho current engine trong vòng lặp, cùng với độ ưu tiên từ sự kiện gốc.
emit(new_event)Đây là bước quan trọng nhất. Nó lấy new_event mà chúng ta vừa tạo và gửi nó ra khỏi transform. Nếu event ban đầu có hai engines, Hàm `emit` này sẽ được gọi hai lần., tạo ra hai sự kiện đầu ra riêng biệt.
3) Sinks
Sinks trong vector là các bạn public kết quả của transfroms hay sources ra prometheus, stdout (console).
3.1) output result to console.
chúng ta sẽ thường xuyền output ra ngoài console (stdout) để sẽ kết quả
sinks:
console_metrics:
type: console
encoding:
codec: text
inputs:
- convert_to_metrics
3.2) Publish metrics via prometheus client
Lúc này bạn publish metrics thông qua metrics page http://xxx.xxx:metrics thì promeheus server mới scapes metrics được
convert_to_metrics:
type: log_to_metric
inputs:
- extract_metrics
metrics:
- type: gauge
field: time_ms
name: response_time_ms
namespace: argocd
tags:
application: '{{ printf "{{ application }}" }}'
sinks:
prometheus_exporter:
type: prometheus_exporter
inputs:
- convert_to_metrics
address: "0.0.0.0:9598"
giờ bạn curl vào localhost:9598/metrics
openvscode-server@openvscode-server-65d78d546b-n2tv2:~$ curl http://vector-headless.default:9598/metrics
# HELP argocd_response_time_ms response_time_ms
# TYPE argocd_response_time_ms gauge
argocd_response_time_ms{application="argocd/kafka-strimzi"} 1367 1702489126145
argocd_response_time_ms{application="argocd/opentelemetry-collector"} 81 1702489125144
argocd_response_time_ms{application="argocd/argocd-image-updater"} 271 1702489125343
argocd_response_time_ms{application="argocd/ingress-nginx"} 277 1702489125343
argocd_response_time_ms{application="argocd/cilium"} 473 1702489125546
argocd_response_time_ms{application="argocd/harbor"} 463 1702489125546
argocd_response_time_ms{application="argocd/vector"} 188 1702489125144
argocd_response_time_ms{application="argocd/backstage"} 226 1702489125145
argocd_response_time_ms{application="argocd/rancher"} 190 1702489125144
Real Example value for vector
role: Stateless-Aggregator
customConfig:
api:
enabled: true
address: 127.0.0.1:8686
playground: true
sources:
otel_collector:
type: opentelemetry
grpc:
address: '0.0.0.0:4317'
http:
address: '0.0.0.0:4318'
transforms:
  parse_json_from_log:
    type: remap
    inputs:
    - otel_collector.logs
    source: |
      # Find the start of the JSON object in the log message
      json_start_index = find!(.message, "{")

      # Proceed only if a '{' character is found
      if json_start_index != null {
        # Slice the message from the start of the JSON to the end
        json_string = slice!(.message, json_start_index)
        # Parse the extracted JSON string and replace the event with it.
        # The '!' drops events that fail to parse.
        . = parse_json!(json_string)
      } else {
        # If no JSON is found, drop the event to prevent errors downstream
        abort
      }
convert_ms_to_s:
  type: remap
  inputs:
    - parse_json_from_log
  source: |
    # Create a new field in seconds
    .stat.total_scan_time_seconds = to_float!(.stat.total_scan_time) / 1000.0
scan_time_metrics:
type: log_to_metric
inputs:
- convert_ms_to_s
metrics:
- field: stat.total_scan_time
name: nim_total_scan_time
type: gauge
tags:
pool: '{{ printf "{{ priority }}" }}'
- field: stat.download_time
name: nim_download_time
type: gauge
tags:
pool: '{{ printf "{{ priority }}" }}'
- field: stat.total_scan_time_seconds
name: nim_total_scan_time_seconds
type: histogram
tags:
pool: '{{ printf "{{ priority }}" }}'
- field: stat.request_inqueue_time
name: nim_request_inqueue_time
type: gauge
tags:
pool: '{{ printf "{{ priority }}" }}'
- field: stat.result_inqueue_time
name: nim_result_inqueue_time
type: gauge
tags:
pool: '{{ printf "{{ priority }}" }}'
# Creates an array of objects, with each object containing an engine's name and scan time.
create_engine_metrics_array:
  type: remap
  inputs:
    - parse_json_from_log
  source: |
    .engine_scans = []
    if exists(.scanResults.scan_details) {
      for_each(object!(.scanResults.scan_details)) -> |key, value| {
        .engine_scans = push(.engine_scans, {
          "engine_name": key,
          "scan_time": value.scan_time,
          "inqueue_time": value.inqueue_time
        })
      }
    }
    # If the array is empty, drop the event so `explode` doesn't generate empty logs.
    if length(.engine_scans) == 0 {
        del(.)
    }
# Takes the .engine_scans array and creates a separate log event for each element.
explode_engine_scans:
  type: lua
  inputs:
    - create_engine_metrics_array
  version: "2"
  hooks:
    process: |
      function (event, emit)
        local engine_scans = event.log.engine_scans
        if engine_scans and type(engine_scans) == "table" then
          for i, engine_data in ipairs(engine_scans) do
            local new_event = {
              log = {
                engine_name = engine_data.engine_name,
                scan_time = engine_data.scan_time,
                inqueue_time = engine_data.inqueue_time,
                priority = event.log.priority
              }
            }
            emit(new_event)
          end
        end
      end
# Converts each exploded log event into a gauge metric.
engine_scan_time_to_metric:
type: log_to_metric
inputs:
- explode_engine_scans
metrics:
- type: gauge
field: "scan_time" # The value for the gauge
name: "nim_engine_scan_time"
tags:
engine_name: '{{ printf "{{ engine_name }}" }}' # Dynamic tag from the event
pool: '{{ printf "{{ priority }}" }}' # Preserve the pool tag from the original event
- type: gauge
field: "inqueue_time"
name: "nim_engine_inqueue_time"
tags:
engine_name: '{{ printf "{{ engine_name }}" }}'
pool: '{{ printf "{{ priority }}" }}'
sinks:
console_logs:
type: console
encoding:
codec: text
inputs:
- "otel_collector.logs"
prometheus_exporter:
type: prometheus_exporter
inputs:
- scan_time_metrics
- engine_scan_time_to_metric
address: 0.0.0.0:9598
buckets: [0.005, 0.01, 0.025, 0.05, 0.1, 0.25, 0.5, 0.75, 1, 1.5, 2, 2.5, 3, 3.5, 4, 4.5, 5, 5.5, 6, 6.5, 7, 7.5, 8, 8.5, 9, 9.5, 10]
service:
ports:
- name: otel-collector-http
port: 4318
protocol: TCP
- name: otel-collector-grpc
port: 4317
protocol: TCP
- name: metrics
port: 9598
protocol: TCP
podAnnotations:
prometheus.io/scrape: 'true'
prometheus.io/path: '/metrics'
prometheus.io/port: '9598'