Note lần này sẽ giúp chúng ta tìm hiểu về:
– Recording Rules trong prometheus.
– Giảm metrics của istio. Từ đó giảm ram của prometheus.
Liệu việc giảm ram của prometheus bằng các giảm metrics thì có thực sự hiệu quả?
https://karlstoney.com/2020/02/25/federated-prometheus-to-reduce-metric-cardinality/
Giờ chúng ta sẽ đi tìm hiều Recording Rules trong 1 ví dụ thực tế với istio.
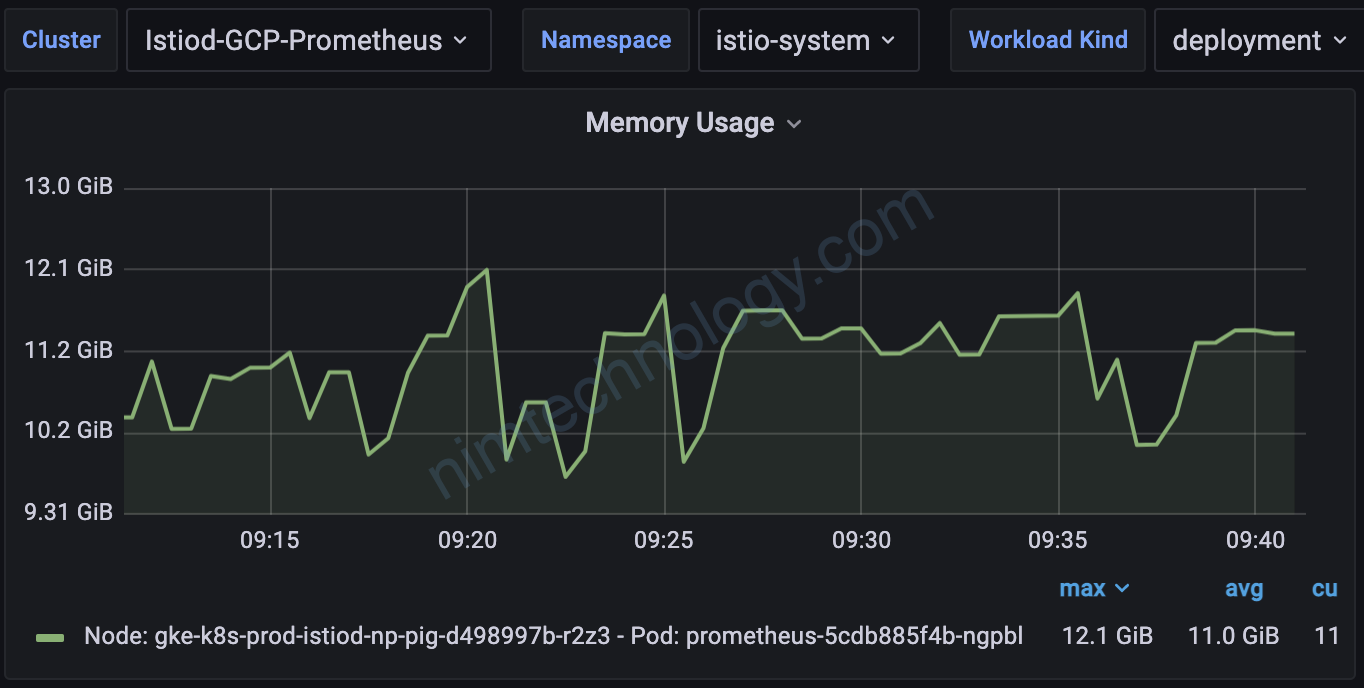
Nếu nhà giàu thì thêm ram cho node, nhưng mà nhà mình nghèo các bạn ạ.
Theo như bài viết sau:
https://karlstoney.com/2020/02/25/federated-prometheus-to-reduce-metric-cardinality/
– thì mình sử dụng Record rule để remove the cardinality( Loại bỏ các data không cần thiết trong metrics) and get us back to a concise set of service metrics (đưa về dạng ngắn gọn và vừa đủ dùng).
– và bạn cũng sẽ thấy dùng irate để giảm số lương metrics lại, như trên con collector là 100 thì khi chuyển lên con master chỉ còn 10.
Và có 1 con prometheus ở cluster chính đi lấy lại metrics của các collector
Theo như bài viết kia thì mình cần giảm data (nghĩ là bỏ mấy text dư thừa) trong các metrics sau:
– istio_request_duration_milliseconds_bucket
– istio_request_bytes_bucket
– istio_response_bytes_bucket
– istio_requests_total
1) Recording Rules
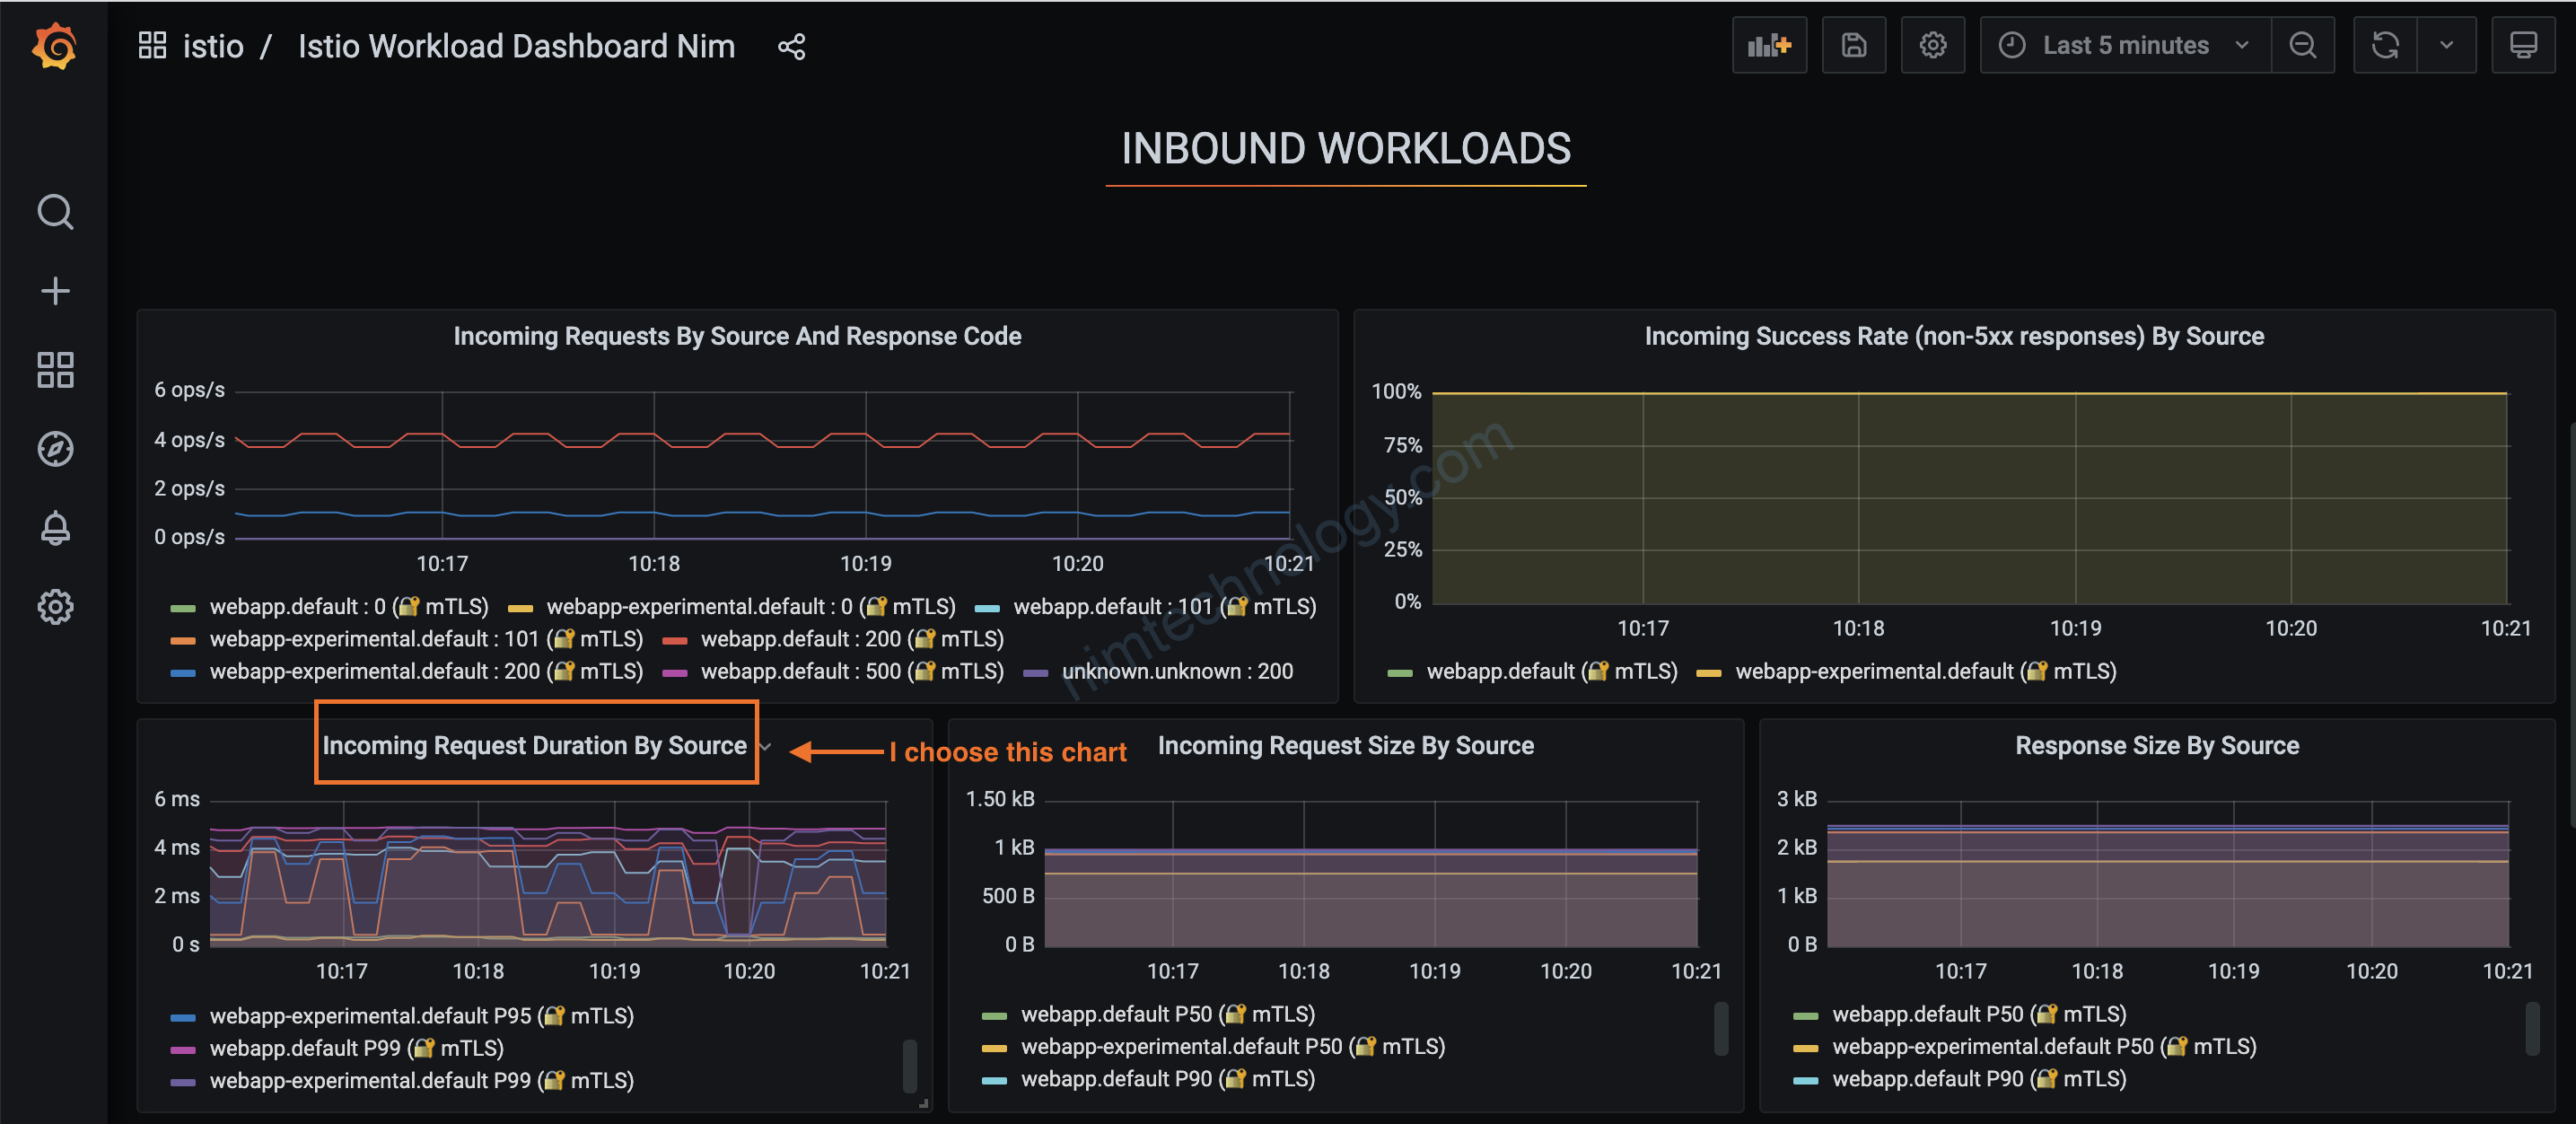
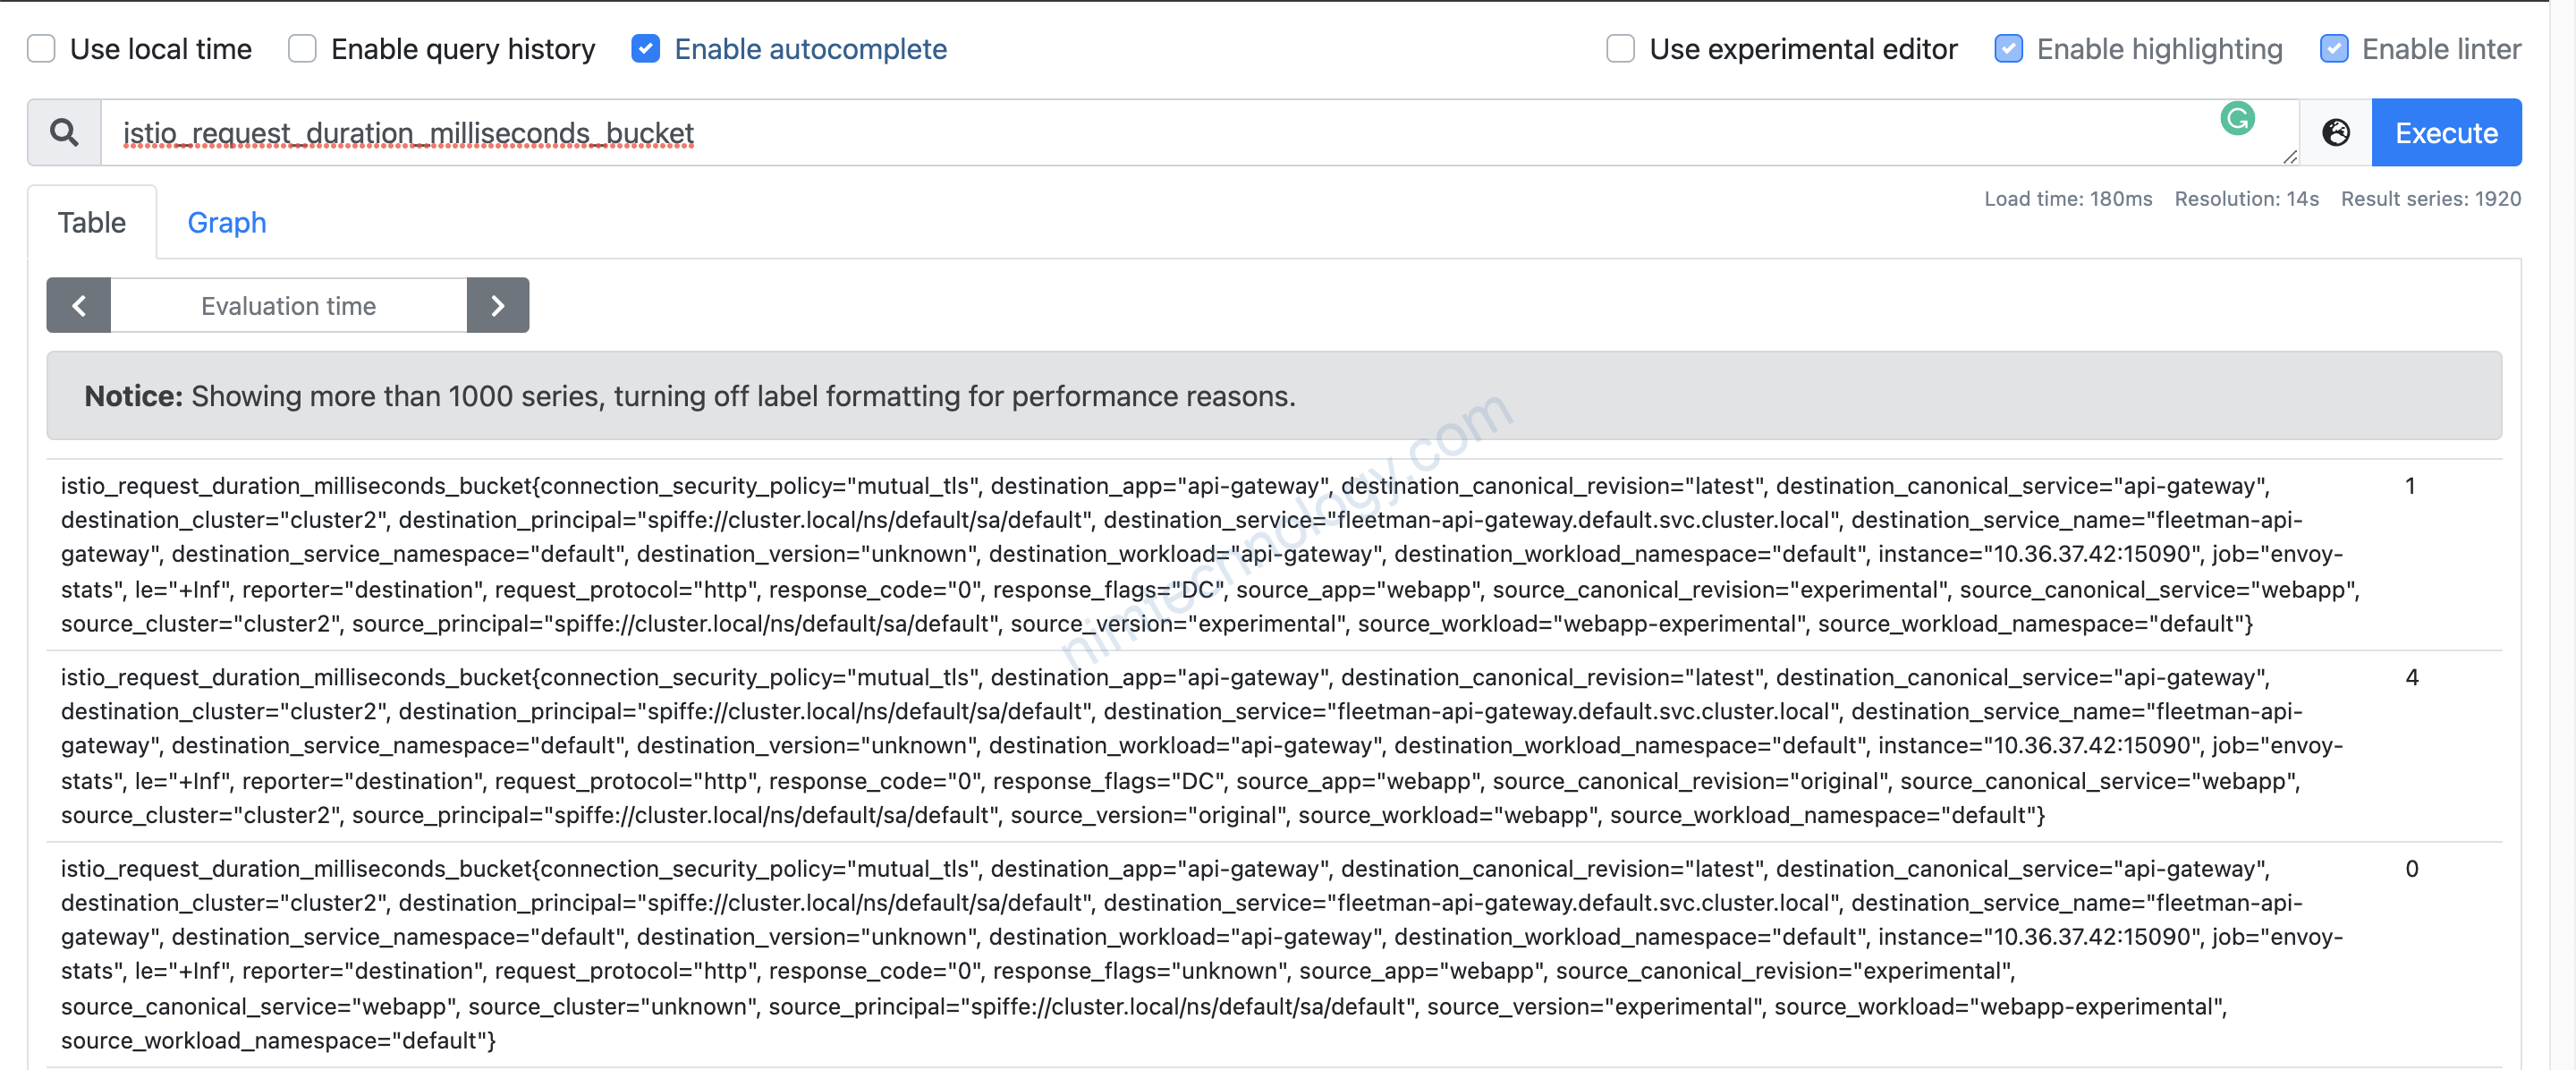
Mình sẽ lấy thử 1 metric cái ra làm demo: istio_request_duration_milliseconds_bucket
Để hiểu tại sao chúng ta cần bỏ cái j và sau khi bỏ thì grafana hết chạy!!!!
giờ bạn đi tìm: istio_request_duration_milliseconds_bucket nằm trong chart nào?

Mình list ra essential keys bên trong metric.
Ở đây thì có key đặc biệt: connection_security_policy=”mutual_tls” Bạn thấy nó có hình ổ khoá
Cái này mình check lại nếu có lỗi
reporter,
connection_security_policy,
source_workload,
source_workload_namespace,
destination_service,
destination_workload,
destination_workload_namespace,
le
Trong bài biết của anh tây thì anh lại query reporter=”source”
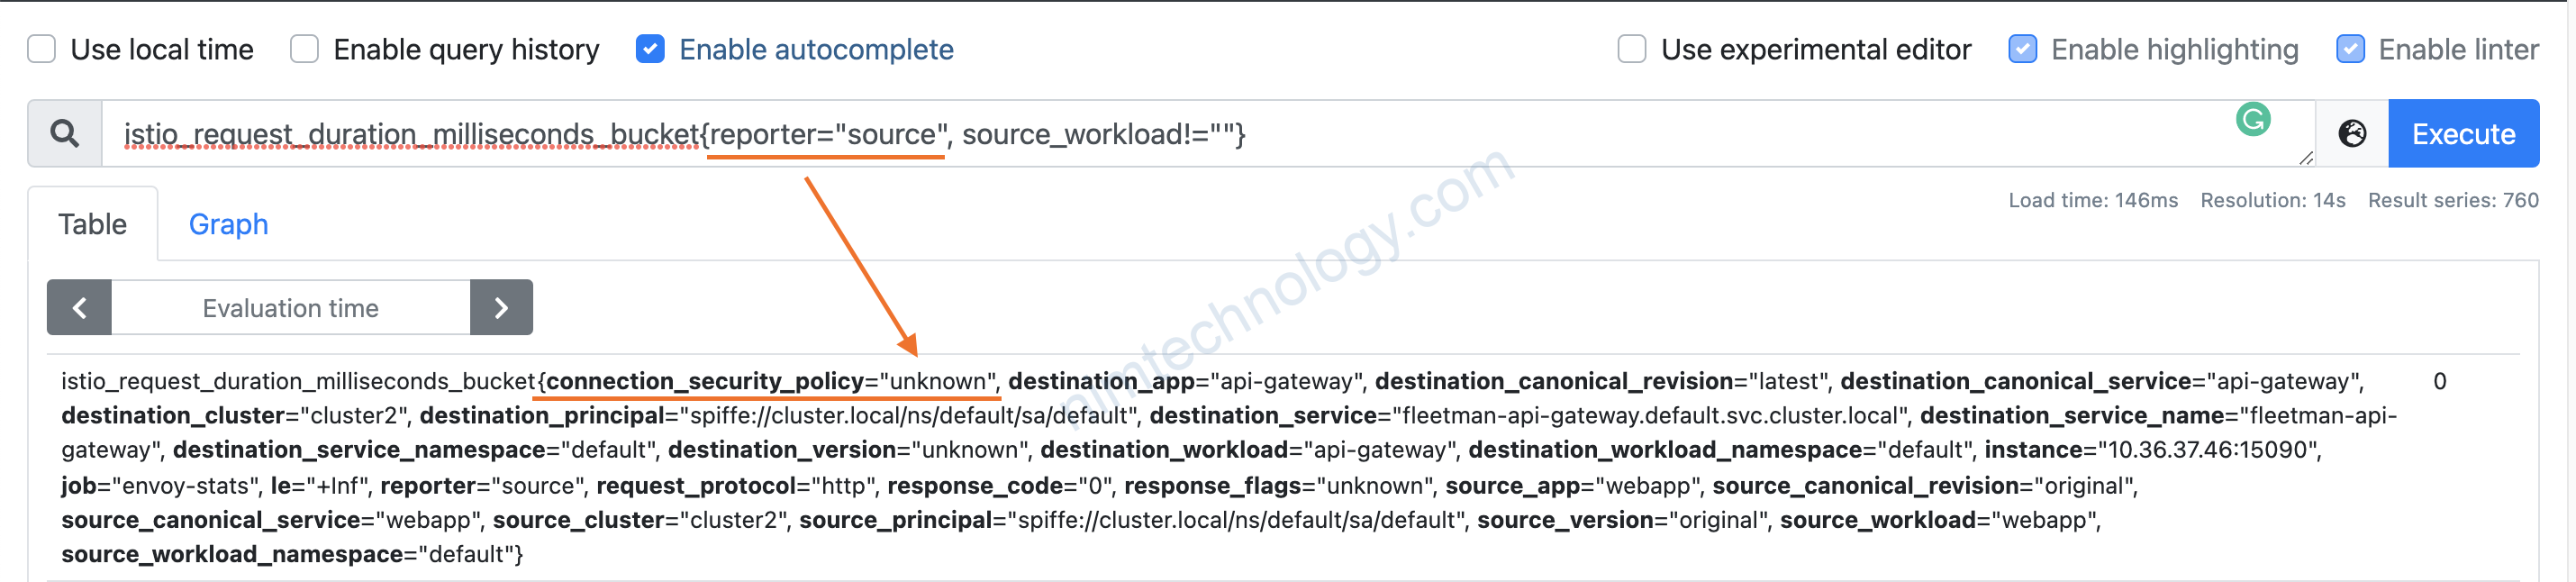
mình đoán chart của mình có khả năng sai.
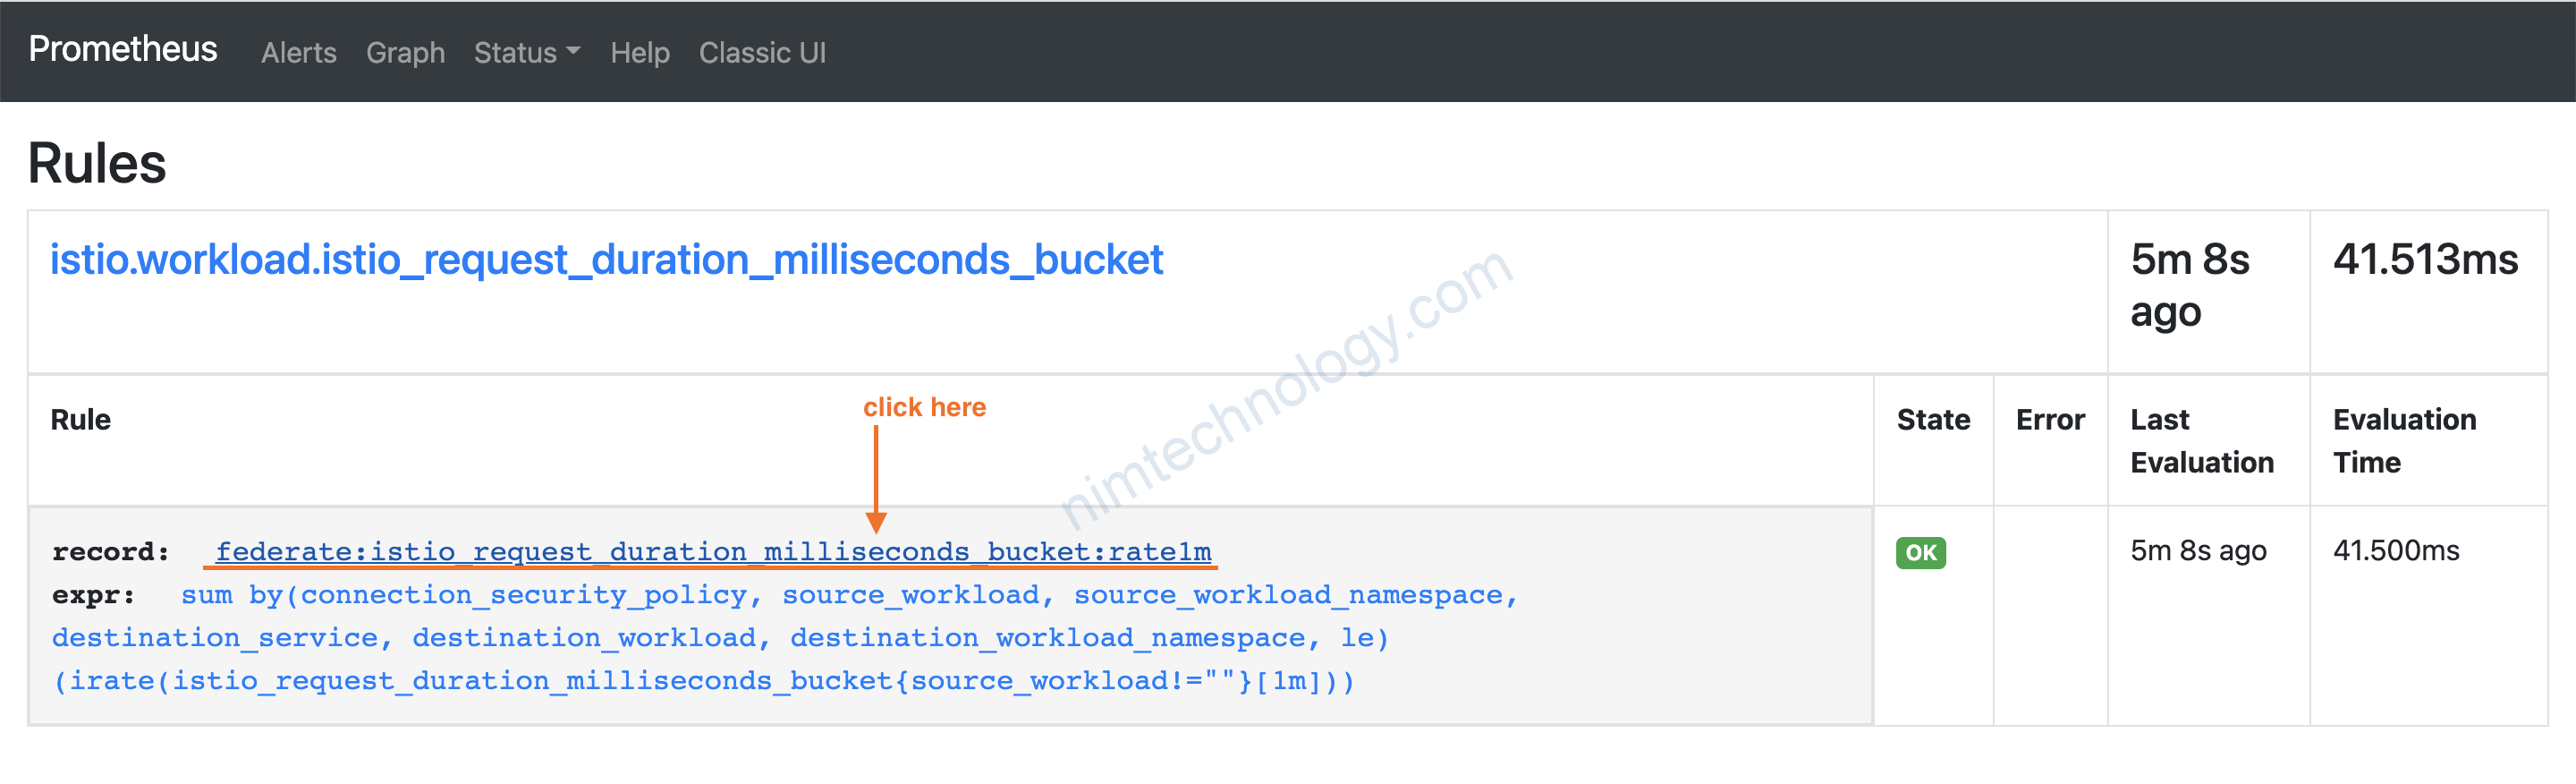
  recording_rules.yml: |
    groups:
      - name: istio.workload.istio_request_duration_milliseconds_bucket
        interval: 10s
        rules:
          - record: federate:istio_request_duration_milliseconds_bucket:rate1m
            expr: |
              sum(irate(istio_request_duration_milliseconds_bucket{source_workload!=""}[1m]))
                by (
                  connection_security_policy,
                  source_workload,
                  source_workload_namespace,
                  destination_service,
                  destination_workload,
                  destination_workload_namespace,
                  le
                )
  rules: |
    {}
sau khi thêm vào config map của prometheus.

nên ko redeploy lại prometheus

Nếu bạn thấy trắng bóc thì sem log của con reload và con prometheus.
2) federate in mode “master and collector” Of Prometheus
Mình qua con prometheus chính:
    # remote cluster
    - job_name: 'federate'
      scrape_interval: 10s
      honor_labels: true
      metrics_path: '/federate'
      params:
        'match[]':
          - '{__name__=~"federate:(.*)"}'
      static_configs:
      - targets:
        - '192.168.101.51:32166'
        labels:
          cluster: 'cluster2'
      metric_relabel_configs:
      - source_labels: [__name__]
        regex: 'federate:(.*)'
        target_label: __name__
        action: replace
There are a couple of important points here. Firstly, we’re telling Prometheus to only scrape metrics that start with federate:, this is why that convention earlier was important.
Secondly, we then relabel the metric to remove the federate: prefix. Meaning in our top-level Prometheus our metrics will be clearer. federate:istio_request_bytes_bucket:rate1m
becomes istio_request_bytes_bucket:rate1m.
Mình có giải dễ hiều về metric_relabel_configs trong case này ở link bên dưới
https://nimtechnology.com/2021/12/15/prometheus-relabelling-custom-name-to-your-mind/
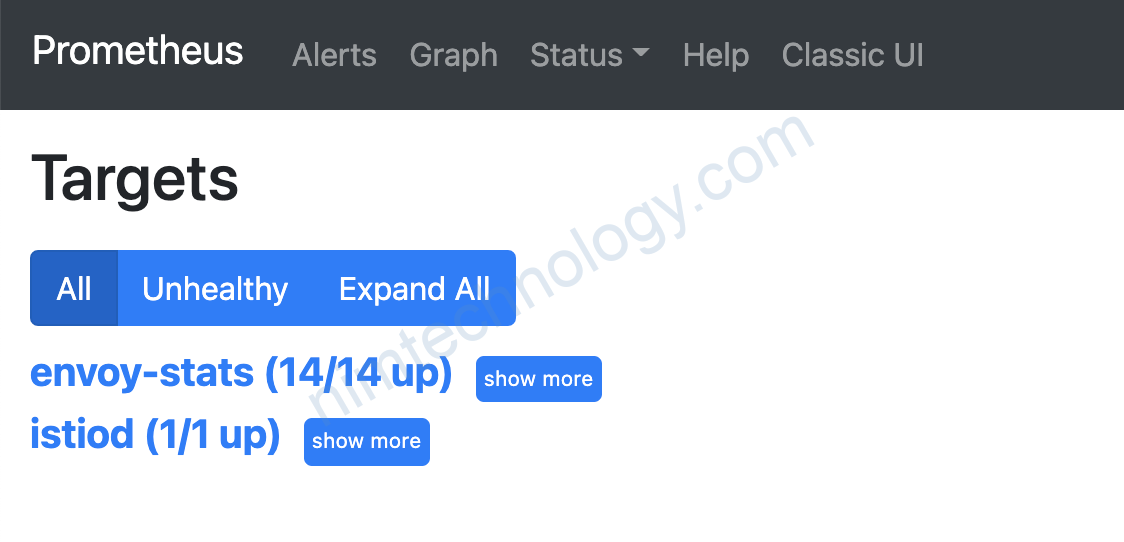
Mình sẽ kiểm chứng câu nói trên:
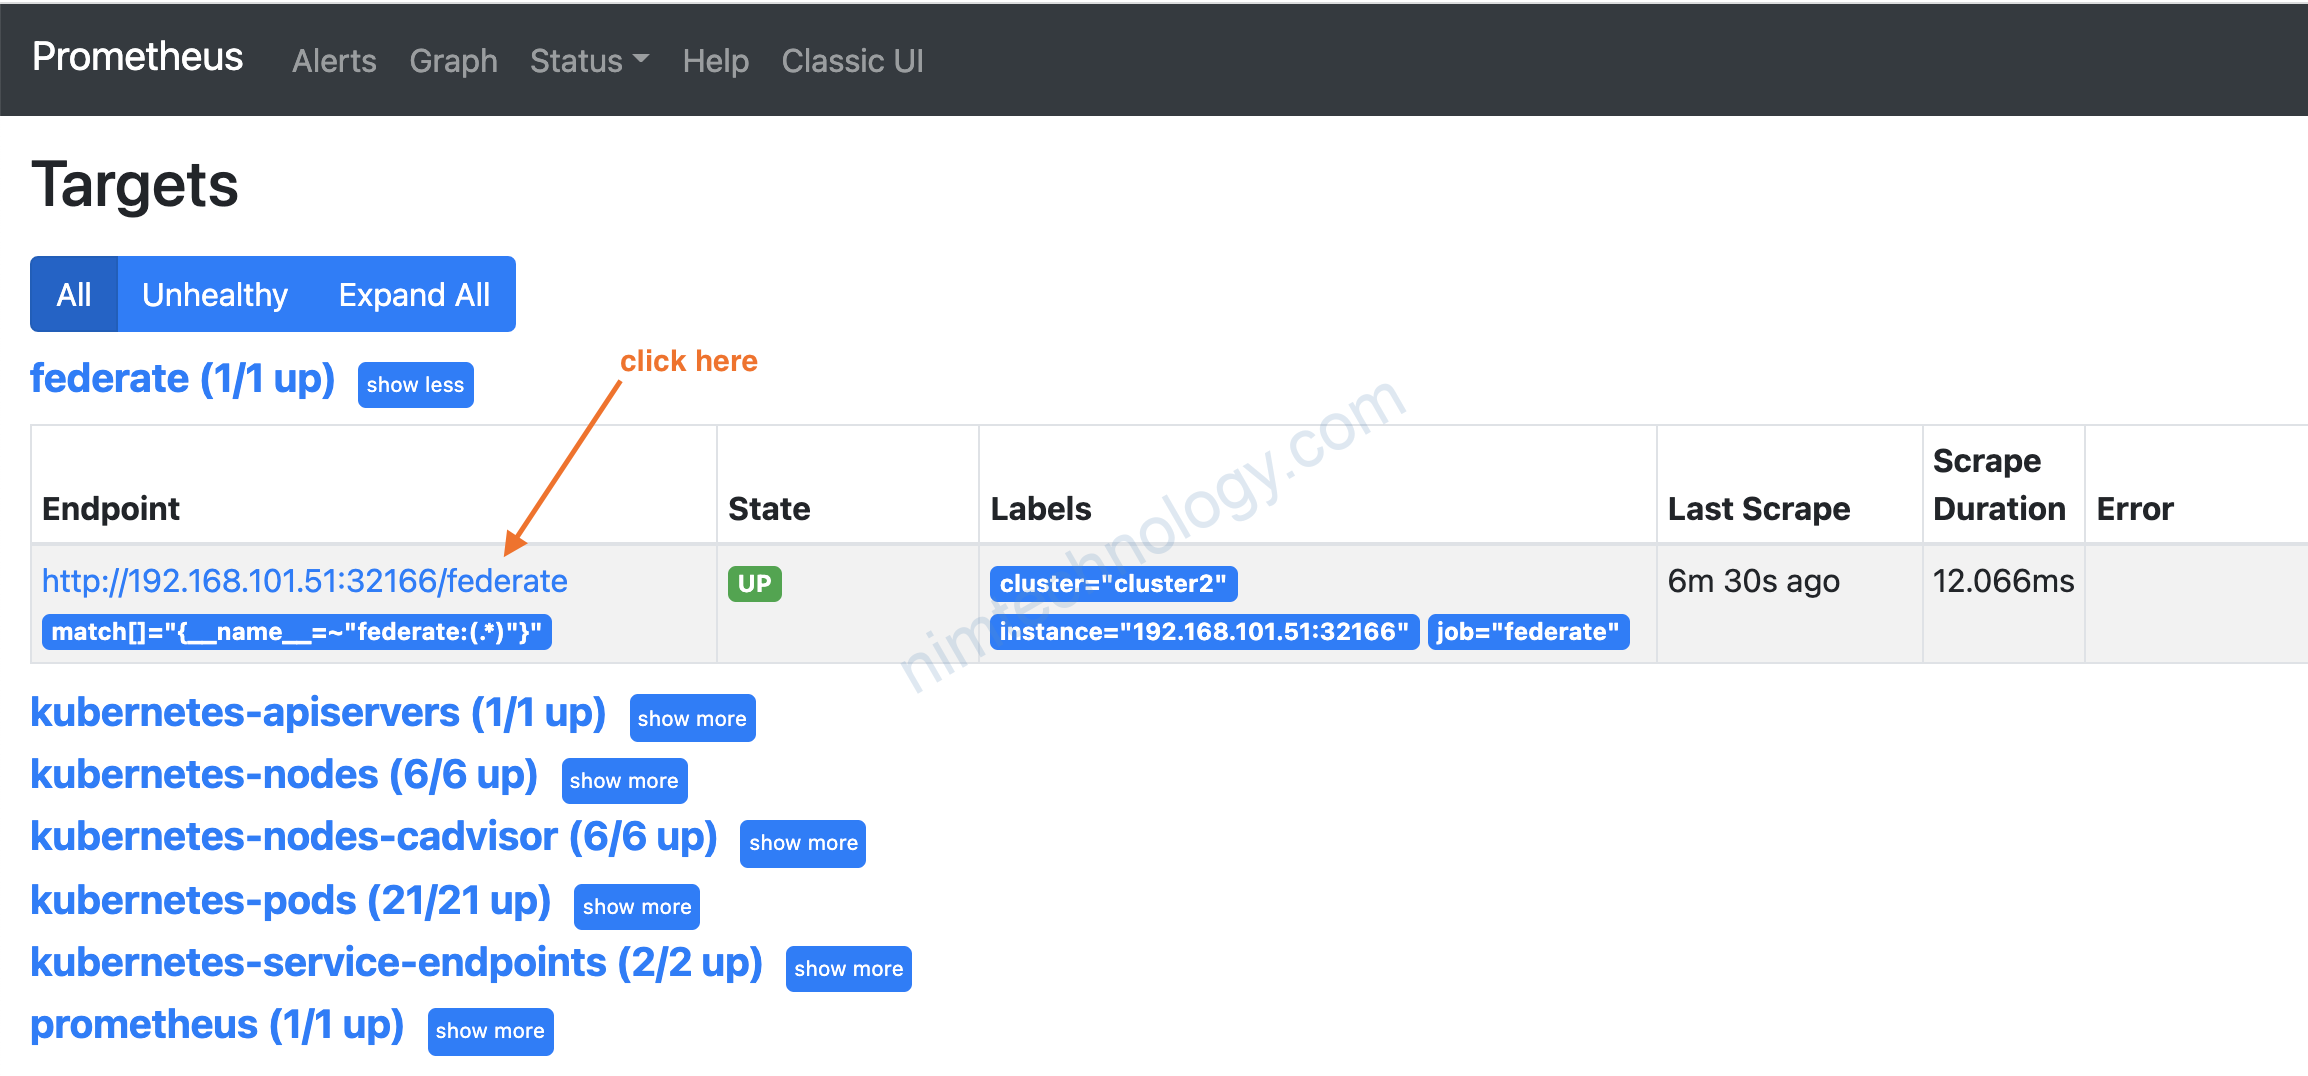
show trang metrics
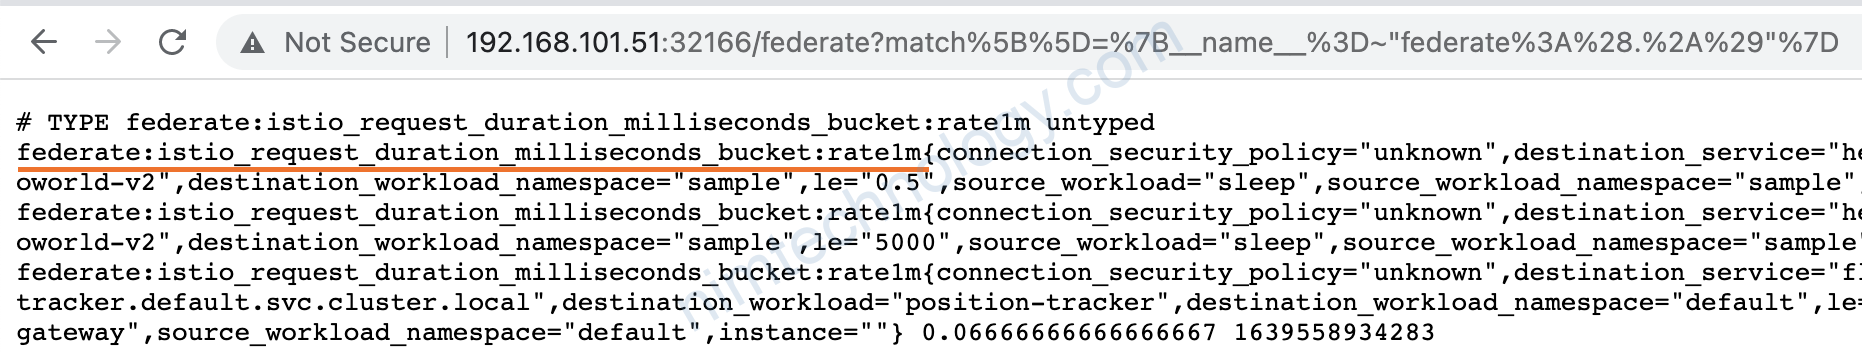
__name__ của metric được bắt đầu bằng federate:****
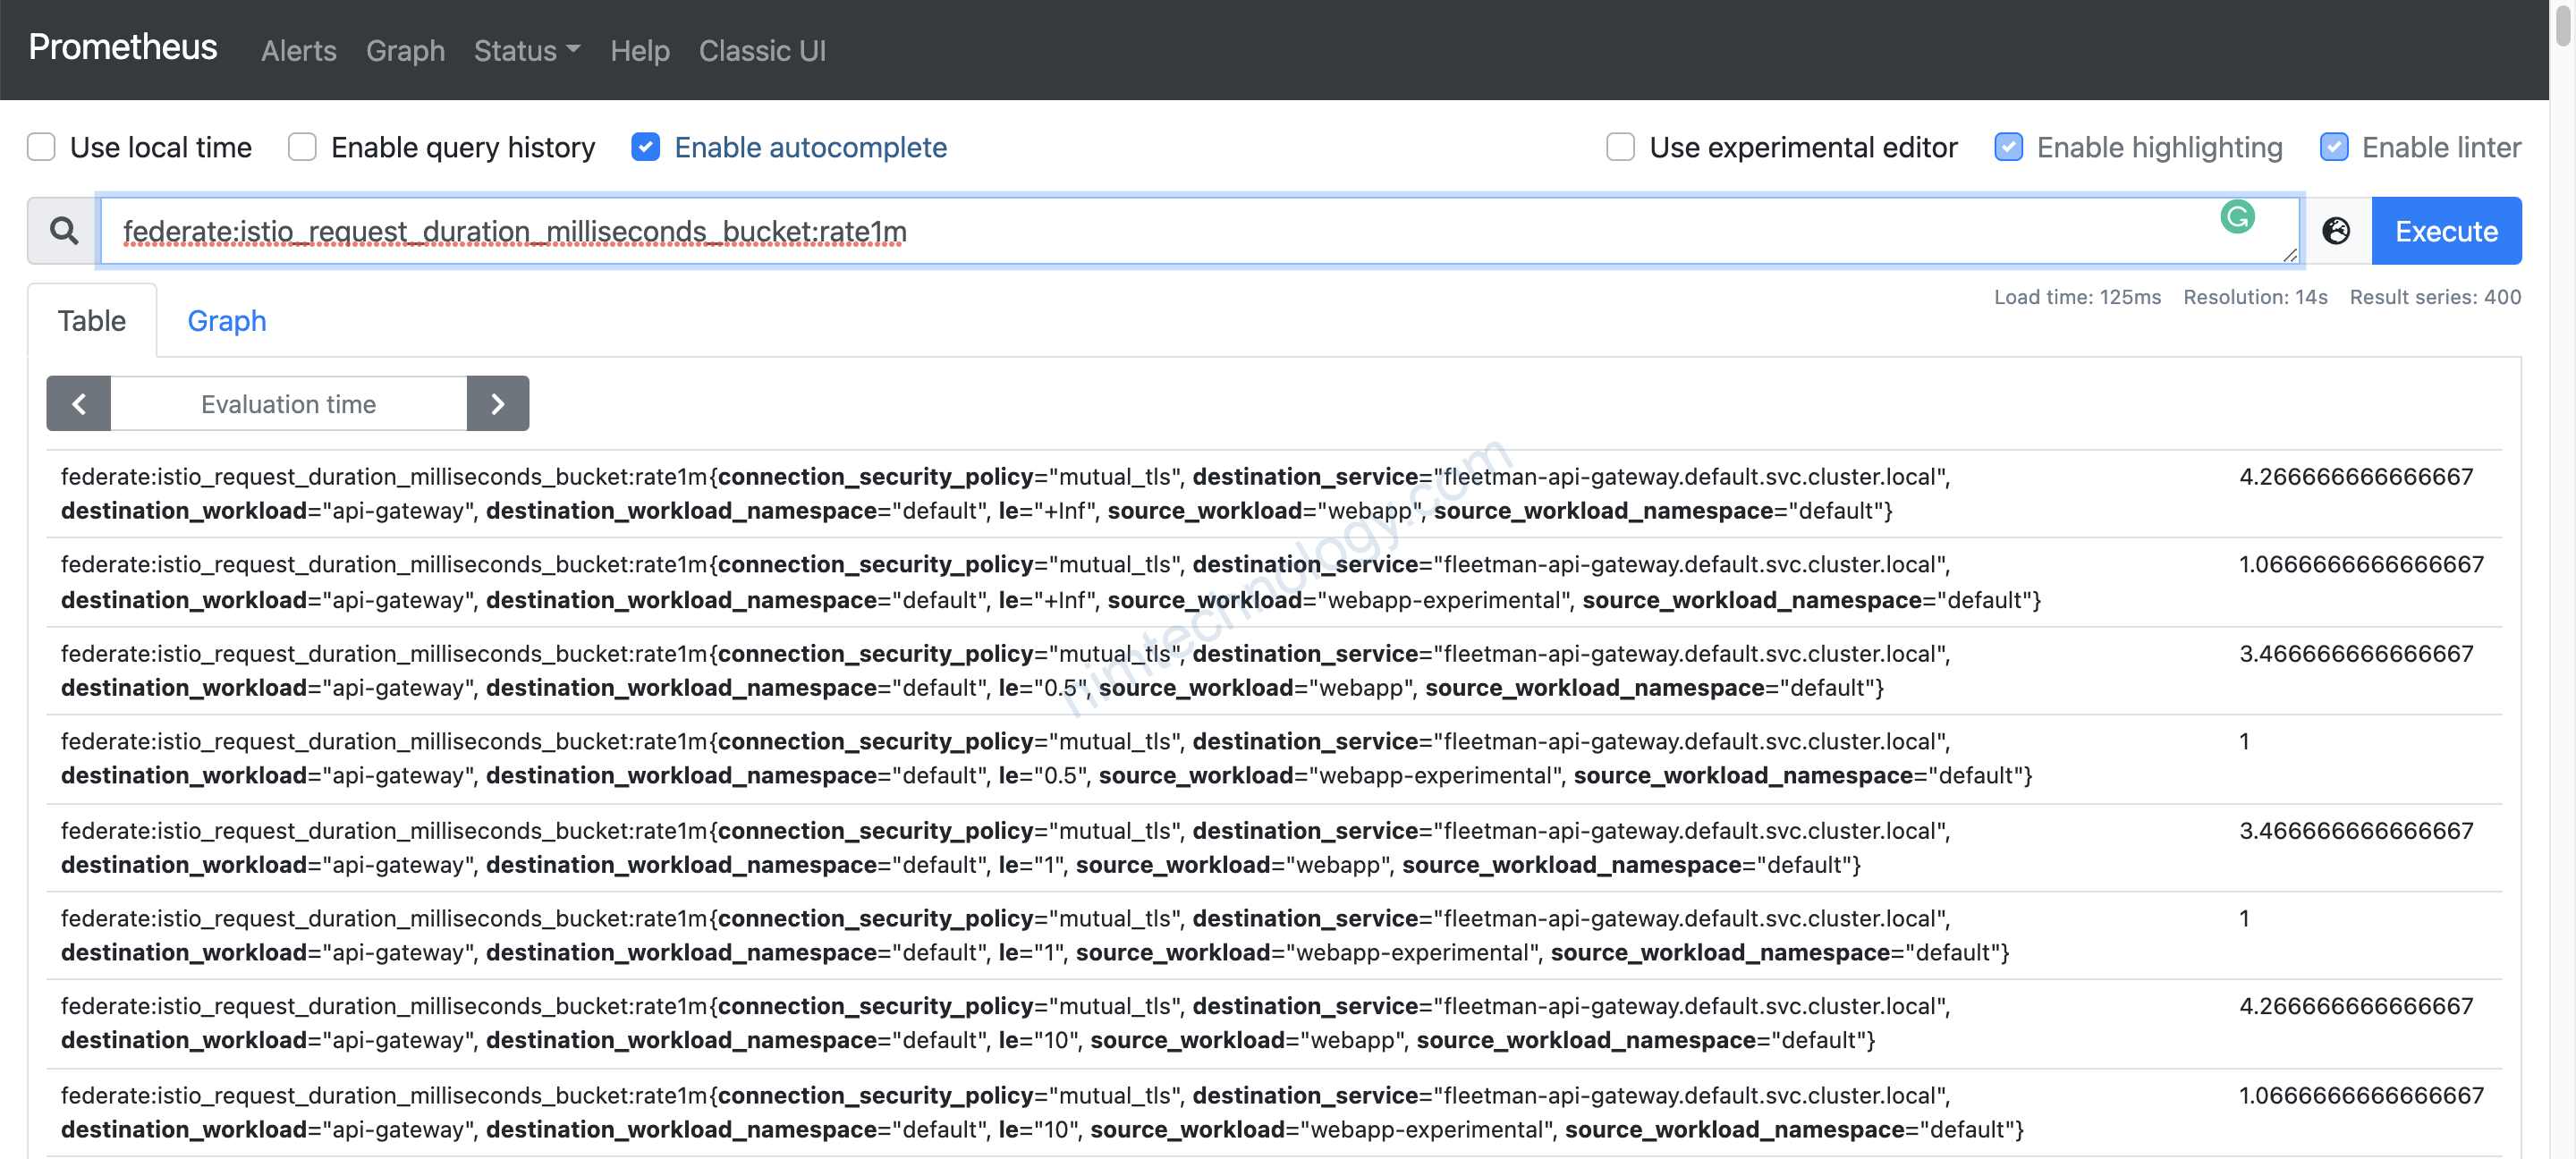
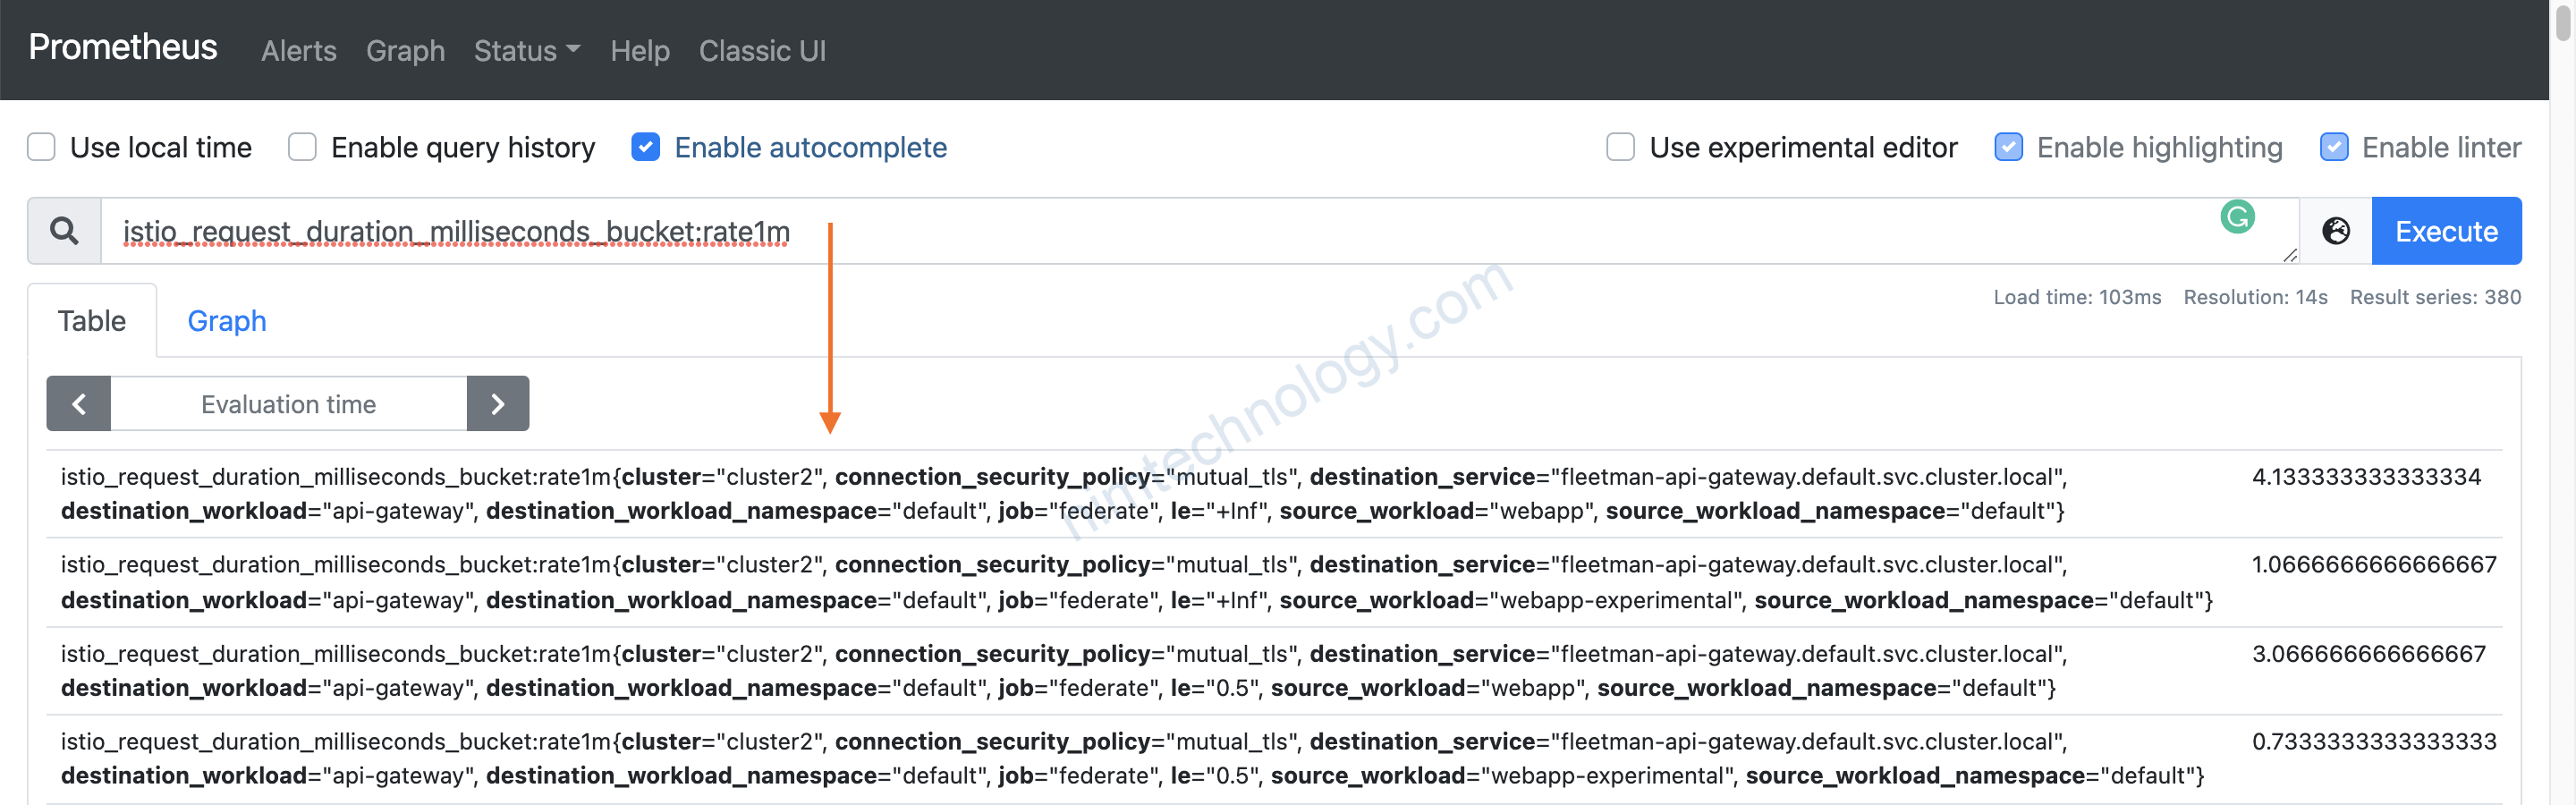
Nhờ cái metric_relabel_configs thì name query được trên prometheus master sẽ là: istio_request_duration_milliseconds_bucket:rate1m
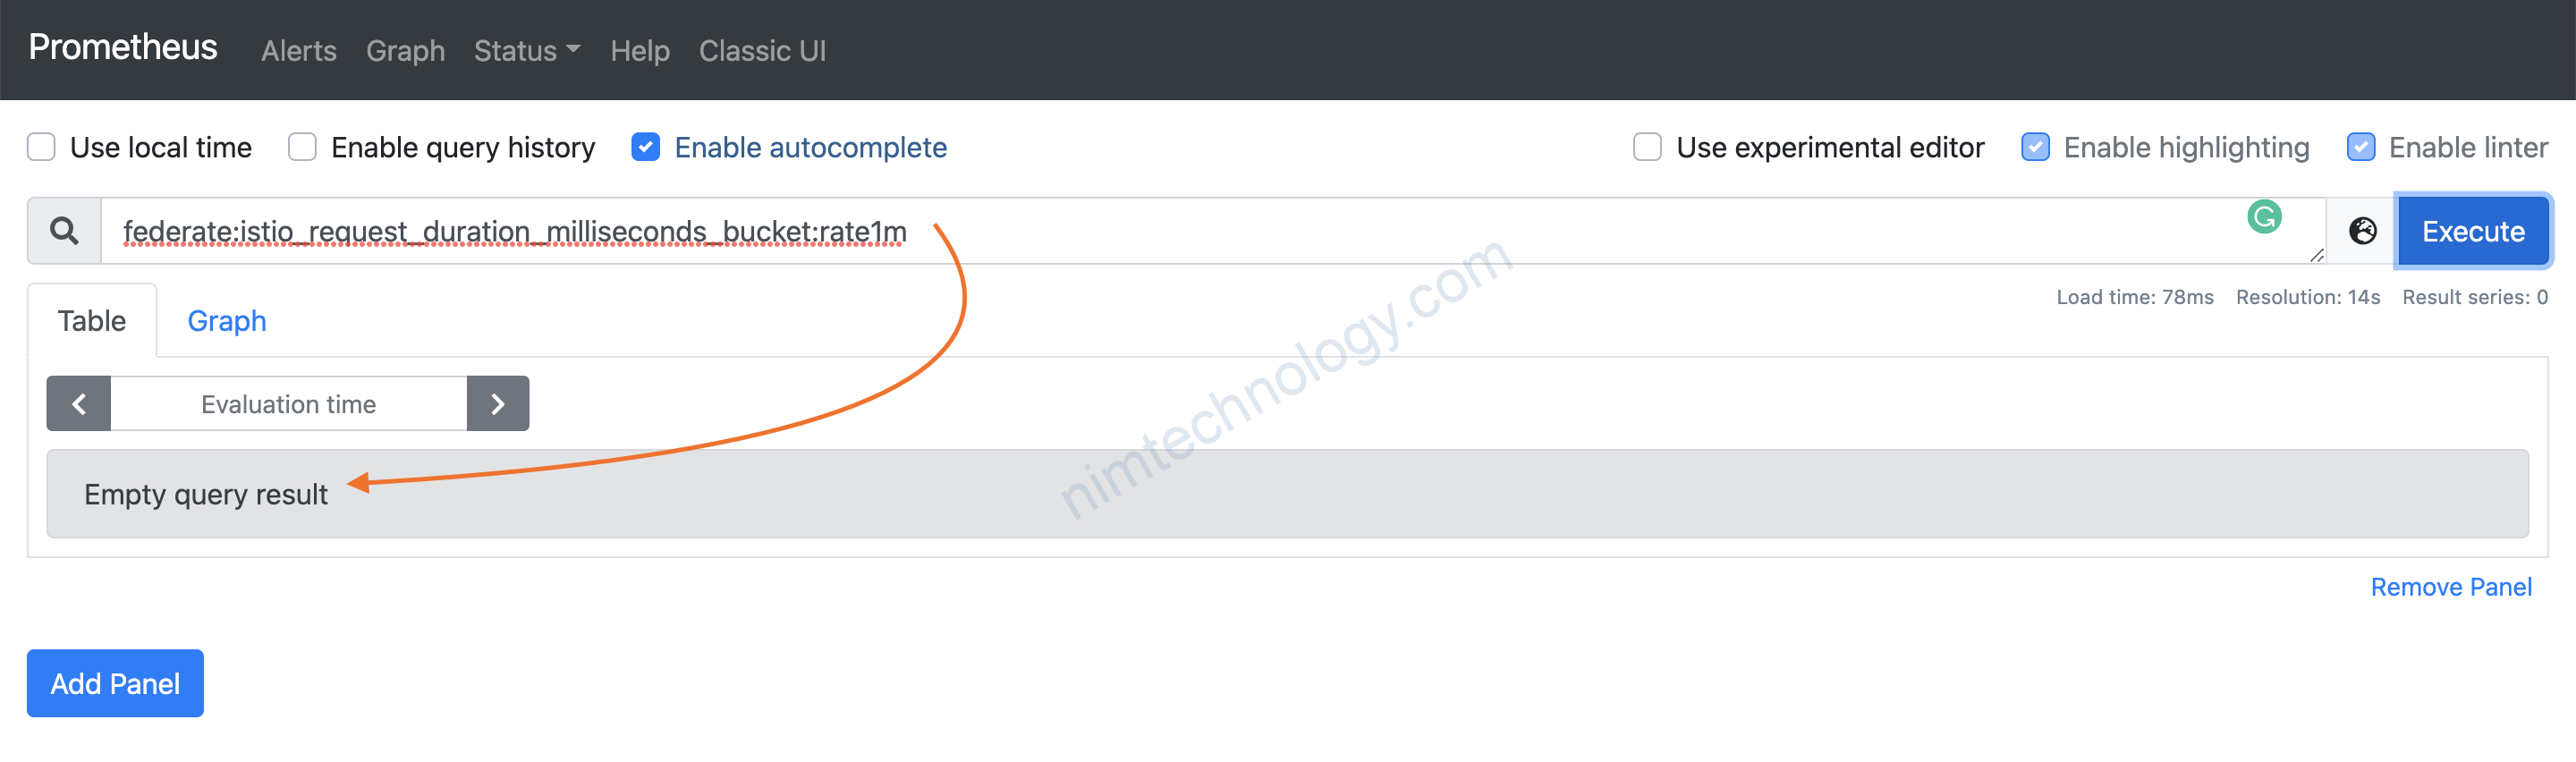
thì ko có data bị chúng ta đã relabel
3) Summary
3.1) Problem.
Tác giả có bảo:
And that’s it, that’s literally all you need to do. At this point, you should have metrics being federated into your top-level Prometheus! You can get an idea of the savings by running count({__name__=~"istio.*"}) in both your collector and master. In our case:
- collector:
count({__name__=~"istio.*"}) 337635 - master:
count({__name__=~"istio.*"}) 10143
An unbelievable reduction. To put this into context, we have 330 workloads with over 1000 pods, and our production Prometheus is running using 2.5GB memory.
Hay ta giảm metrics kìa:
Chúng ta sẽ có chữ nhưng:
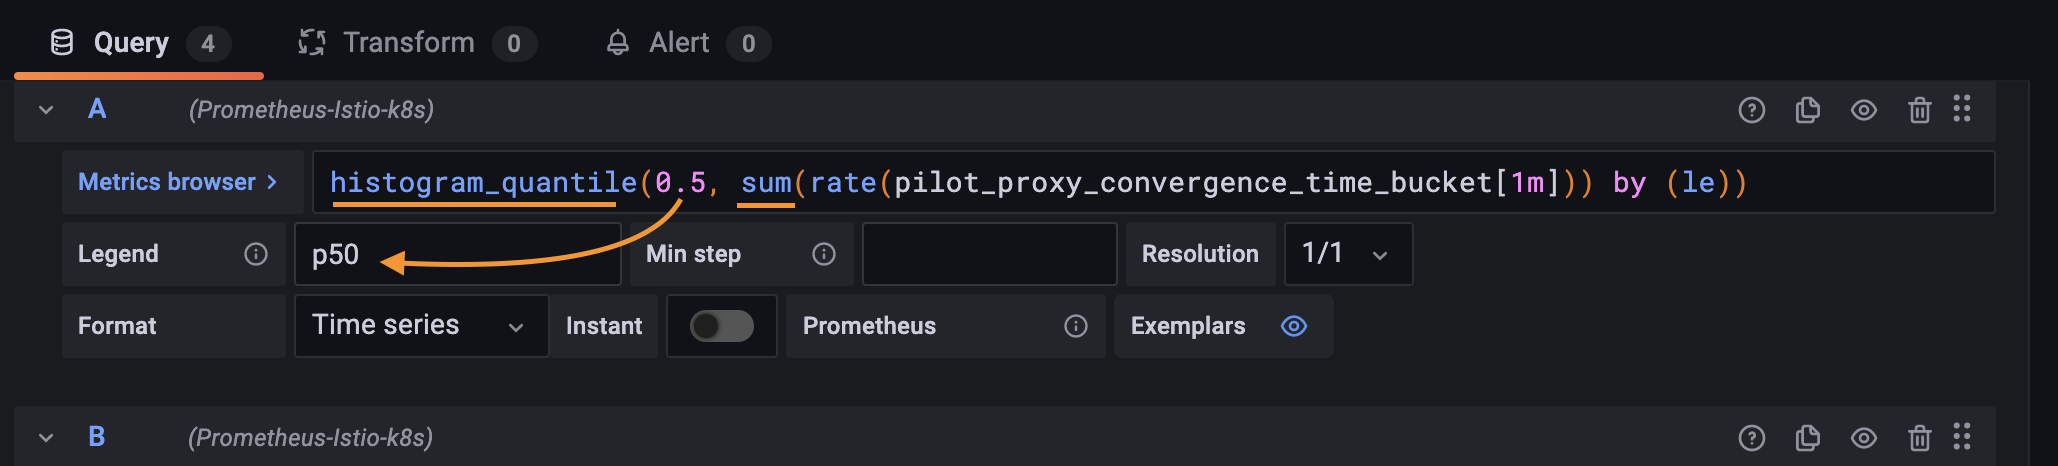
1) chúng ta cần change query trên grafana từ istio_request_duration_milliseconds_bucket
thành istio_request_duration_milliseconds_bucket:rate1m
– việc này khá câù kì vì bạn thấy từ đầu bài viết đến giờ chúng ta cần khá nhiều bước.
2) Cách này sẽ độ delay nhất định như tác giả cũng đã nhắc:
Note the interesting part here, each rule goes into its own group, this is intentional as each rule takes about 4-5 seconds to evaluate on our instance. Remember how I said earlier that rules are evaluated in series, within a group. Therefore, if they were in the same group, this it would take 16-20s to complete evaluation.
This is extremely important, especially when you’re visualizing your data in grafana. If your rule group is taking 30+ seconds to run, your graphs are going to look very clunky, as you only have a snapshot of the data every 30 seconds.
For us, with each group taking 4-5s, plus the 10 second interval means we get the rule recorded around every 15 seconds. Which loosely matches our step_interval in grafana. Perfect.
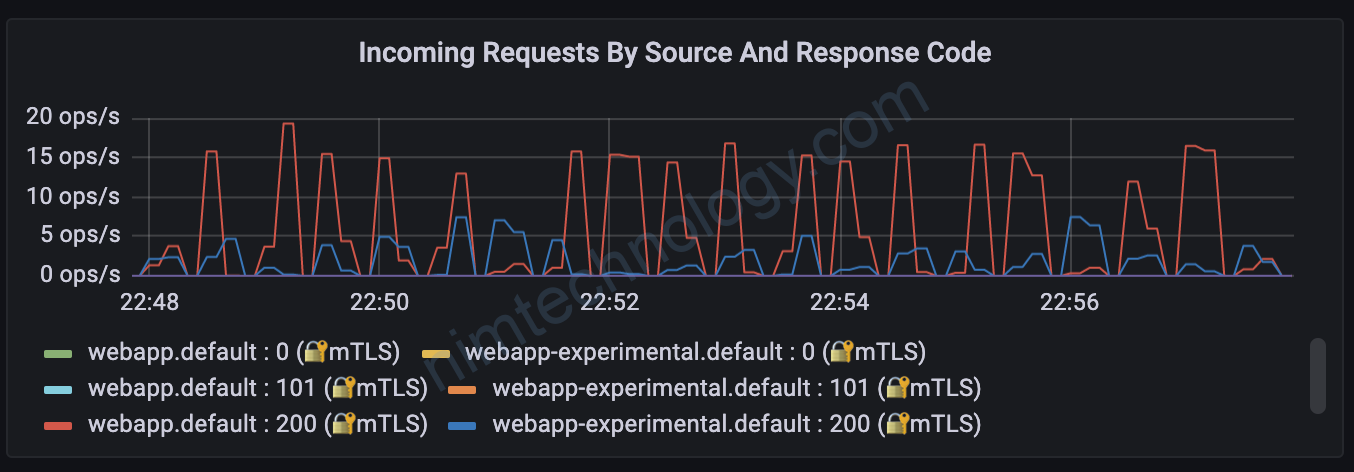
Với các metrics it thì mình thấy nó bị đứt đoạn:

3) Thông số của grafana trả về thì ko match với kết quả test
echo "GET http://192.168.101.51:30765/api/vehicles/driver/City%20Truck" | vegeta attack -duration=600s -rate=200 | vegeta report --type=text
Requests      [total, rate, throughput]         120000, 200.00, 200.00
Duration      [total, attack, wait]             10m0s, 10m0s, 16.396ms
Latencies     [min, mean, 50, 90, 95, 99, max]  2.873ms, 4.905ms, 4.331ms, 6.757ms, 8.085ms, 12.016ms, 257.235ms
Bytes In      [total, mean]                     10200000, 85.00
Bytes Out     [total, mean]                     0, 0.00
Success       [ratio]                           100.00%
Status Codes  [code:count]                      200:120000
Mình gửi vào 200 req/s thì chặc hiện ít hơn nhiều so với kết quả mình test
Ở bài viết này thì chúng học được cách Recording Rules và relabel configs
Còn về việc giảm metrics rồi giảm ram prometheus thì cần xem sét lại.
  recording_rules.yml: |
    groups:
      - name: istio.workload.istio_request_duration_milliseconds_bucket
        interval: 10s
        rules:
          - record: federate:istio_request_duration_milliseconds_bucket:rate1m
            expr: |
              sum(irate(istio_request_duration_milliseconds_bucket{source_workload!=""}[1m]))
                by (
                  reporter,
                  connection_security_policy,
                  source_workload,
                  source_workload_namespace,
                  destination_service,
                  destination_workload,
                  destination_workload_namespace,
                  le
                )
      - name: istio.workload.istio_response_bytes_bucket
        interval: 10s
        rules:

          - record: federate:istio_response_bytes_bucket:rate1m
            expr: |
              sum(irate(istio_response_bytes_bucket{source_workload!=""}[1m]))
                by (
                  reporter,
                  connection_security_policy,
                  source_workload,
                  source_workload_namespace,
                  destination_service,
                  destination_workload,
                  destination_workload_namespace,
                  le
                )
      - name: istio.workload.istio_requests_total
        interval: 10s
        rules:
          - record: federate:istio_requests_total:rate1m
            expr: |
              sum(irate(istio_requests_total{source_workload!=""}[1m]))
                by (
                  reporter,
                  connection_security_policy,
                  source_workload,
                  source_workload_namespace,
                  destination_service,
                  destination_workload,
                  destination_workload_namespace,
                  response_code,
                  response_flags
                )
3.2) Resolve problem.
3.2.1) Grafana
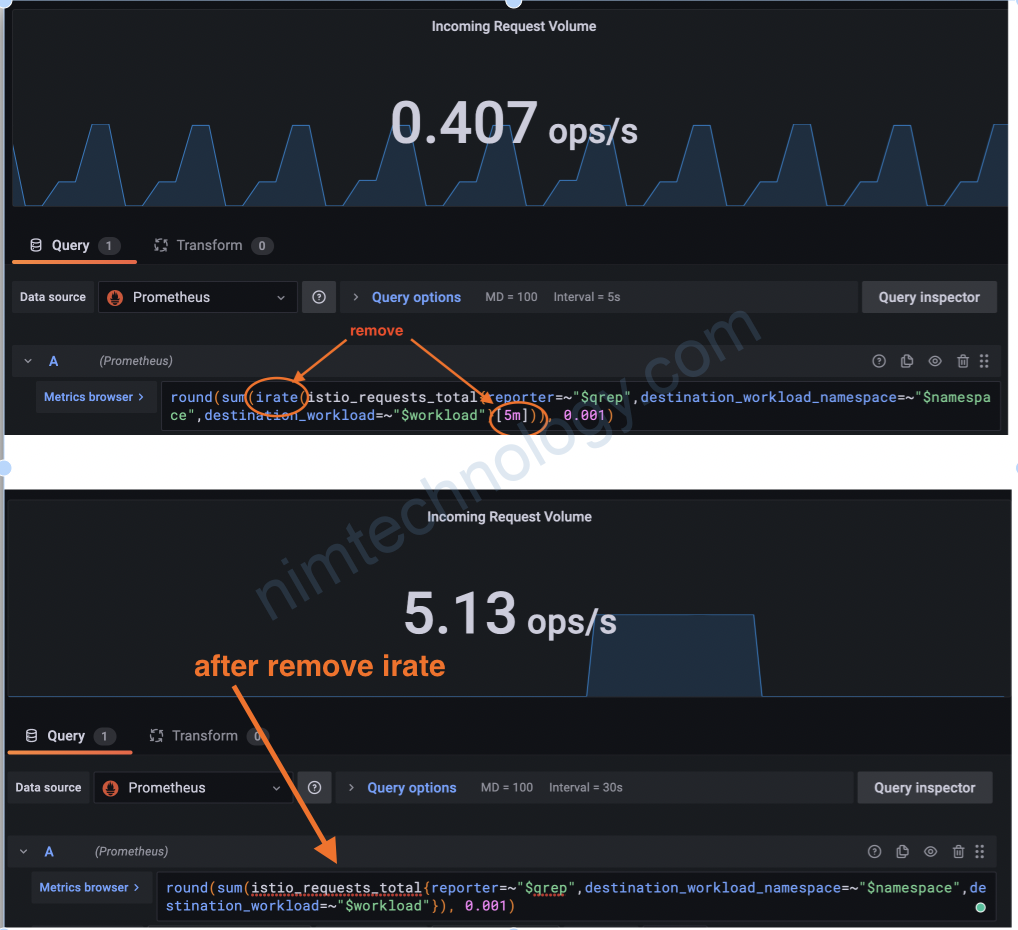
Về vấn để chart grafana bị đứt đoạn:
Mình mới nghĩ ra bị bên các collector mình đã irate[1m] thì chart grafana get data từ master ko cần có tham số irate nữa.
3.2.2) Kiali.
Vì đang chạy mô hình multi cluster istio và mình cũng mong muốn istio hiện thị multi cluster.
Bạn có thể tham khảo link sau:
https://nimtechnology.com/2021/12/12/prometheus-kiali-setting-prometheus-or-kiali-for-multi-cluster-istio-mode/#2_Kiali
Buồn 1 cài khi custom như thế này là chắc chắn mất chart multi cluster trên kiali.
Mình có tìm hiều thì kiali sẽ cần 1 số metric ở prometheus:
https://kiali.io/docs/architecture/architecture/#prometheus
Và đó là những metrics gì thì hình như là ở đây:
https://istio.io/latest/docs/reference/config/metrics/
Nếu có thời gian mình sẽ lab và kiểm chứng.
4) Redude data size of metrics. Using envoyfile.
Links than khảo:
https://karlstoney.com/2020/05/25/reduce-istio-sidecar-metric-cardinality/
Nói chung cách thức ok. Nhưng bạn lưa chọn remove label 1 các hợp lý nhé.