bài viết ở trên khá cũ rồi.
giờ mính sẽ hướng dẫn các bạn chi tiếp
trong grafana các bạn cần chỉnh sửa 1 số phần như sau:
/etc/grafana/grafana.ini
[security]
allow_embedding = true
cookie_samesite = none
cookie_secure = true
allow_embedding = true -> This setting allows Grafana dashboards or panels to be embedded in other web pages via an <iframe>
cookie_samesite = none -> Determines the SameSite attribute of cookies set by Grafana. This controls how cookies are sent with cross-origin requests
cookie_secure = true -> Ensures that cookies are only sent over secure connections (HTTPS).
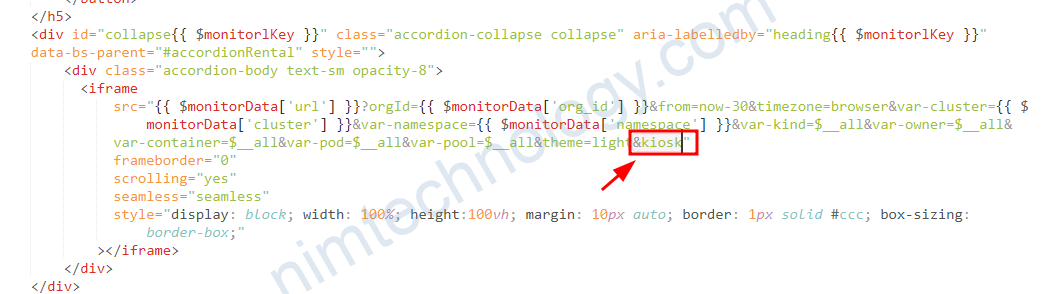
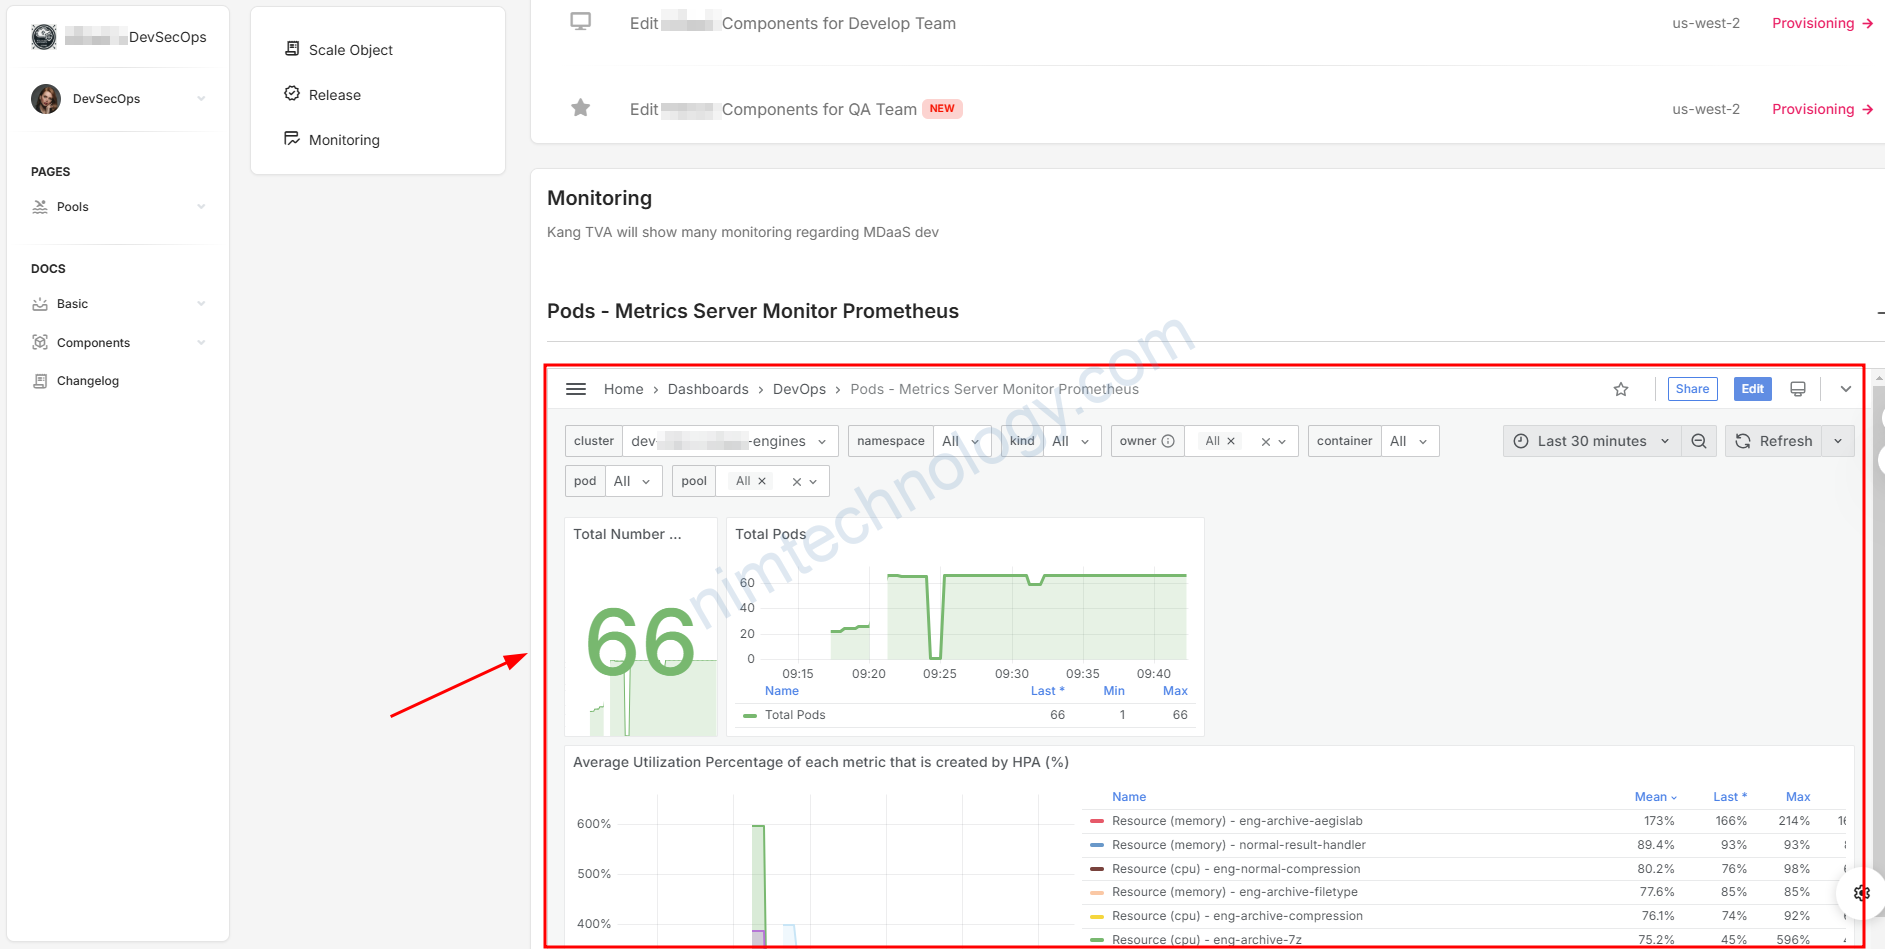
tiếp đến bạn vào trong html là thêm đoạn kiểu như sau:
<div class="accordion-body text-sm opacity-8">
  <iframe
      src="https://timestone.nim.com/d/Ahihihehe/pods-metrics-server-monitor-prometheus?orgId=1&from=now-30&timezone=browser&var-cluster=dev-engines&var-namespace=$__all&var-kind=$__all&var-owner=$__all&var-container=$__all&var-pod=$__all&var-pool=$__all&theme=light"
      frameborder="0"
      scrolling="yes"
      seamless="seamless"
      style="display: block; width: 100%; height:100vh; margin: 10px auto; border: 1px solid #ccc; box-sizing: border-box;"
    ></iframe>
</div>
Nếu bạn thấy giao diện này còn quá nhiều thứ thừa thì thêm &kiosk