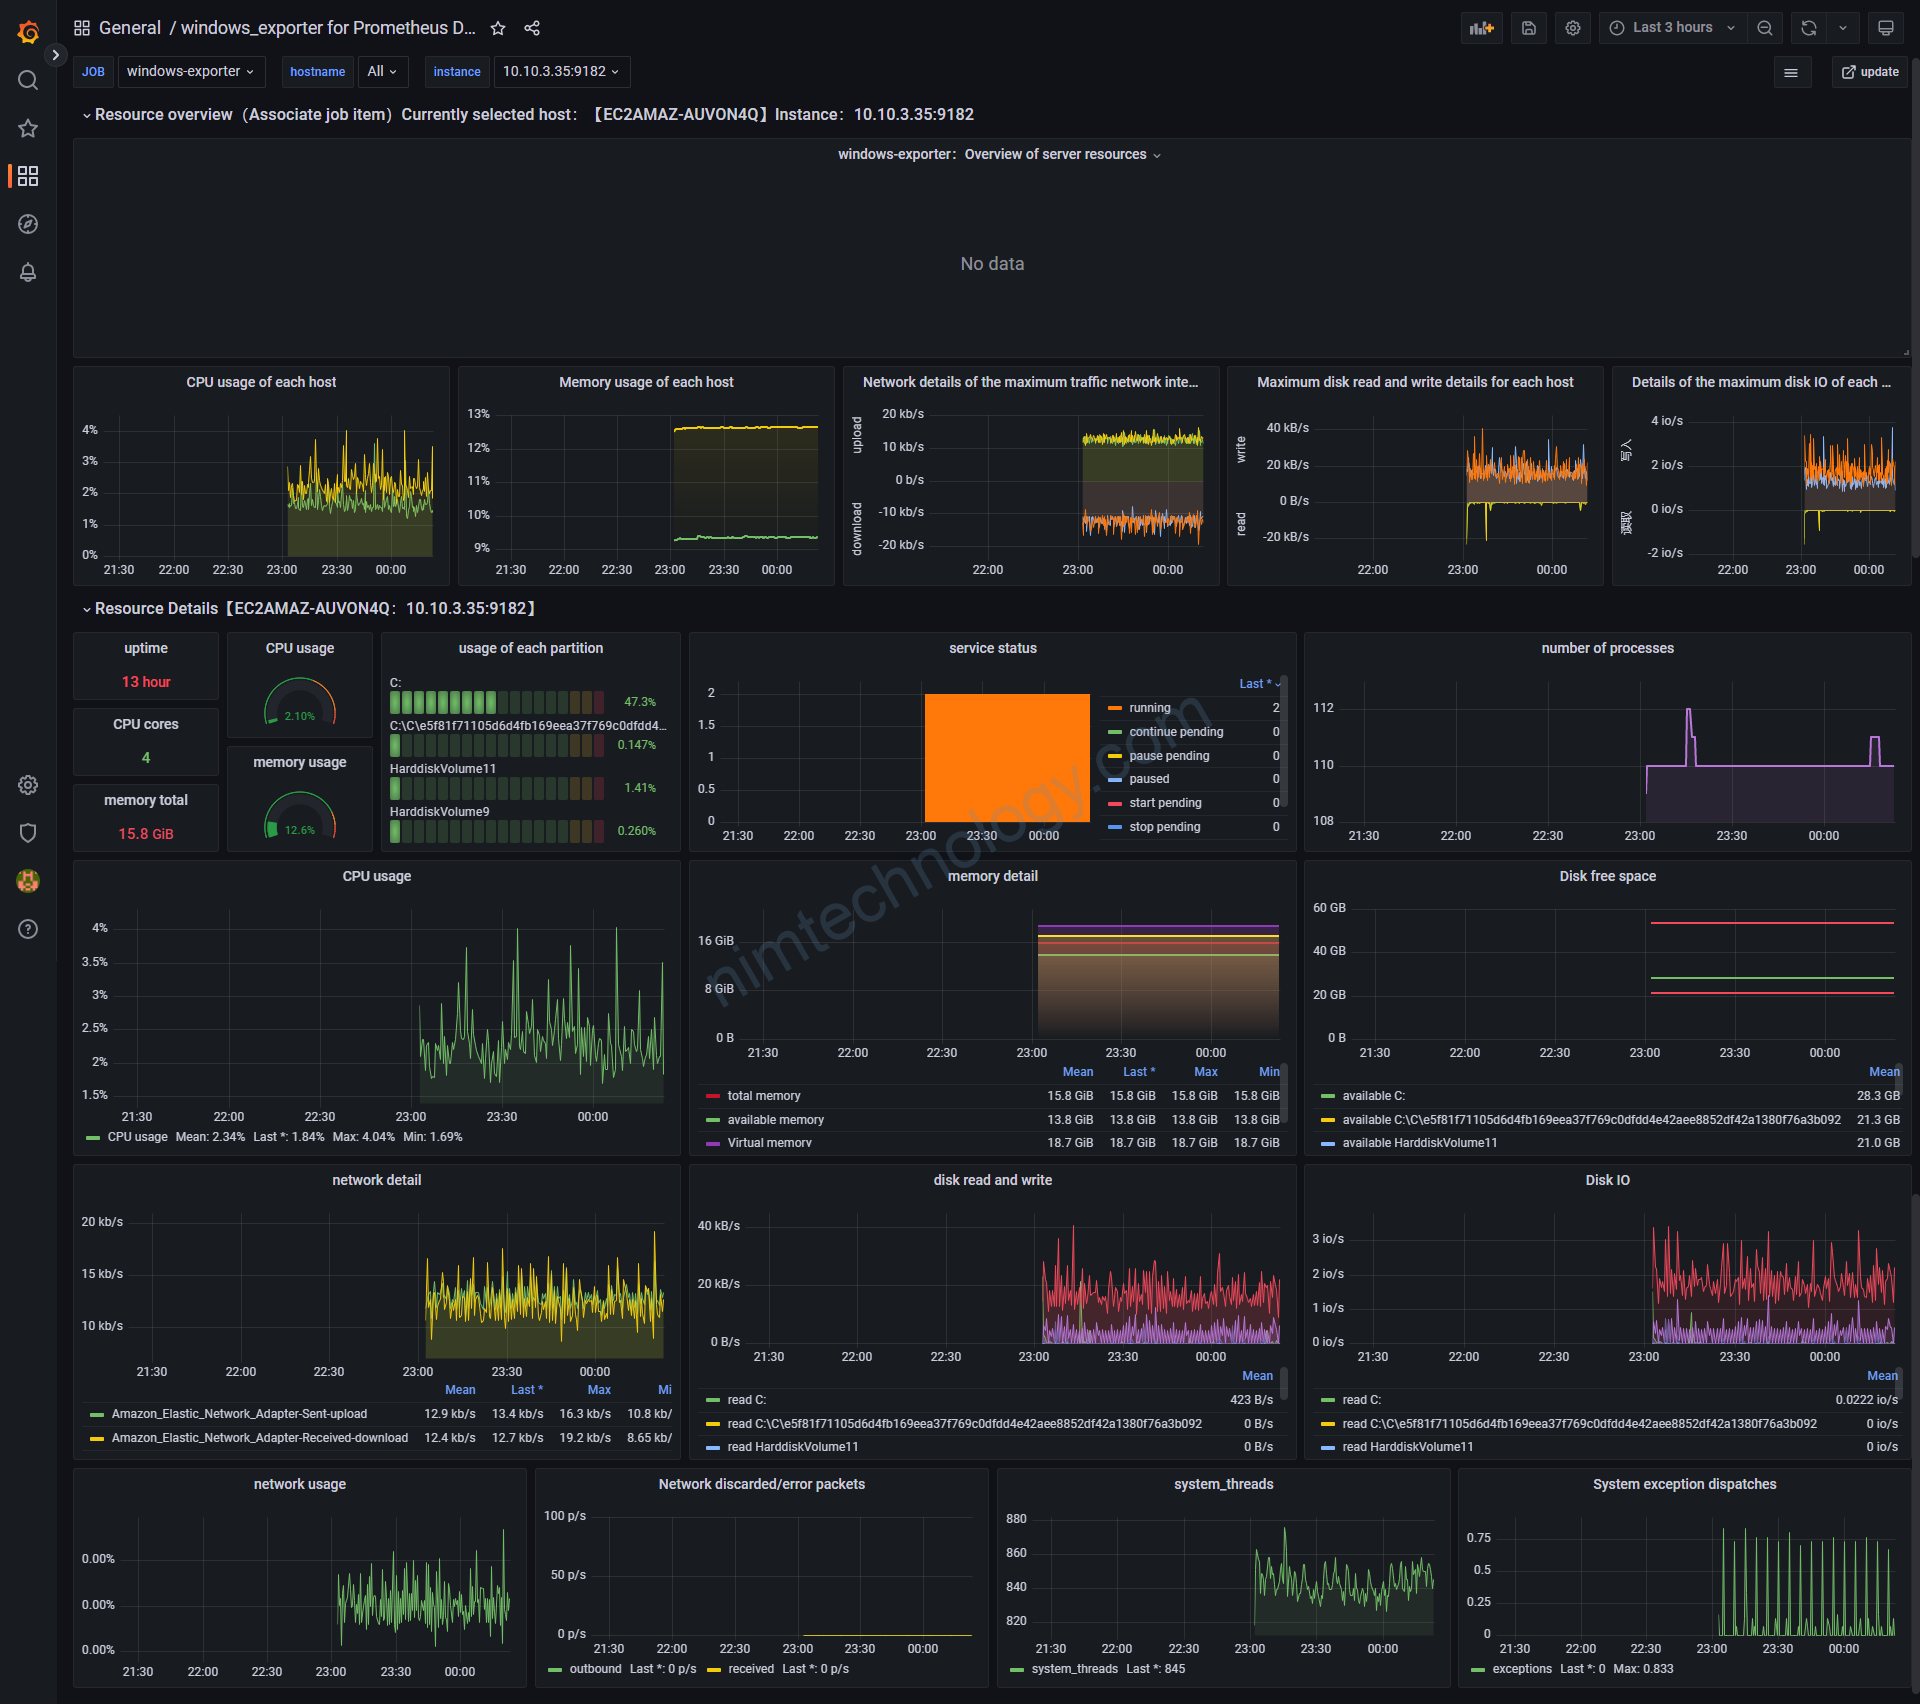
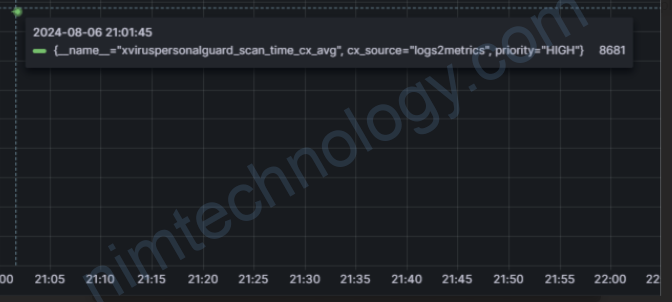
Hiện tại mình gặp 1 tình huống:
Mặc dù deploymnet đó mình đã tắt rồi nhưng chart vẫn hiện thị kết quả.
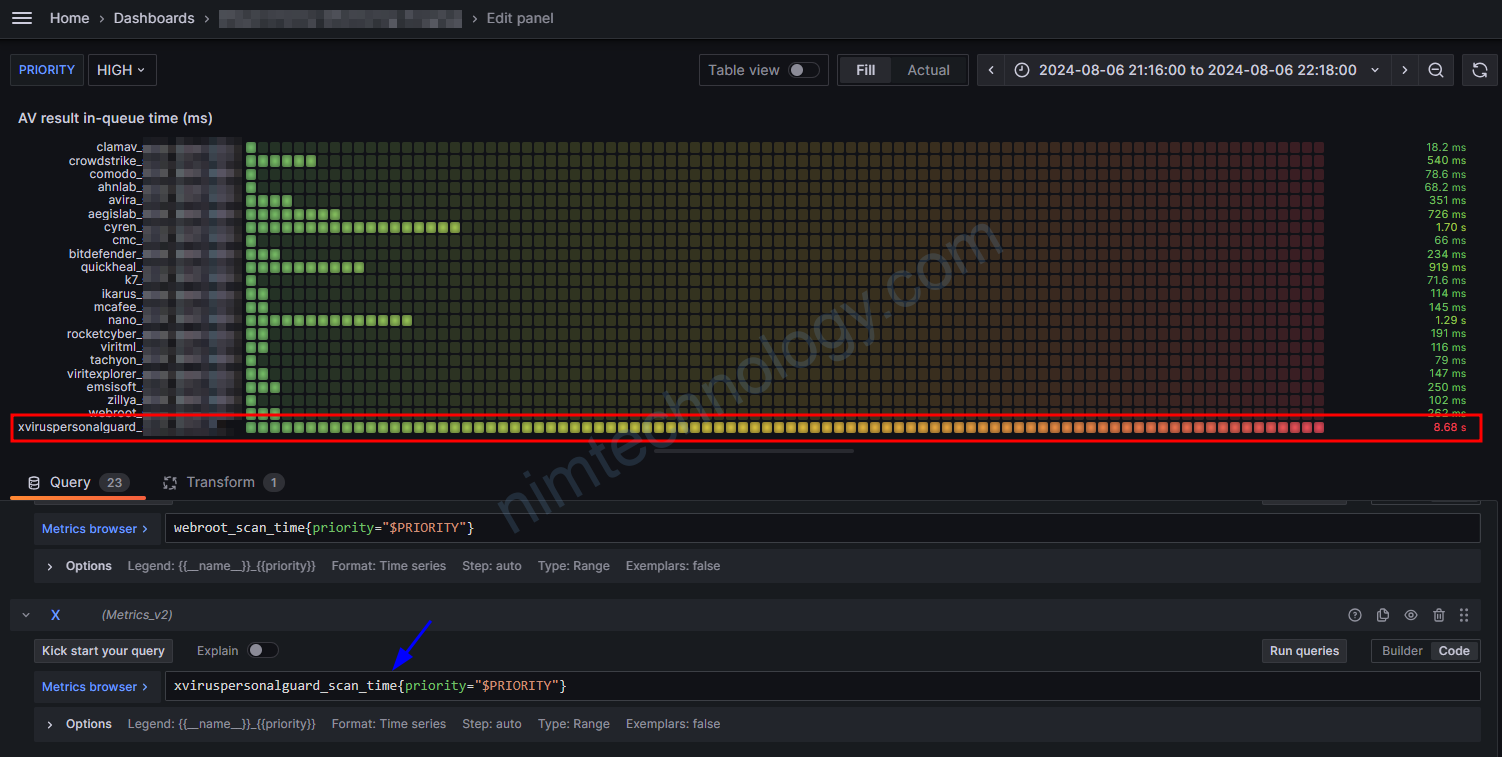
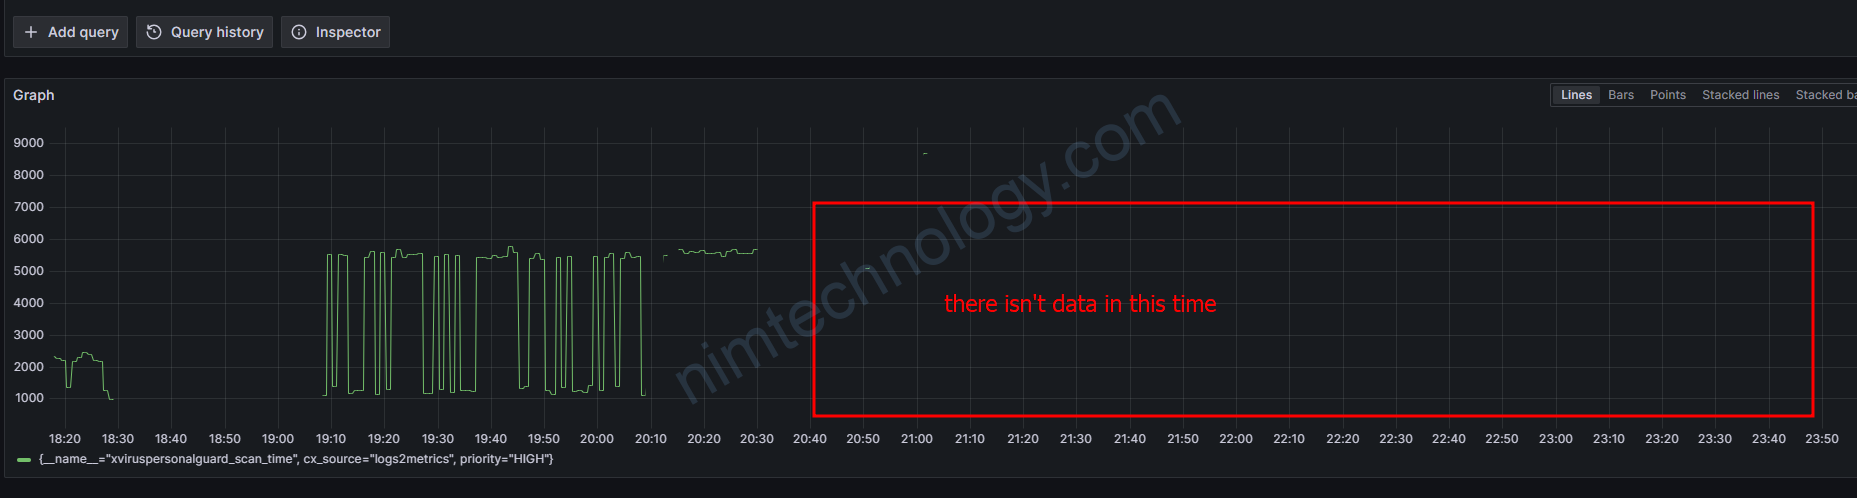
Vậy tại sao chart kia vẫn hiển thị số?
và theo 1 kết luận thì chart đang lấy latest value and not according to follow the time range.
Mình chợt nghĩ ra sử dụng rate và irate
chúng ta sẽ cùng đi vào 1 ví dụ cụ thể:
rate and irate in Prometheus.
Hạy tưởng tượng bạn đang monitoring HTTP request đến 1 server web. Bạn có một counter metrics được gọi là http_requests_total
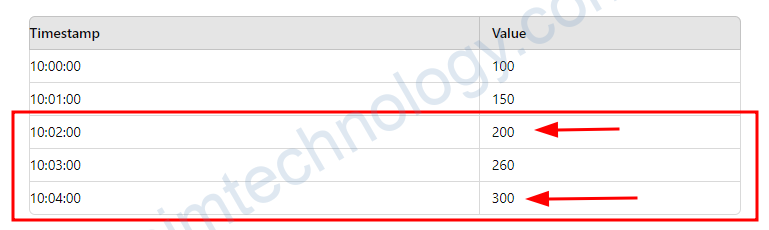
Data Points:
Giả sử bạn có data points cho http_requests_total:
| Timestamp | Value |
|---|---|
| 10:00:00 | 100 |
| 10:01:00 | 150 |
| 10:02:00 | 200 |
| 10:03:00 | 260 |
| 10:04:00 | 300 |
Using rate:
Chúng ta hay cùng tính toán tỉnh lệ của HTTP request trên giây trong khoản thời gian 2 phút (120s)
rate(http_requests_total[3m])Xem sét khoảng thời gian 3 phút cuối tại 10:04:00
– Values: 200 (10:02:00), 260 (10:03:00), 300 (10:04:00)
– Change:
+ From 200 to 300: 300−200=100
+ Time span: 120 seconds (2 minutes)
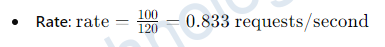
nó sẽ lấy giá trị đầu và giá trị cuối trong khoảng thời gian 3 phút.
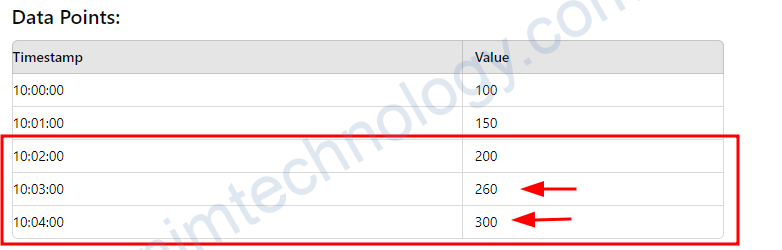
Using irate:
irate(http_requests_total[3m])
Tính toán tỉ lệ tăng ngày lập tức giữa 2 data points cũ nhất trong khoảng thời gian 3 phút.
từ lý thuyết bên trên chúng ta sẽ xem sét khoảng thời gian 1 phút trước 10:04:00
Values: 260 (10:03:00), 300 (10:04:00)
Change:
+ From 260 to 300: 300−260=40
+ Time span: 60 seconds (1 minute)

Nó cung cấp tỉ lệ tăng giữa 2 data point gần nhất, phản ánh những thay đôi ngay lập tức hơn
Rate và irate chỉ sử dụng cho metrics count.
Using the delta and increase functions with a gauge metric
Giả sử chúng ta có data points sau đây: memory_usage_bytes:
| Timestamp | Value (Bytes) |
|---|---|
| 10:00:00 | 1,000,000,000 |
| 10:01:00 | 1,200,000,000 |
| 10:02:00 | 1,400,000,000 |
| 10:03:00 | 1,100,000,000 |
| 10:04:00 | 1,500,000,000 |
Using delta:
Tìm ra memory usage đã được thay đổi như thể nào trong khoảng thời gian 4 phút
delta(memory_usage_bytes[4m])nó sẽ tính toán sự khách nhau giá trị đầu và giá trị cuối trong khoảng thời gian 4 phút:
Start value (10:00:00): 1,000,000,000 bytes
End value (10:04:00): 1,500,000,000 bytes
Using increase:
Nếu bạn muốn biết tổng cộng tăng bao nhiêu trong khoảng thời gian 4 phút.
increase(memory_usage_bytes[4m])This function will sum up all positive changes:
- From 10:00:00 to 10:01:00: 1,200,000,000−1,000,000,000=200,000,000 bytes
- From 10:01:00 to 10:02:00: 1,400,000,000−1,200,000,000=200,000,000 bytes
- From 10:02:00 to 10:03:00: 1,100,000,000−1,400,000,000=−300,000,000 bytes (ignored as it’s a decrease)
- From 10:03:00 to 10:04:00: 1,500,000,000−1,100,000,000=400,000,000 bytes
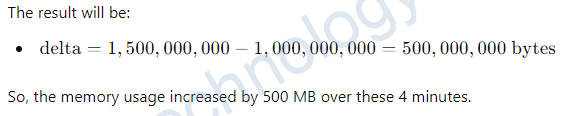
The result will be:
- increase=200,000,000+200,000,000+400,000,000=800,000,000 bytes
Vậy, có 1 tổng tăng trưởng là 800 MB in memory usage trong khoảng 4 phút đó, bỏ qua những khúc giảm.
Finding Minimum Value:
min_over_time(memory_usage_bytes[5m])Nó trả về giá trị nhỏ nhất của memory_usage_bytes trong 5 phút vừa qua
Finding Maximum Value:
max_over_time(memory_usage_bytes[5m])Nó trả về giá trị lớn nhất của memory_usage_bytes trong 5 phút vừa qua
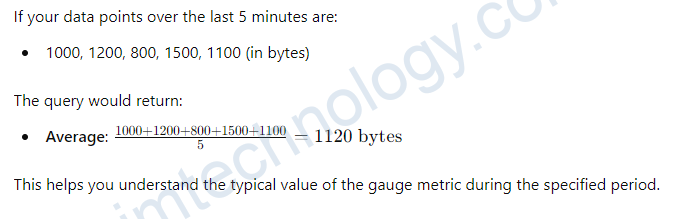
Find the latest and average value:
last_over_time(memory_usage_bytes[5m])Nó trả về giá trị gần nhất của memory_usage_bytes trong 5 phút vừa qua
avg_over_time(memory_usage_bytes[5m])Nó trả về giá trị chung bình of memory_usage_bytes trong 5 phút vừa qua. nó lấy tất các data points trong khoảng thời gian đó. công chúng lại và chia số lượng data points
Kết luận lại mình đã lấy avg_over_time() để giải quyết vấn đề của mình.