Như các bạn cũng đã biết thì Prometheus không thể collect trực tiếp metrics của Cloudwatch.
Mình sẽ cài 1 thằng là cloudwatch-exporter để collect metrics.
Bạn có thể sử dụng bài viết bên dưới
Look into the helpful metrics.
Bài này mình sẽ tập trung nhiều vào việc là tìm ra các metrics có ích cho việc monitor EBS
VolumeReadOps: This metric gives you the total number of read operations from an EBS volume in a specified period of time. Sudden changes could indicate a change in the behavior of the applications using the volume.
VolumeWriteOps: This provides the total number of write operations to an EBS volume. An increase in this metric might suggest higher usage or possibly an issue with your application writing more data than expected.
VolumeReadBytes and VolumeWriteBytes: These metrics represent the total bytes read or written from an EBS volume. These metrics help you understand the amount of data being read or written over time.
VolumeTotalReadTime and VolumeTotalWriteTime: These metrics give you the total time taken for read and write operations. If these values are increasing, it could indicate a performance issue.
VolumeQueueLength: This is an important metric that provides the number of read and write operation requests waiting to be completed. A high queue length might indicate that your volume’s performance is being maxed out.
VolumeIdleTime: This metric gives you the total time that the volume was idle. This can help you identify volumes that are being under-utilized.
Monitoring Latency
We can measure Amazon EBS storage latency using the metrics VolumeTotalReadTime and VolumeTotalWriteTime. We use a formula to plot the total IO time spent to see changes, especially peaks to isolate the cause of latencies.
The formula: (VolumeTotalReadTime + VolumeTotalWriteTime) / (VolumeReadOps + VolumeWriteOps)
The result of this calculation would give you the average time spent per operation, effectively measuring latency. If you see peaks or fluctuations in this value over time, it could indicate potential issues causing latency in your EBS storage.
Also, remember to take the unit of these metrics into account. VolumeTotalReadTime and VolumeTotalWriteTime are measured in seconds, while VolumeReadOps and VolumeWriteOps are count metrics. So, the calculated average latency will be in seconds per operation.
Một cách dễ hiểu hơn:
“Seconds per operation” is a way of measuring how long, on average, each individual operation (like a read or write operation) takes to complete.
Think of it like this: Imagine you’re a postman delivering letters. You have a bag of 100 letters that you need to deliver. If it takes you 200 seconds to deliver all 100 letters, then the average time it took you to deliver one letter (one “operation”) would be 200 seconds / 100 letters = 2 seconds per letter.
In the context of your EBS storage, each “letter” is a read or write operation, and the “time to deliver a letter” is the time it takes to complete that operation. So if the result of the formula is, say, 0.005 seconds per operation, that means each read or write operation takes, on average, 0.005 seconds to complete.
High values mean operations are taking longer to complete, which can be a sign of latency or performance issues. If this value is low, it means your operations are completing quickly, which generally indicates good performance.
Find out IOPS and Throughput
Bides:
IOPS = (VolumeReadOps + VolumeWriteOps) / Time [seconds]
Throughput KBps = (VolumeReadBytes + VolumeWriteBytes ) / Time [seconds]
thường ở đây thì time thì sẽ thay bằng 60
Dashboard Grafana to monitoring EBS-AWS
Đây là Grafana chart để monitor EBS trên AWS
https://gist.github.com/mrnim94/c3e7684fb2435267f21a9caed65e0946
Look into Durability of EBS.
Durability in the context of Amazon Elastic Block Store (EBS) refers to how well your data is protected from being lost. When you store data on an EBS volume, Amazon automatically creates multiple copies of that data behind the scenes. These copies are all stored within the same Amazon “availability zone” (think of it as a data center location), to help ensure that if any single piece of hardware fails, your data is still safe and accessible.
The durability of EBS volumes is mainly due to the fact that each EBS volume is automatically replicated within its Availability Zone to protect you from component failure, offering high availability and durability. That said, EBS volumes are not immune to all forms of failure and AWS recommends regular snapshots for even better backup redundancy.
https://docs.aws.amazon.com/AWSEC2/latest/UserGuide/ebs-volume-types.html
Nếu tôi sài GP3 có làm giảm Ability của my product
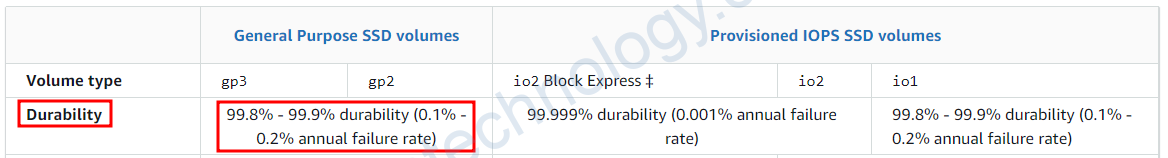
Amazon EBS volumes are designed to be highly available and reliable. As per the data you provided, the durability of EBS General Purpose SSD (gp3) volumes is between 99.8% and 99.9%. This means that if you have 10,000 EBS volumes running continuously for one year, you should expect a failure in around 10 to 20 volumes (0.1% to 0.2%).
- A durability of 99.8% suggests an annual failure rate of 0.2%. This means that, statistically speaking, 2 out of every 1000 gp3 volumes could be expected to fail in a year.
- Similarly, a durability of 99.9% suggests an annual failure rate of 0.1%. In this case, statistically, 1 out of every 1000 gp3 volumes could be expected to fail in a year.
How to recognize the issues regarding the durability
a sudden change in read/write latency or IOPS could indicate a problem with the volume. If an EBS volume fails, it would likely become unresponsive or its attached EC2 instance would experience issues.
What is Amazon EBS Multi-attach
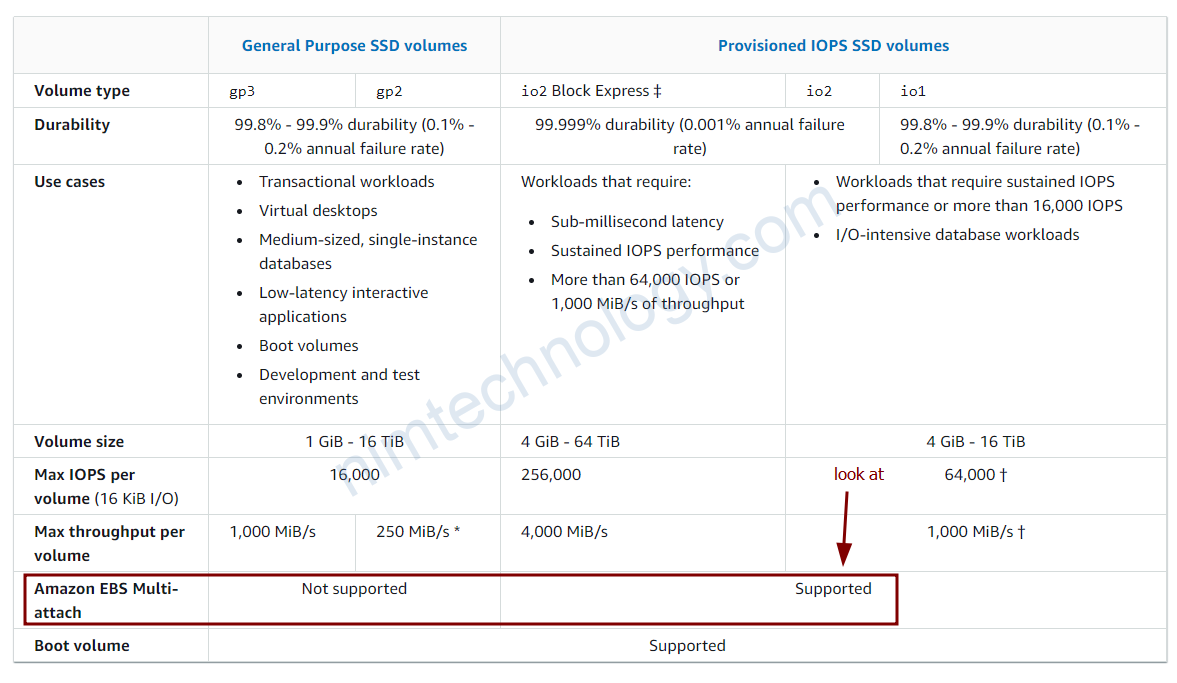
Amazon EBS Multi-Attach is a feature that allows you to attach a single Provisioned IOPS SSD (io1 or io2) volume to multiple EC2 instances in the same Availability Zone. This means that the same EBS volume can be attached to up to 16 EC2 instances.
EBS Multi-Attach can be useful in scenarios where you want to achieve higher availability or need concurrent read/write operations from multiple instances to your data.
However, there are some important considerations while using EBS Multi-Attach:
- Your instances and EBS volumes must be within the same Availability Zone.
- Only certain EC2 instance types support Multi-Attach.
- The operating system of the instances needs to have a cluster-aware file system (like GFS2 for Linux) that manages concurrent access well. Traditional file systems like ext4 or XFS are not designed for multiple servers to write data simultaneously and may corrupt the data.
- While Multi-Attach allows you to attach a volume to multiple instances, it doesn’t provide built-in data replication across Availability Zones or regions.
- You can’t create snapshots of a volume that’s enabled for Multi-Attach while it’s attached to more than one instance.
- Multi-Attach currently only works with Provisioned IOPS SSD (io1 or io2) volumes.
As always, it’s a good practice to review the AWS documentation for the latest information and detailed instructions when working with EBS Multi-Attach.