Skip to content

NimTechnology

Trình bày các công nghệ CLOUD một cách dễ hiểu.

  • Kubernetes & Container
    • Docker
    • Kubernetes
      • Ingress
      • Pod
    • Helm Chart
    • OAuth2 Proxy
    • Isito-EnvoyFilter
    • Apache Kafka
      • Kafka
      • Kafka Connect
      • Lenses
    • Vault
    • Longhorn – Storage
    • VictoriaMetrics
    • MetalLB
    • Kong Gateway
  • CI/CD
    • ArgoCD
    • ArgoWorkflows
    • Argo Events
    • Spinnaker
    • Jenkins
    • Harbor
    • TeamCity
    • Git
      • Bitbucket
  • Coding
    • DevSecOps
    • Terraform
      • GCP – Google Cloud
      • AWS – Amazon Web Service
      • Azure Cloud
    • Golang
    • Laravel
    • Python
    • Jquery & JavaScript
    • Selenium
  • Log, Monitor & Tracing
    • DataDog
    • Prometheus
    • Grafana
    • ELK
      • Kibana
      • Logstash
  • BareMetal
    • NextCloud
  • Toggle search form

[Prometheus] Prometheus to use monitoring k8s

Posted on November 7, 2021March 30, 2023 By nim No Comments on [Prometheus] Prometheus to use monitoring k8s

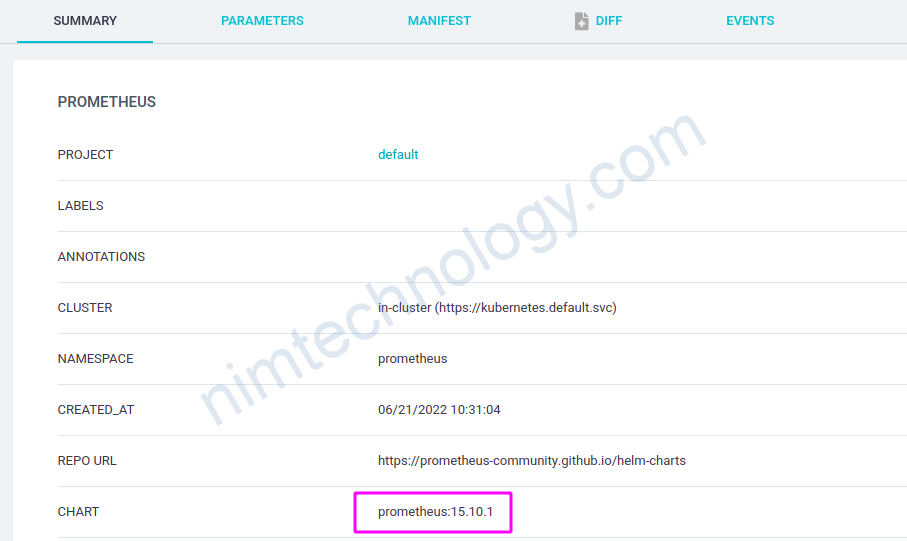
Bạn có thể tham khảo helm chart sau:
https://prometheus-community.github.io/helm-charts

CHúng ta sẽ sử dụng chart prometheus (không sử dụng chart operator)

Phần dưới này đã bị outdate

helm repo add stable https://charts.helm.sh/stable

helm search repo prometheus-operator
NAME                      	CHART VERSION	APP VERSION	DESCRIPTION                                       
stable/prometheus-operator	9.3.2        	0.38.1     	DEPRECATED Provides easy monitoring definitions...

helm show values stable/prometheus-operator > prometheus-operator.yaml

get password admin grafana:

kubectl get secret --namespace <namespace> <name-deployment-grafana> -o jsonpath="{.data.admin-password}" | base64 --decode ; echo


Nếu bạn đã cài được prometheus thì việc tiếp theo là config như thế nào để monitor được application.
Minh đang có 1 workload là spin-clouddriver bằng 1 số câu lệnh hal config … thì mình đã enable metrics của spinnaker lên được

Đây là cái port để xem metrics của pod monitor
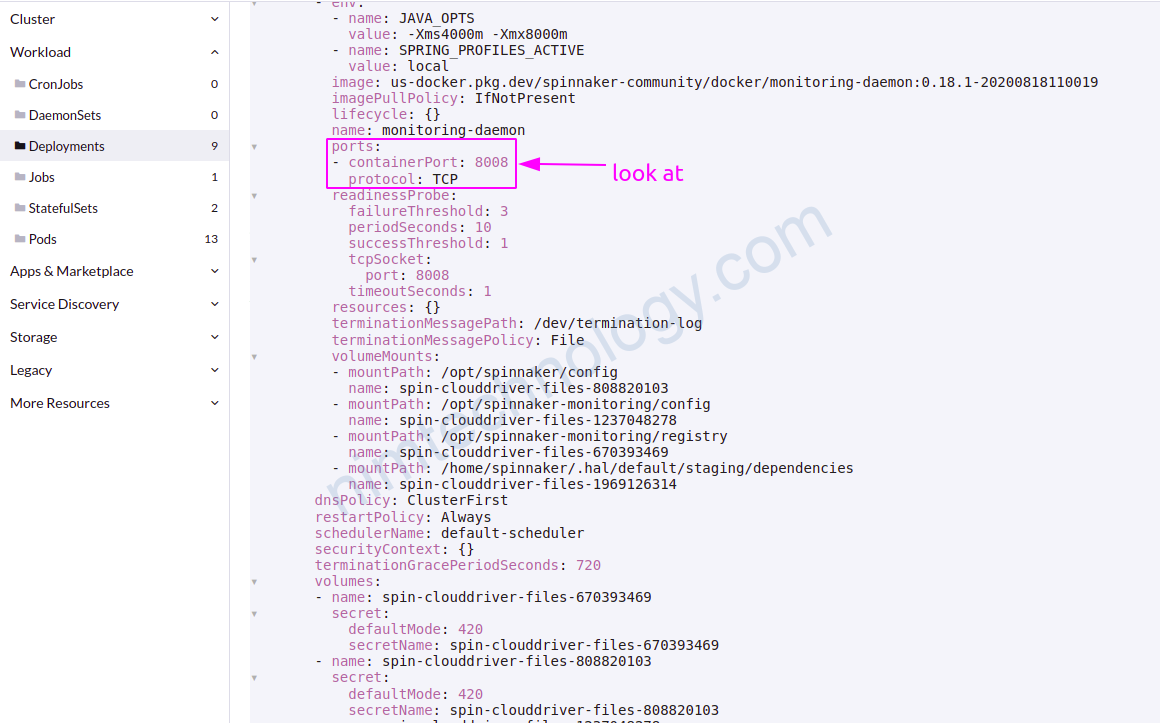
kubectl -n spin port-forward deployments/spin-clouddriver 8008:8008

Mình sử dụng câu lệnh này để forward port của pod ra laptop để test trước

chuẩn bài rồi

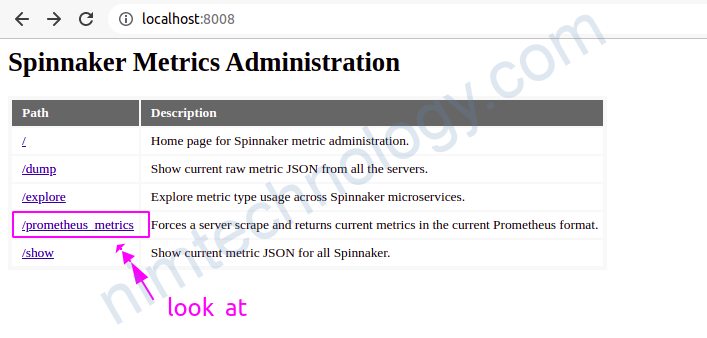
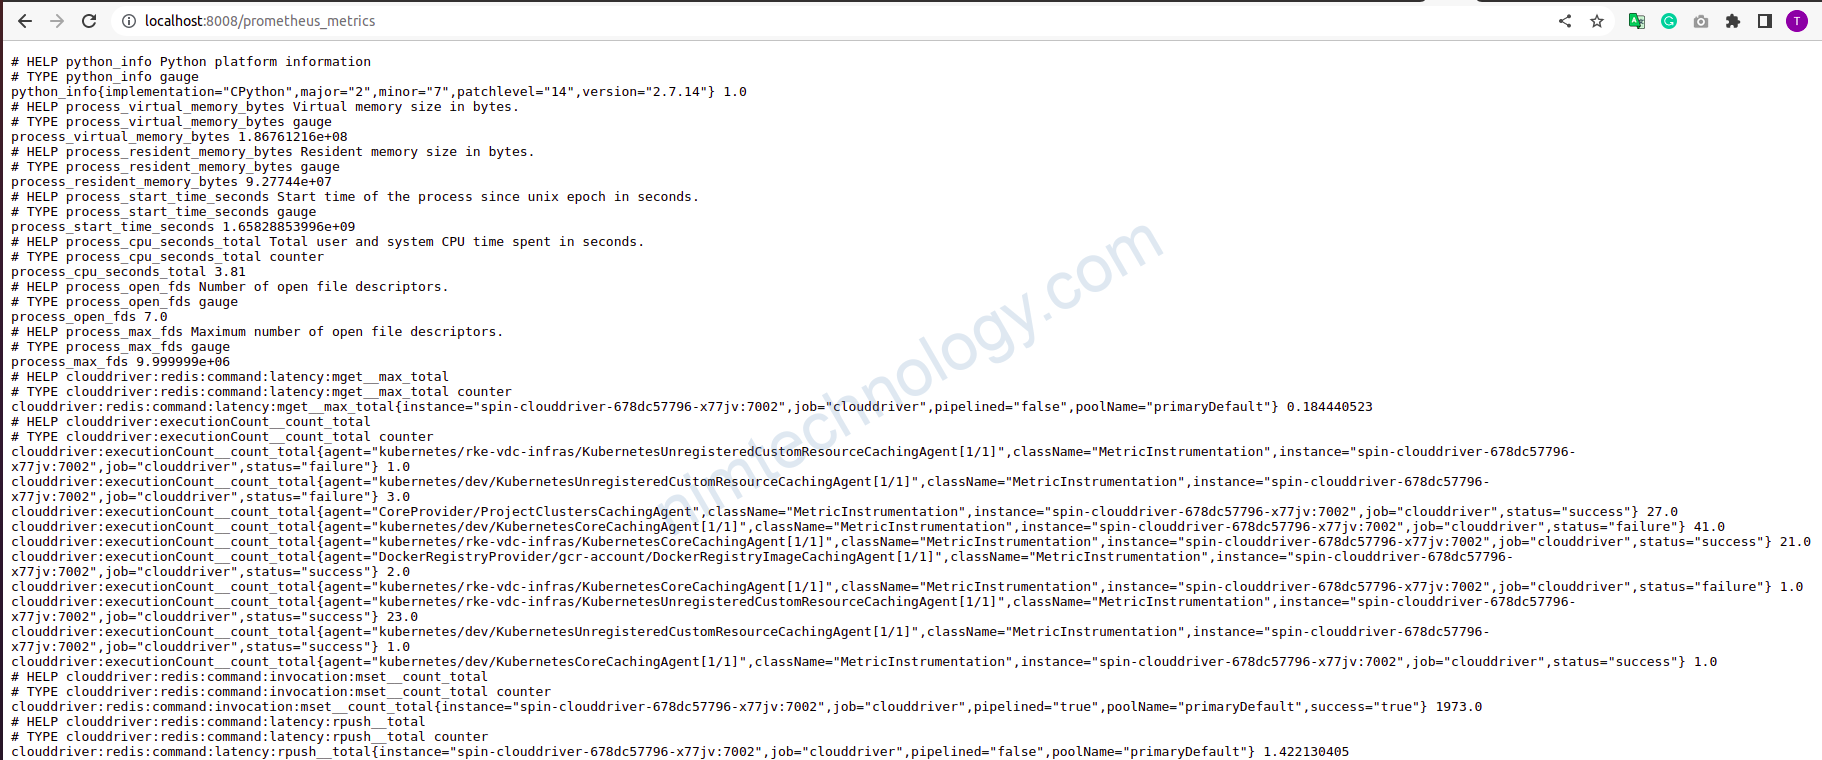
Tiếp theo là làm sao để prometheus đọc được metrics này.

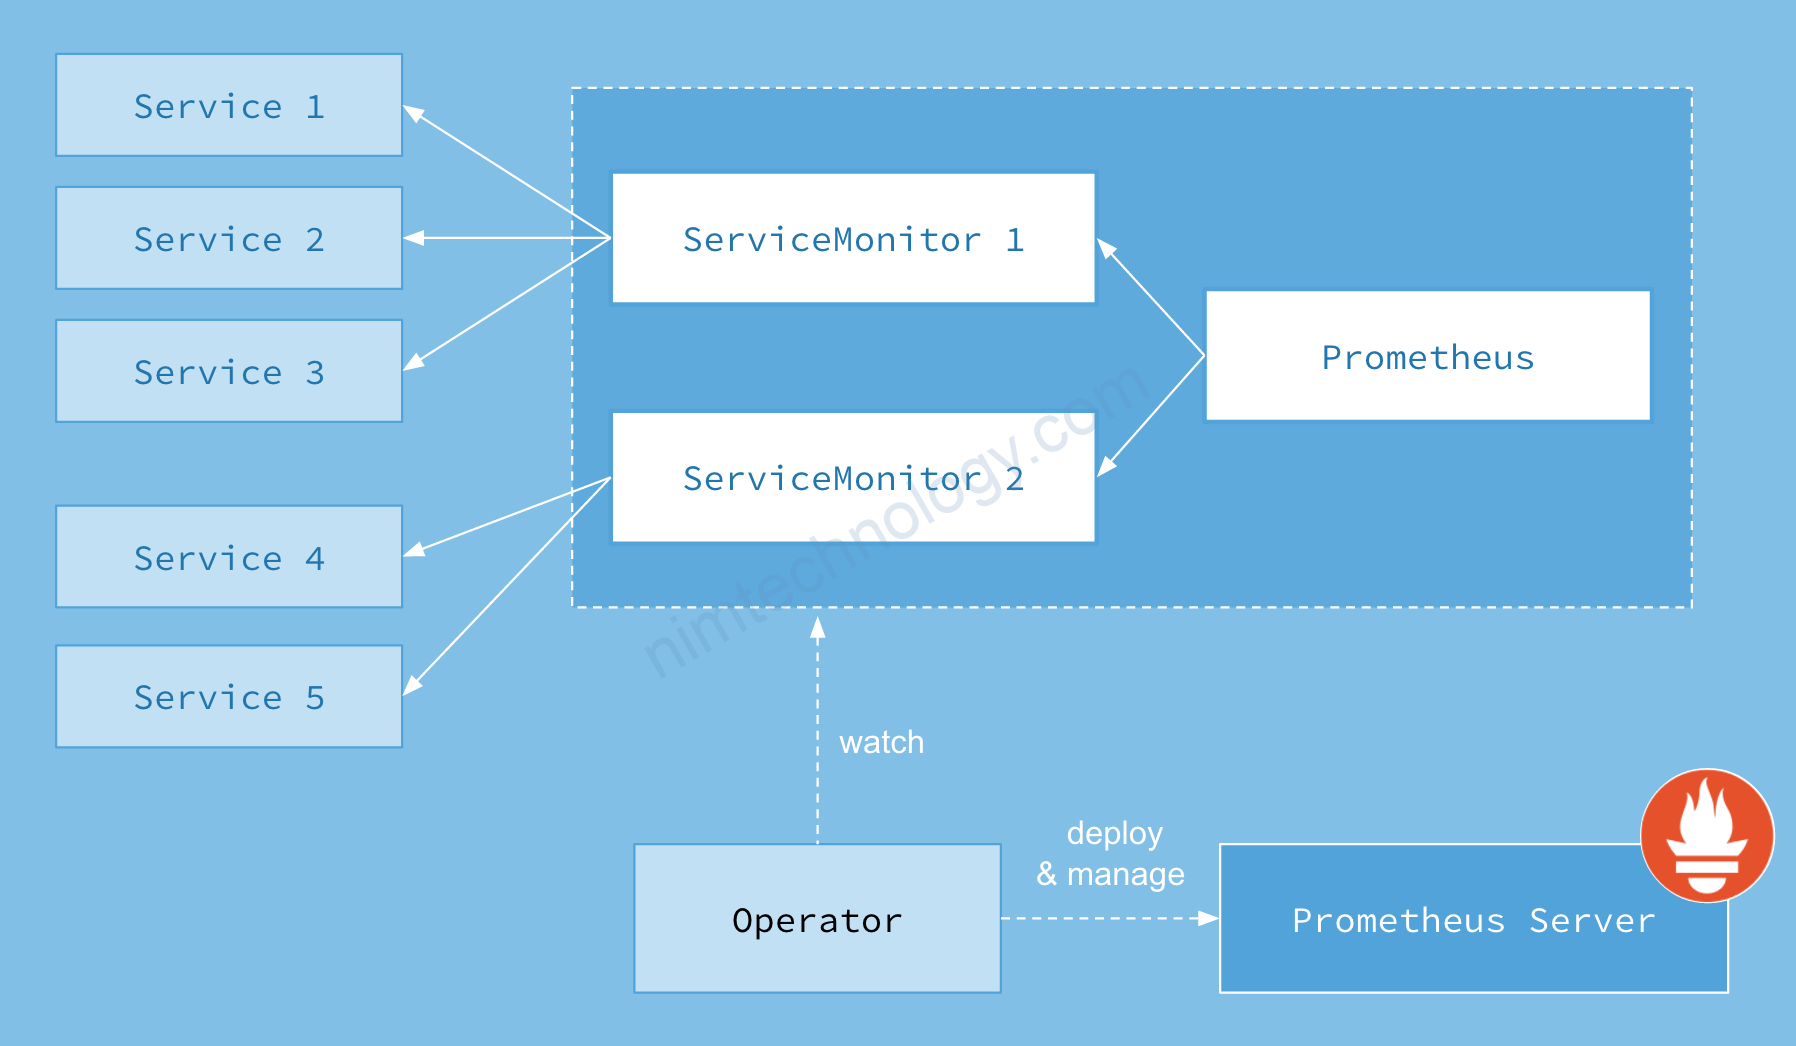
chúng ta sẽ sửa dụng thằng ServiceMonitor

Bạn sẽ thấy là serviceMonitor sẽ connect sang service và lấy metrics.

Referent links:
https://github.com/prometheus-operator/prometheus-operator/blob/main/Documentation/user-guides/getting-started.md
https://stackoverflow.com/questions/52991038/how-to-create-a-servicemonitor-for-prometheus-operator

chúng ta có service như sau:

apiVersion: v1
kind: Service
metadata:
  labels:
    app: spin
    cluster: spin-clouddriver
  name: spin-clouddriver
  namespace: spin
spec:
  ports:
  - port: 7002
    protocol: TCP
    targetPort: 7002
  selector:
    app: spin
    cluster: spin-clouddriver
  type: ClusterIP

Chúng ta sẽ config port service monitor như sau:

apiVersion: monitoring.coreos.com/v1
kind: ServiceMonitor
metadata:
  labels:
    release: prometheus-operator
  name: spin-clouddriver-metrics
  namespace: spin
spec:
  endpoints:
  - interval: 30s
    path: /prometheus_metrics
    targetPort: 8008
  selector:
    matchLabels:
      cluster: spin-clouddriver
lên target của prometheus được như này là ngon!

How Prometheus Operator facilitates Prometheus configuration updates
https://nakamasato.medium.com/how-prometheus-operator-facilitates-prometheus-configuration-updates-a55844186e04

Prometheus

Post navigation

Previous Post: [Jenkins] Lesson 20: Groovy Script Outside of Declarative Pipeline Script
Next Post: [Longhorn] fix No schedule volumes in Taint Toleration Nodes

More Related Articles

[Node exporter] Install node_exporter on Linux by a script file! BareMetal
[Prometheus] Relabelling – Đưa thông tin từ Discovered Label sang target label Log, Monitor & Tracing
[Prometheus/Grafana] Install Prometheus and Grafana on ubuntu. BareMetal
[Prometheus] filter or allowlist metrics before sending to the remote storage via remote_write in Prometheus Prometheus
[Grafana] Draw table visualization in Grafana Prometheus
[Prometheus – Grafana – Monitoring] Look into rate and irate, min, max, average and latest over a specific time. Prometheus

Leave a Reply Cancel reply

Your email address will not be published. Required fields are marked *

Tham Gia Group DevOps nhé!
Để Nim có nhiều động lực ra nhiều bài viết.
Để nhận được những thông báo mới nhất.

Recent Posts

  • [Laravel] Laravel Helpful June 26, 2025
  • [VScode] Hướng dẫn điều chỉnh font cho terminal June 20, 2025
  • [WordPress] Hướng dấn gửi mail trên WordPress thông qua gmail. June 15, 2025
  • [Bitbucket] Git Clone/Pull/Push with Bitbucket through API Token. June 12, 2025
  • [Teamcity] How to transfer the value from pipeline A to pipeline B June 9, 2025

Archives

  • June 2025
  • May 2025
  • April 2025
  • March 2025
  • February 2025
  • January 2025
  • December 2024
  • November 2024
  • October 2024
  • September 2024
  • August 2024
  • July 2024
  • June 2024
  • May 2024
  • April 2024
  • March 2024
  • February 2024
  • January 2024
  • December 2023
  • November 2023
  • October 2023
  • September 2023
  • August 2023
  • July 2023
  • June 2023
  • May 2023
  • April 2023
  • March 2023
  • February 2023
  • January 2023
  • December 2022
  • November 2022
  • October 2022
  • September 2022
  • August 2022
  • July 2022
  • June 2022
  • May 2022
  • April 2022
  • March 2022
  • February 2022
  • January 2022
  • December 2021
  • November 2021
  • October 2021
  • September 2021
  • August 2021
  • July 2021
  • June 2021

Categories

  • BareMetal
    • NextCloud
  • CI/CD
    • Argo Events
    • ArgoCD
    • ArgoWorkflows
    • Git
      • Bitbucket
    • Harbor
    • Jenkins
    • Spinnaker
    • TeamCity
  • Coding
    • DevSecOps
    • Golang
    • Jquery & JavaScript
    • Laravel
    • NextJS 14 & ReactJS & Type Script
    • Python
    • Selenium
    • Terraform
      • AWS – Amazon Web Service
      • Azure Cloud
      • GCP – Google Cloud
  • Kubernetes & Container
    • Apache Kafka
      • Kafka
      • Kafka Connect
      • Lenses
    • Docker
    • Helm Chart
    • Isito-EnvoyFilter
    • Kong Gateway
    • Kubernetes
      • Ingress
      • Pod
    • Longhorn – Storage
    • MetalLB
    • OAuth2 Proxy
    • Vault
    • VictoriaMetrics
  • Log, Monitor & Tracing
    • DataDog
    • ELK
      • Kibana
      • Logstash
    • Fluent
    • Grafana
    • Prometheus
  • Uncategorized
  • Admin

Copyright © 2025 NimTechnology.