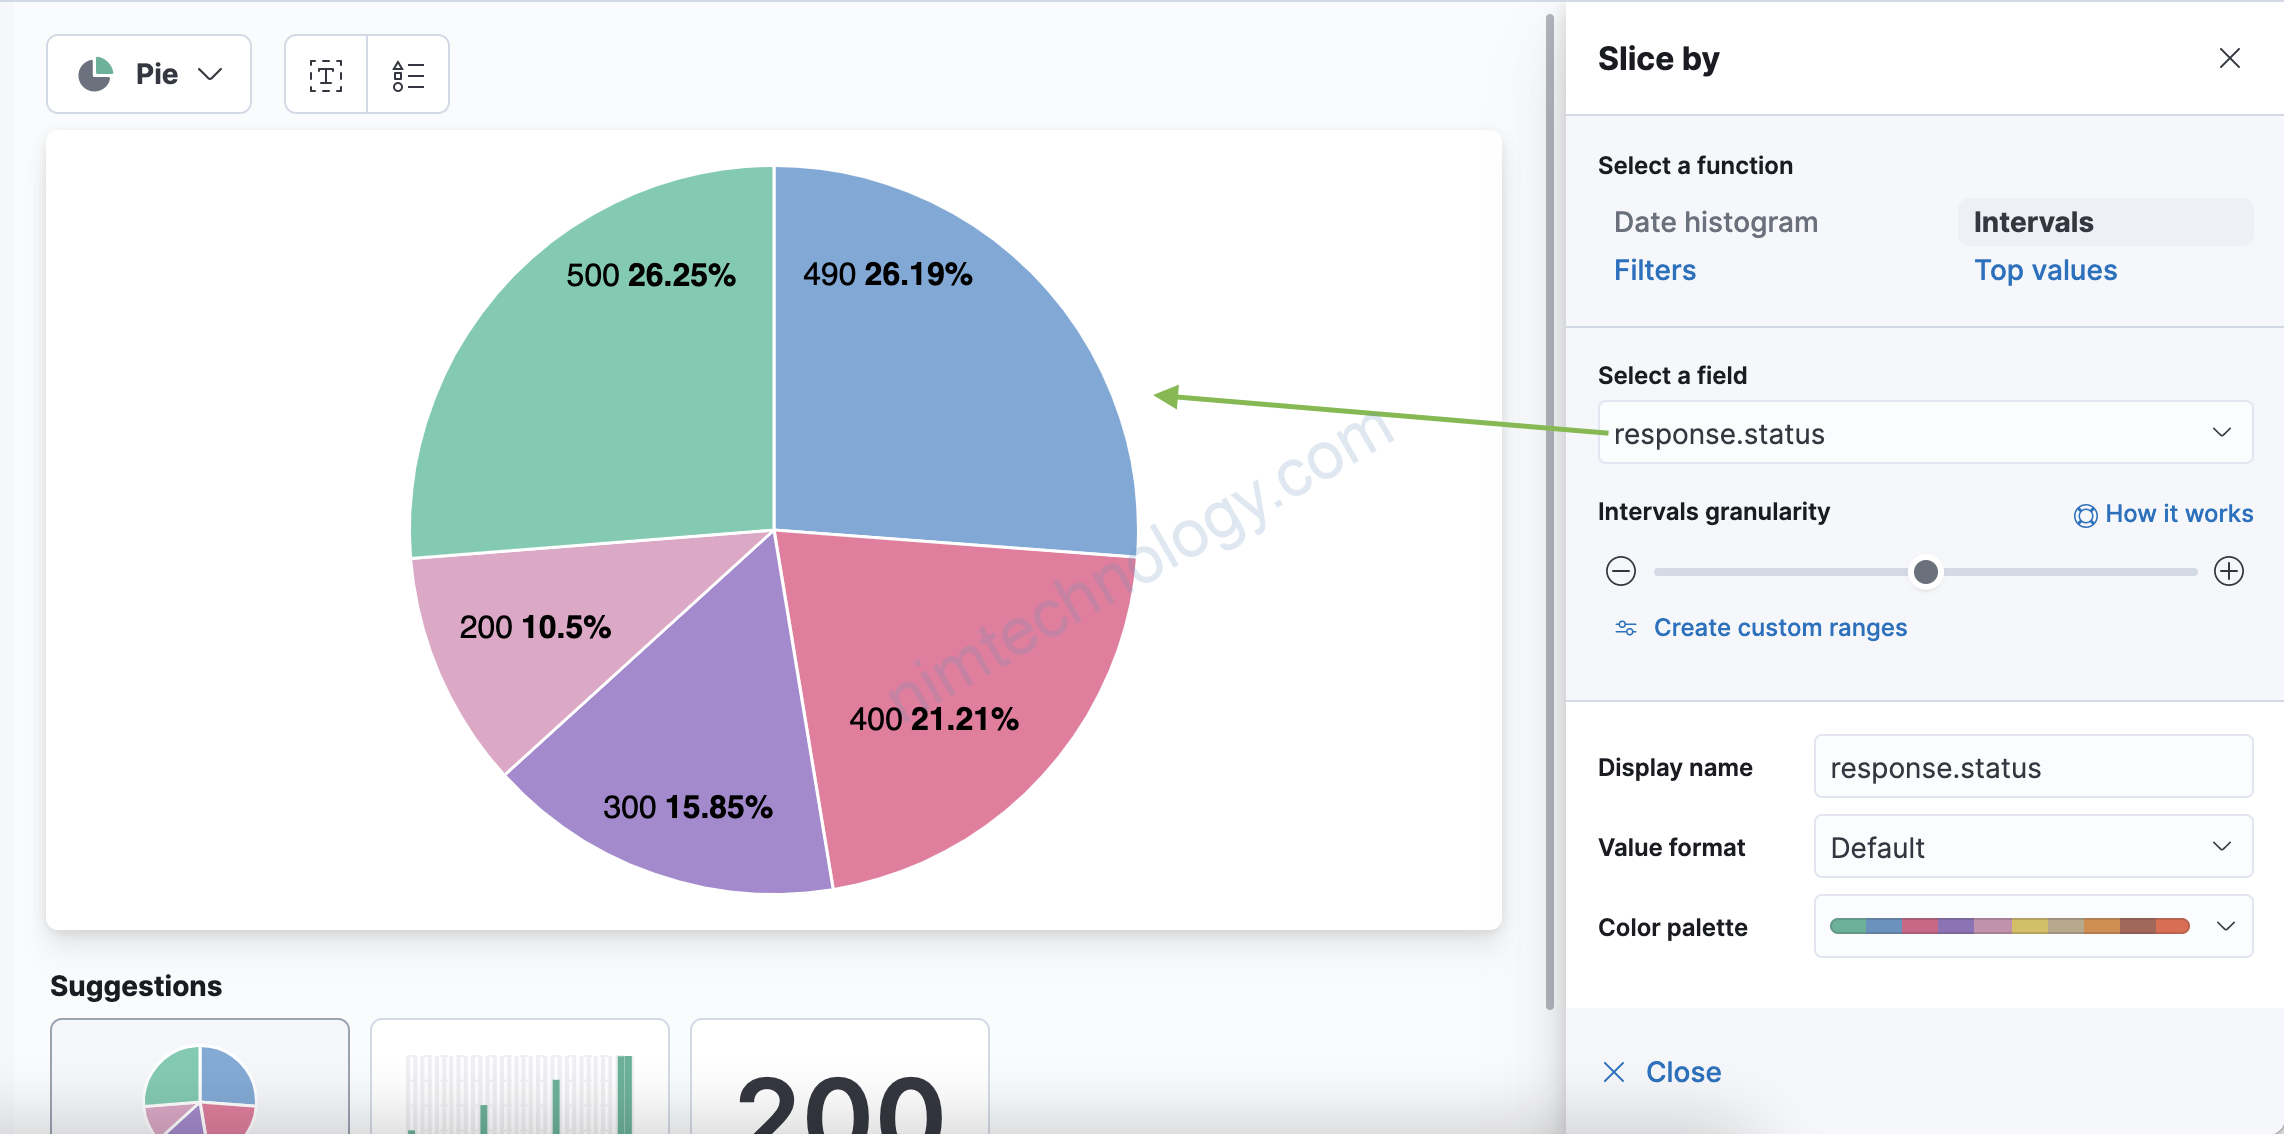
Pie chart thì chúng ta để. view theo kiểu tổng kết bao nhiêu phần trăm (percent %).
Ví dụ: các response là gì và chiếm bao nhiêu phần trăm.
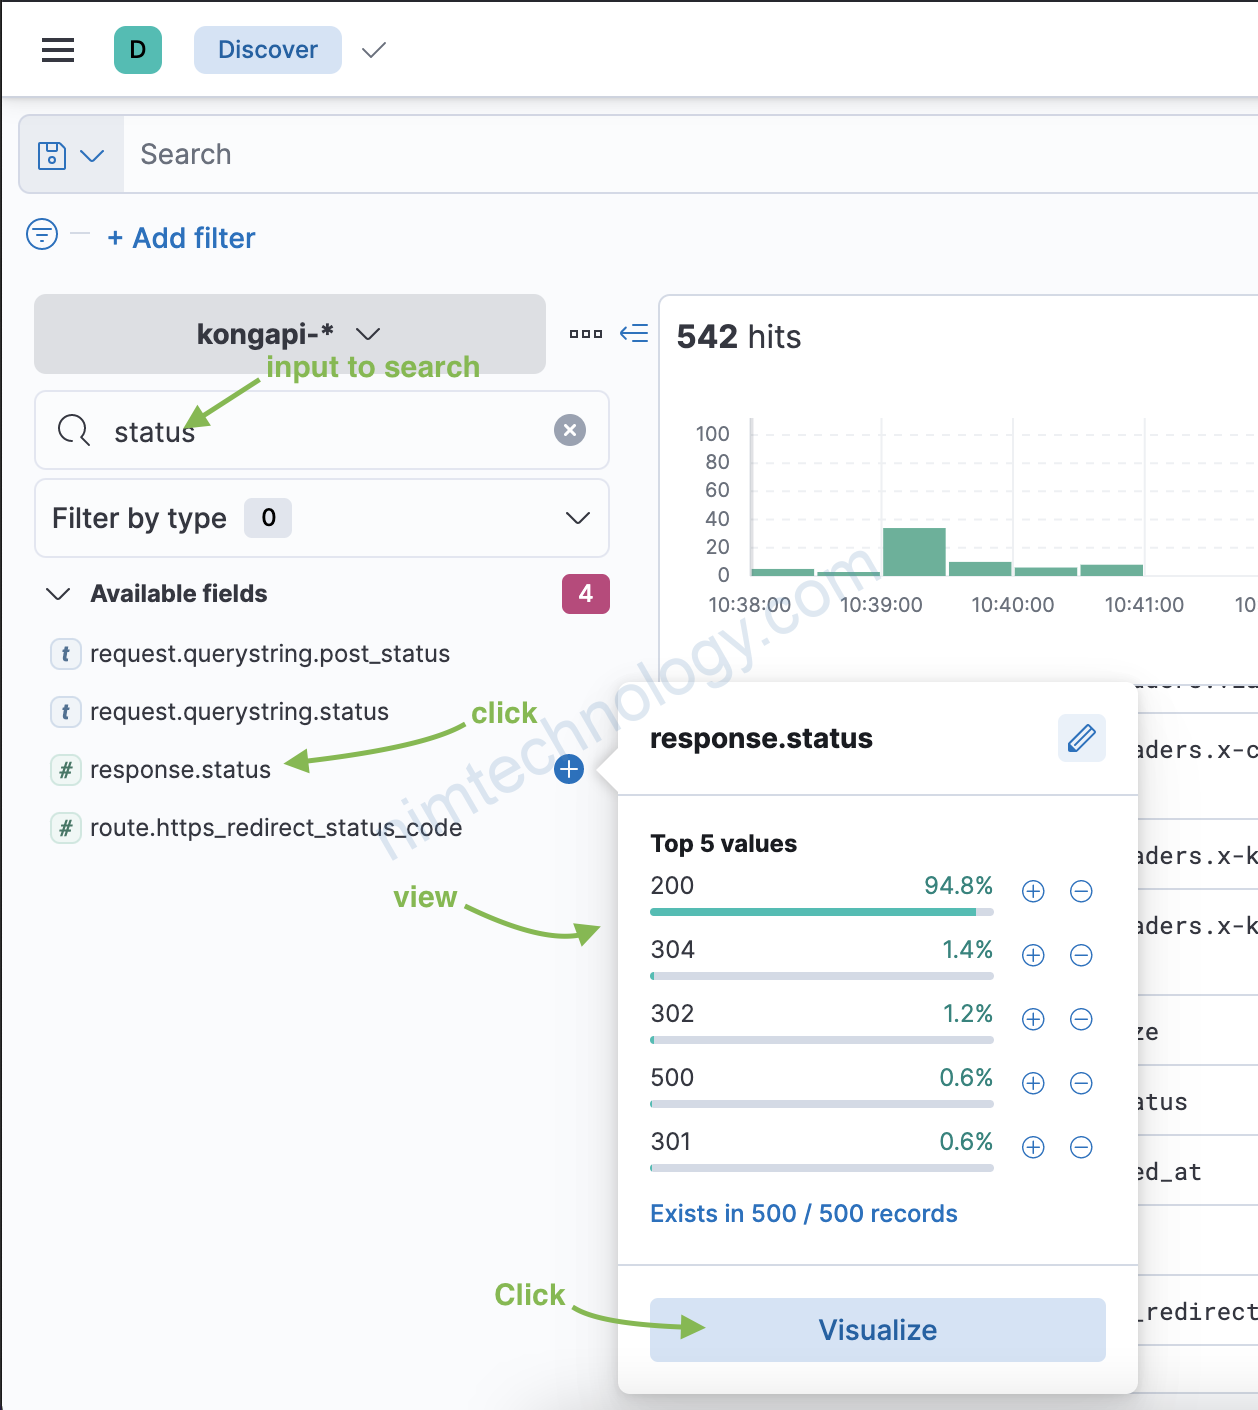
Bước 1 vào discover:
![](https://nimtechnology.com/wp-content/uploads/2022/01/image-221.png)
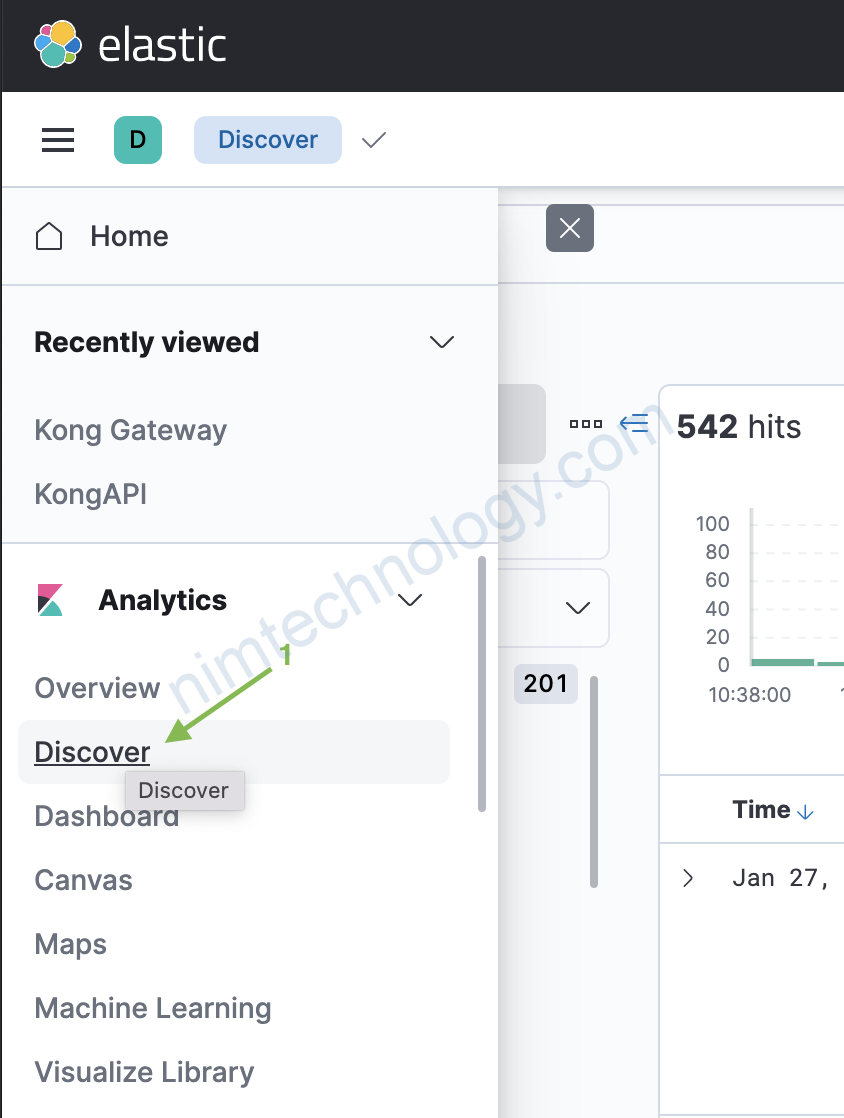
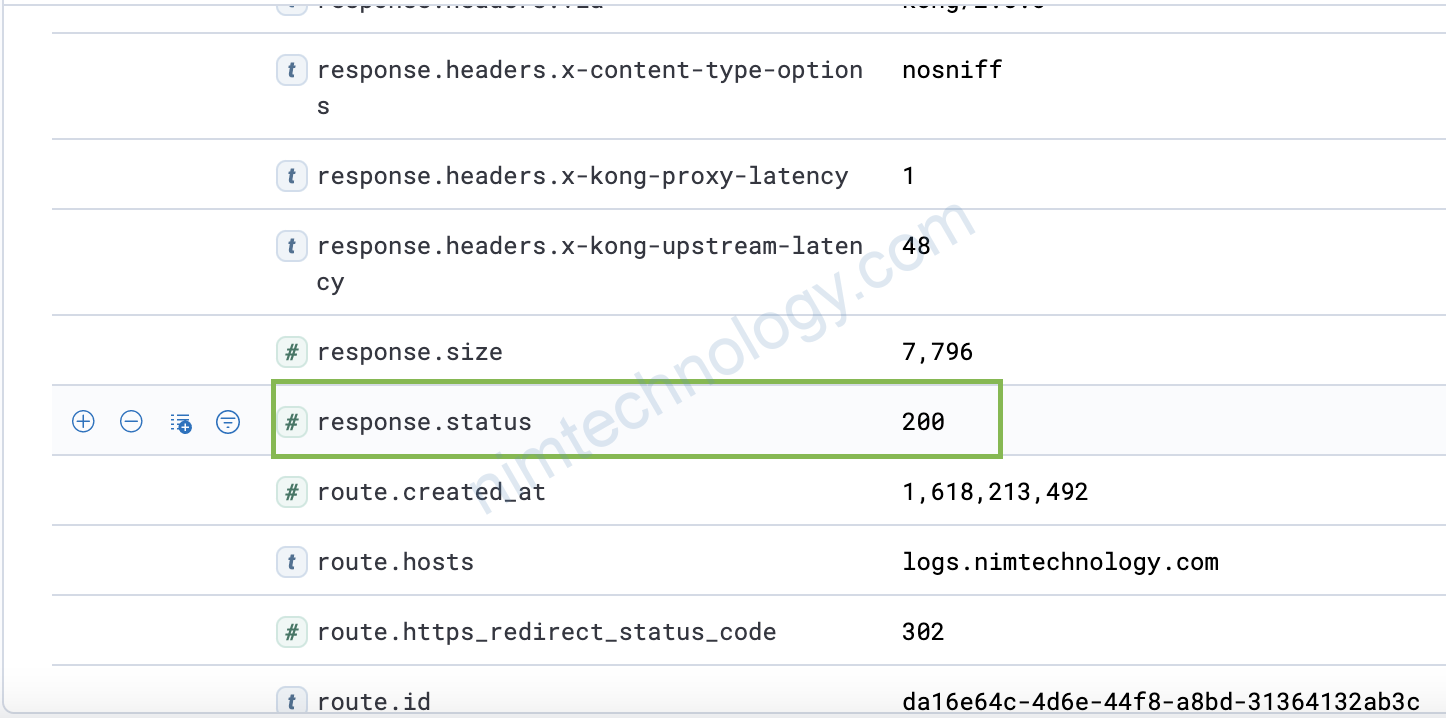
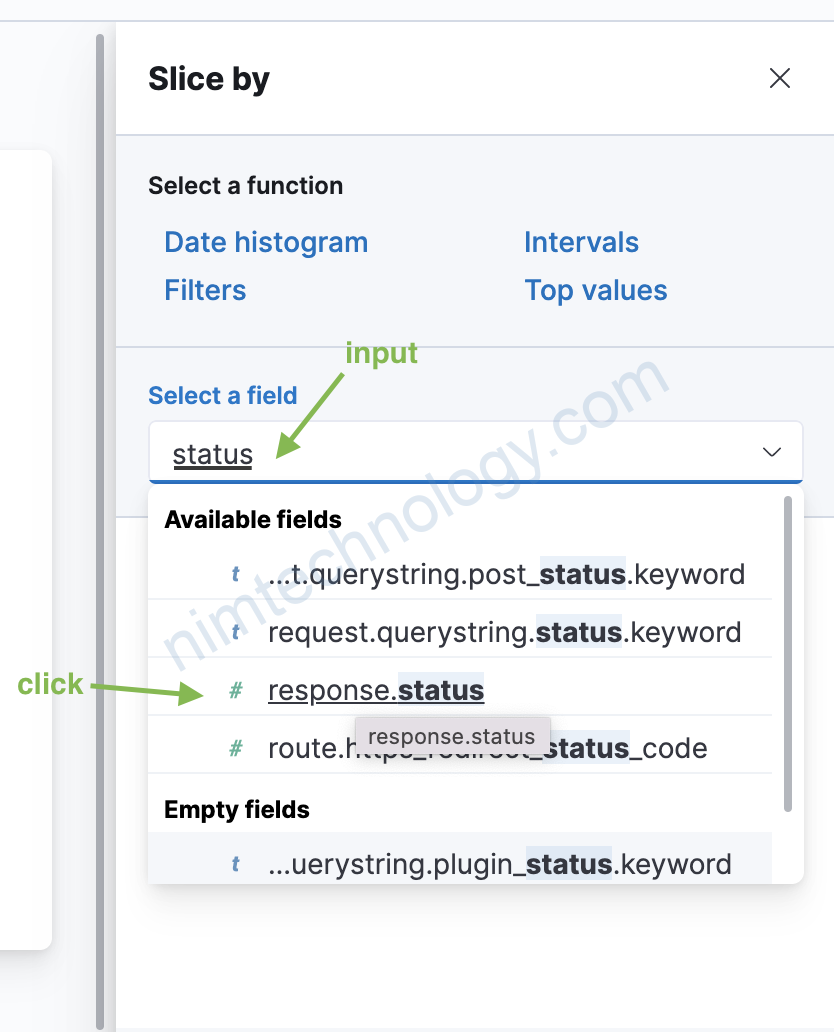
Chọn cái key/value mà bạn muốn. Ở đây mình muốn sem response status.
![](https://nimtechnology.com/wp-content/uploads/2022/01/image-222.png)
![](https://nimtechnology.com/wp-content/uploads/2022/01/image-223.png)
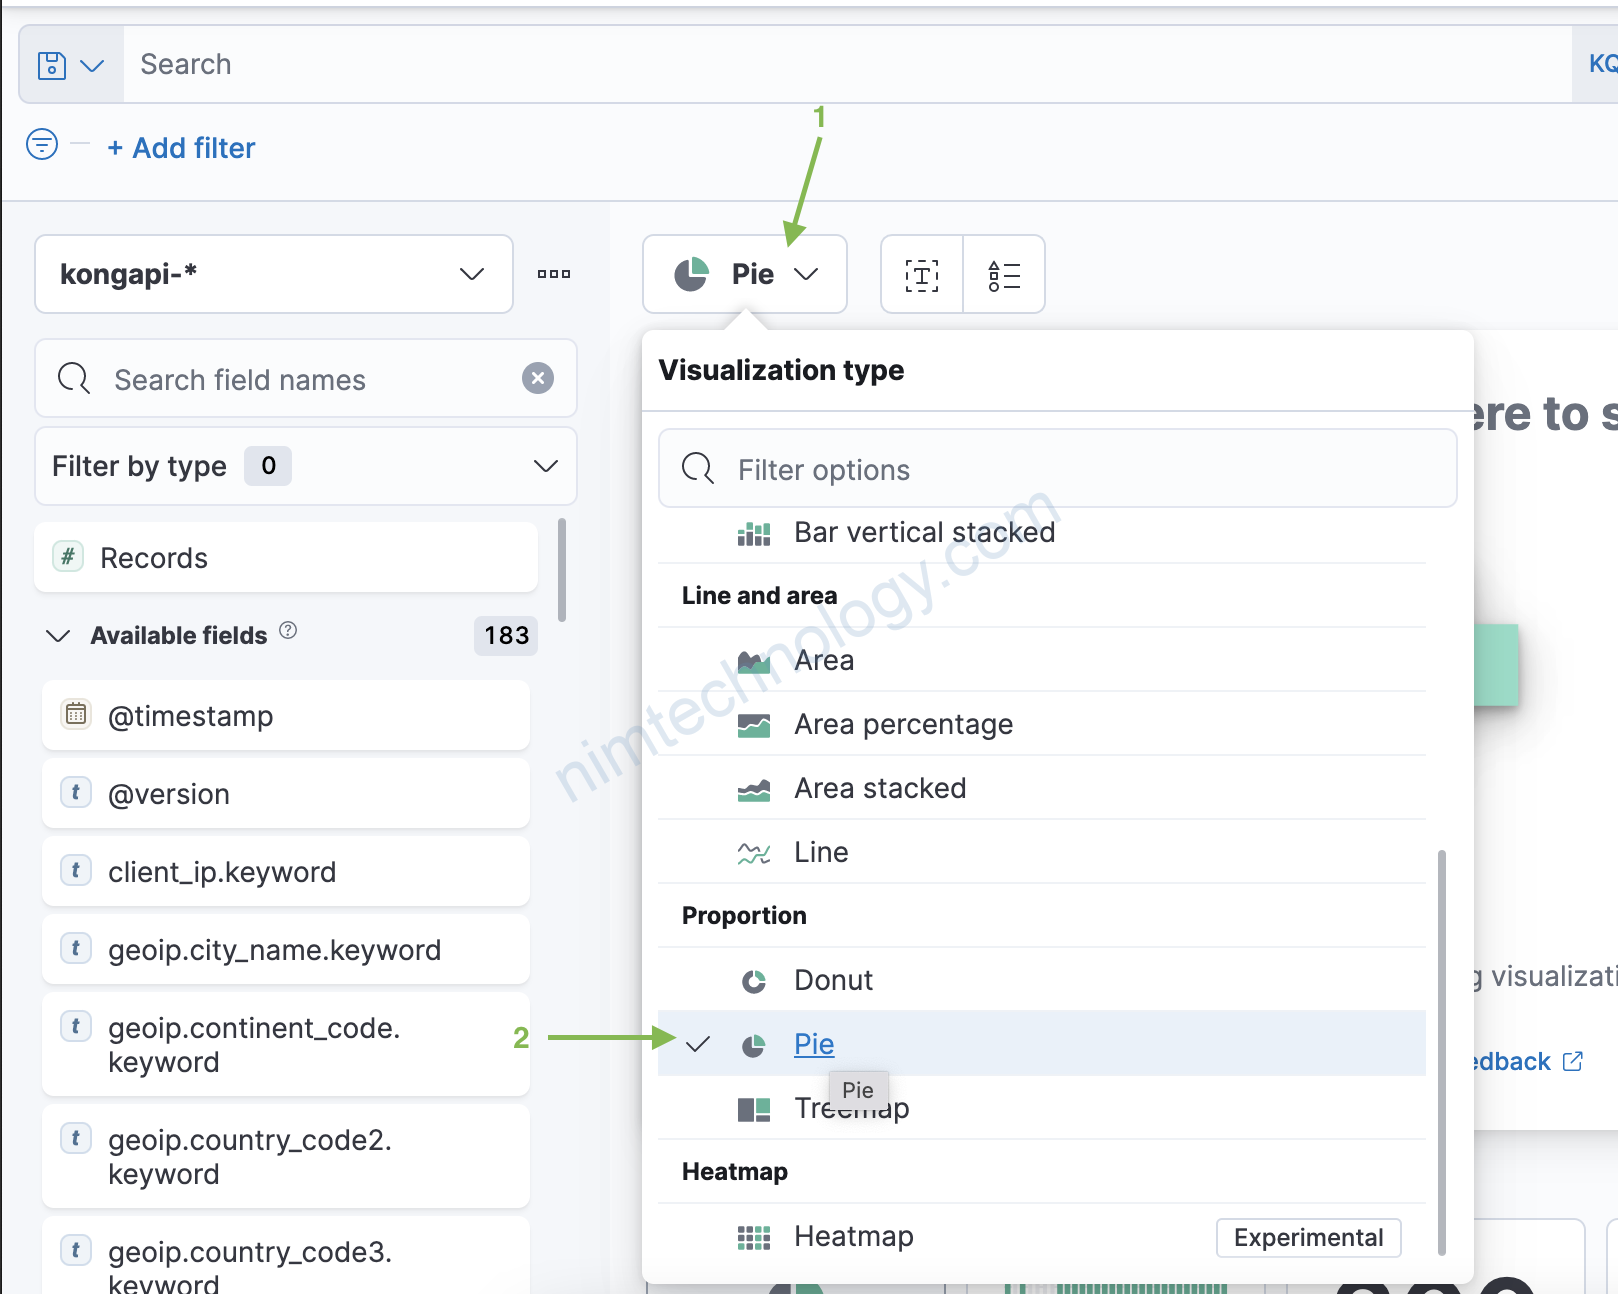
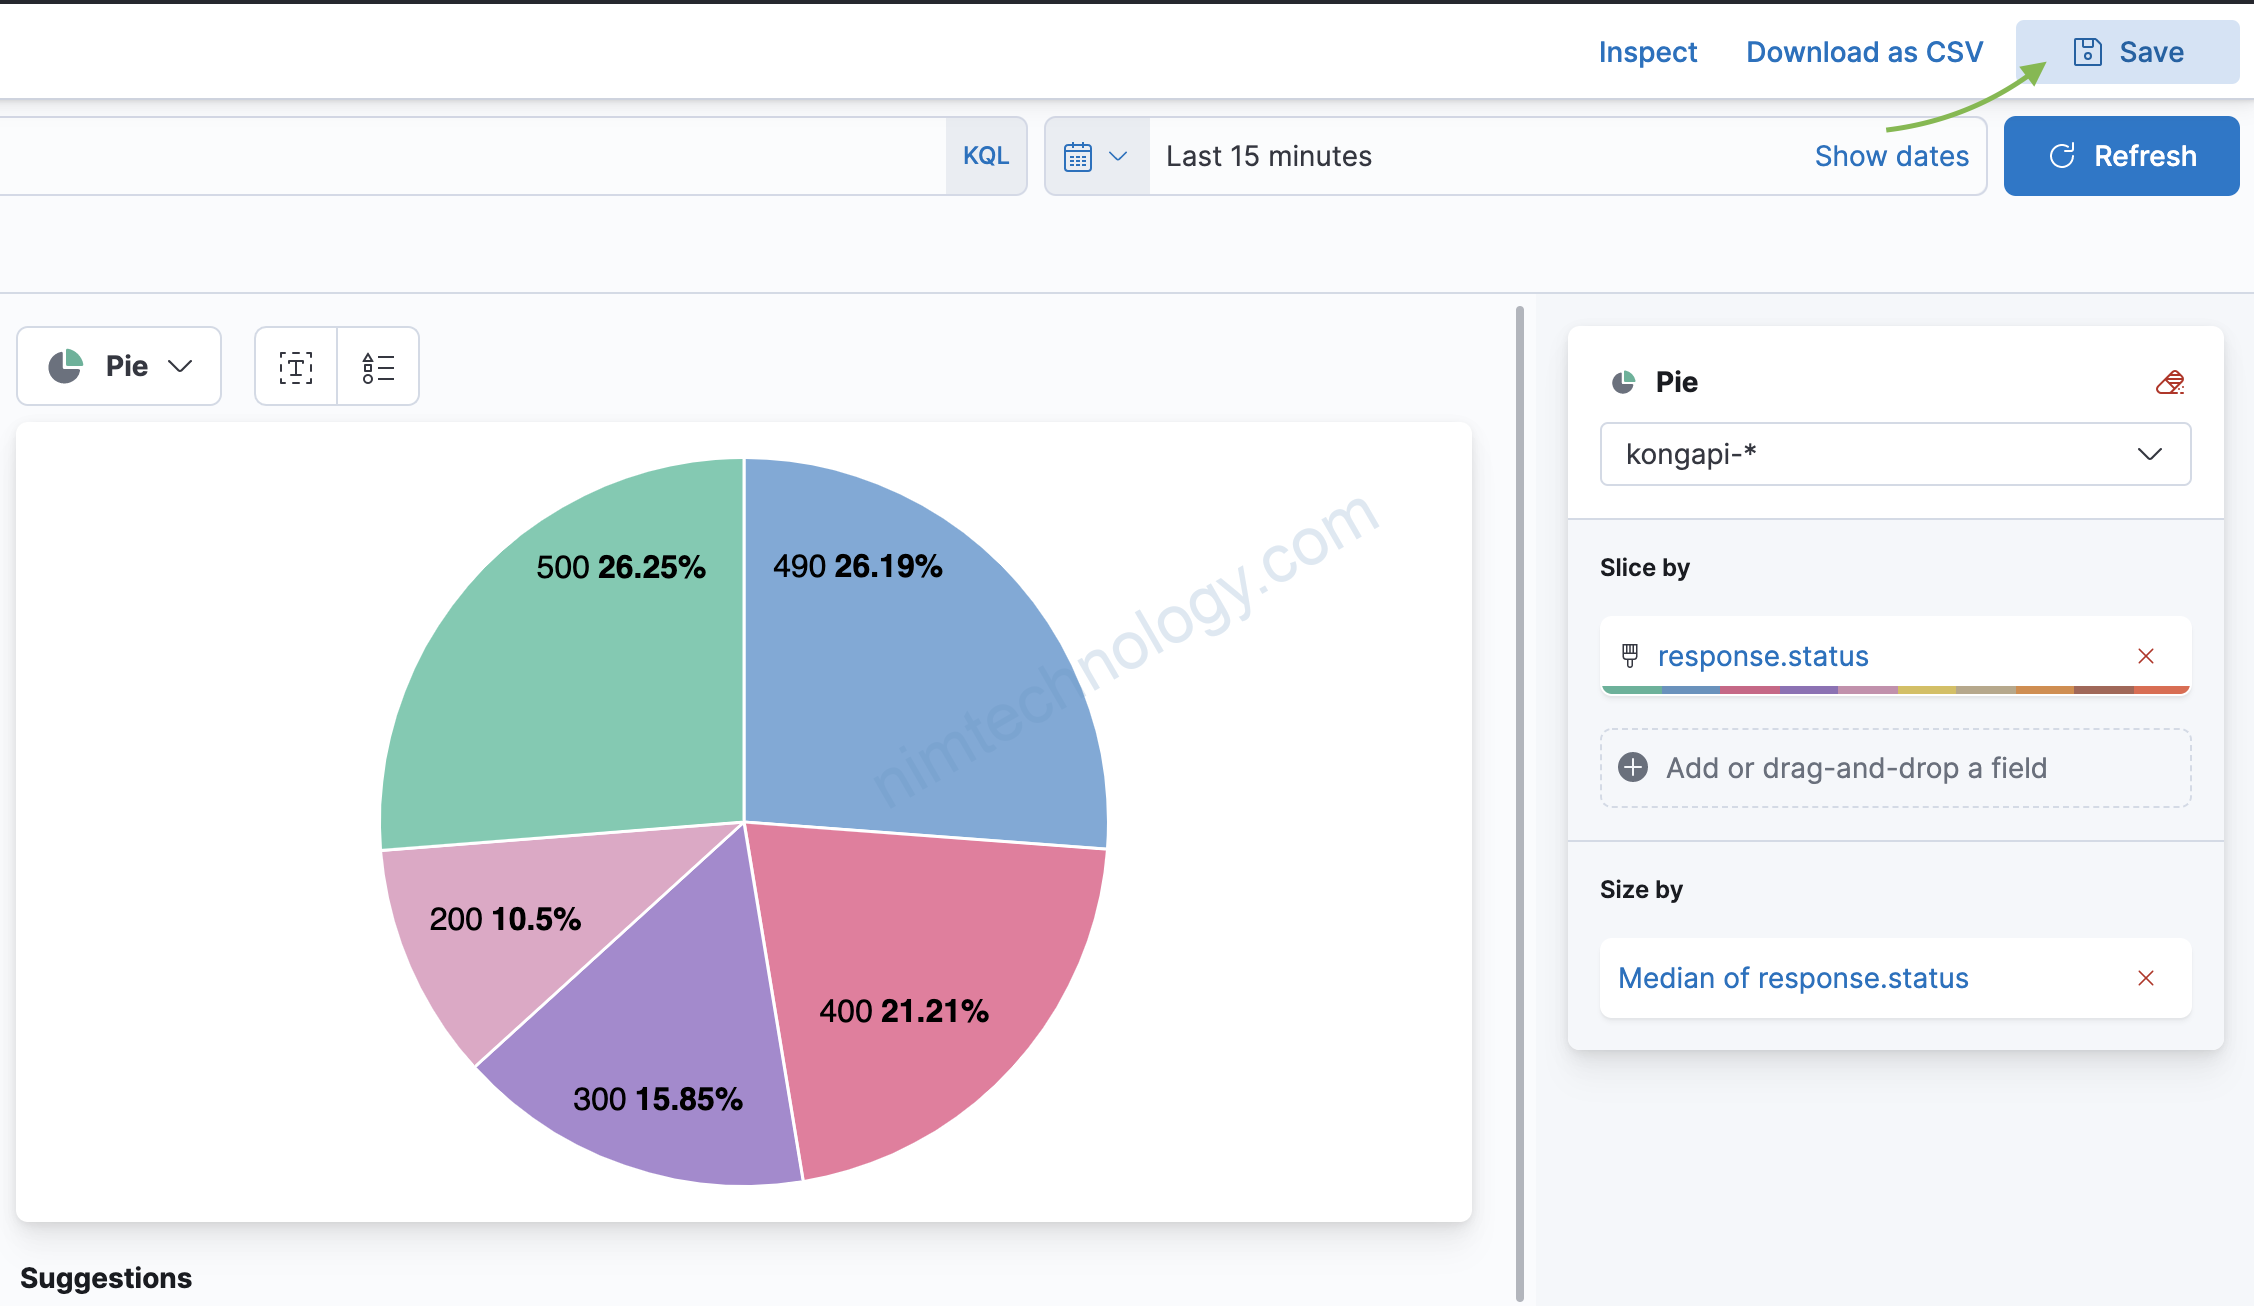
Khi chuyển trang thì chọn chart pie!
![](https://nimtechnology.com/wp-content/uploads/2022/01/image-224.png)
![](https://nimtechnology.com/wp-content/uploads/2022/01/image-225.png)
![](https://nimtechnology.com/wp-content/uploads/2022/01/image-226.png)
![](https://nimtechnology.com/wp-content/uploads/2022/01/image-227.png)
![](https://nimtechnology.com/wp-content/uploads/2022/01/image-228.png)
![](https://nimtechnology.com/wp-content/uploads/2022/01/image-229.png)
![](https://nimtechnology.com/wp-content/uploads/2022/01/image-230.png)
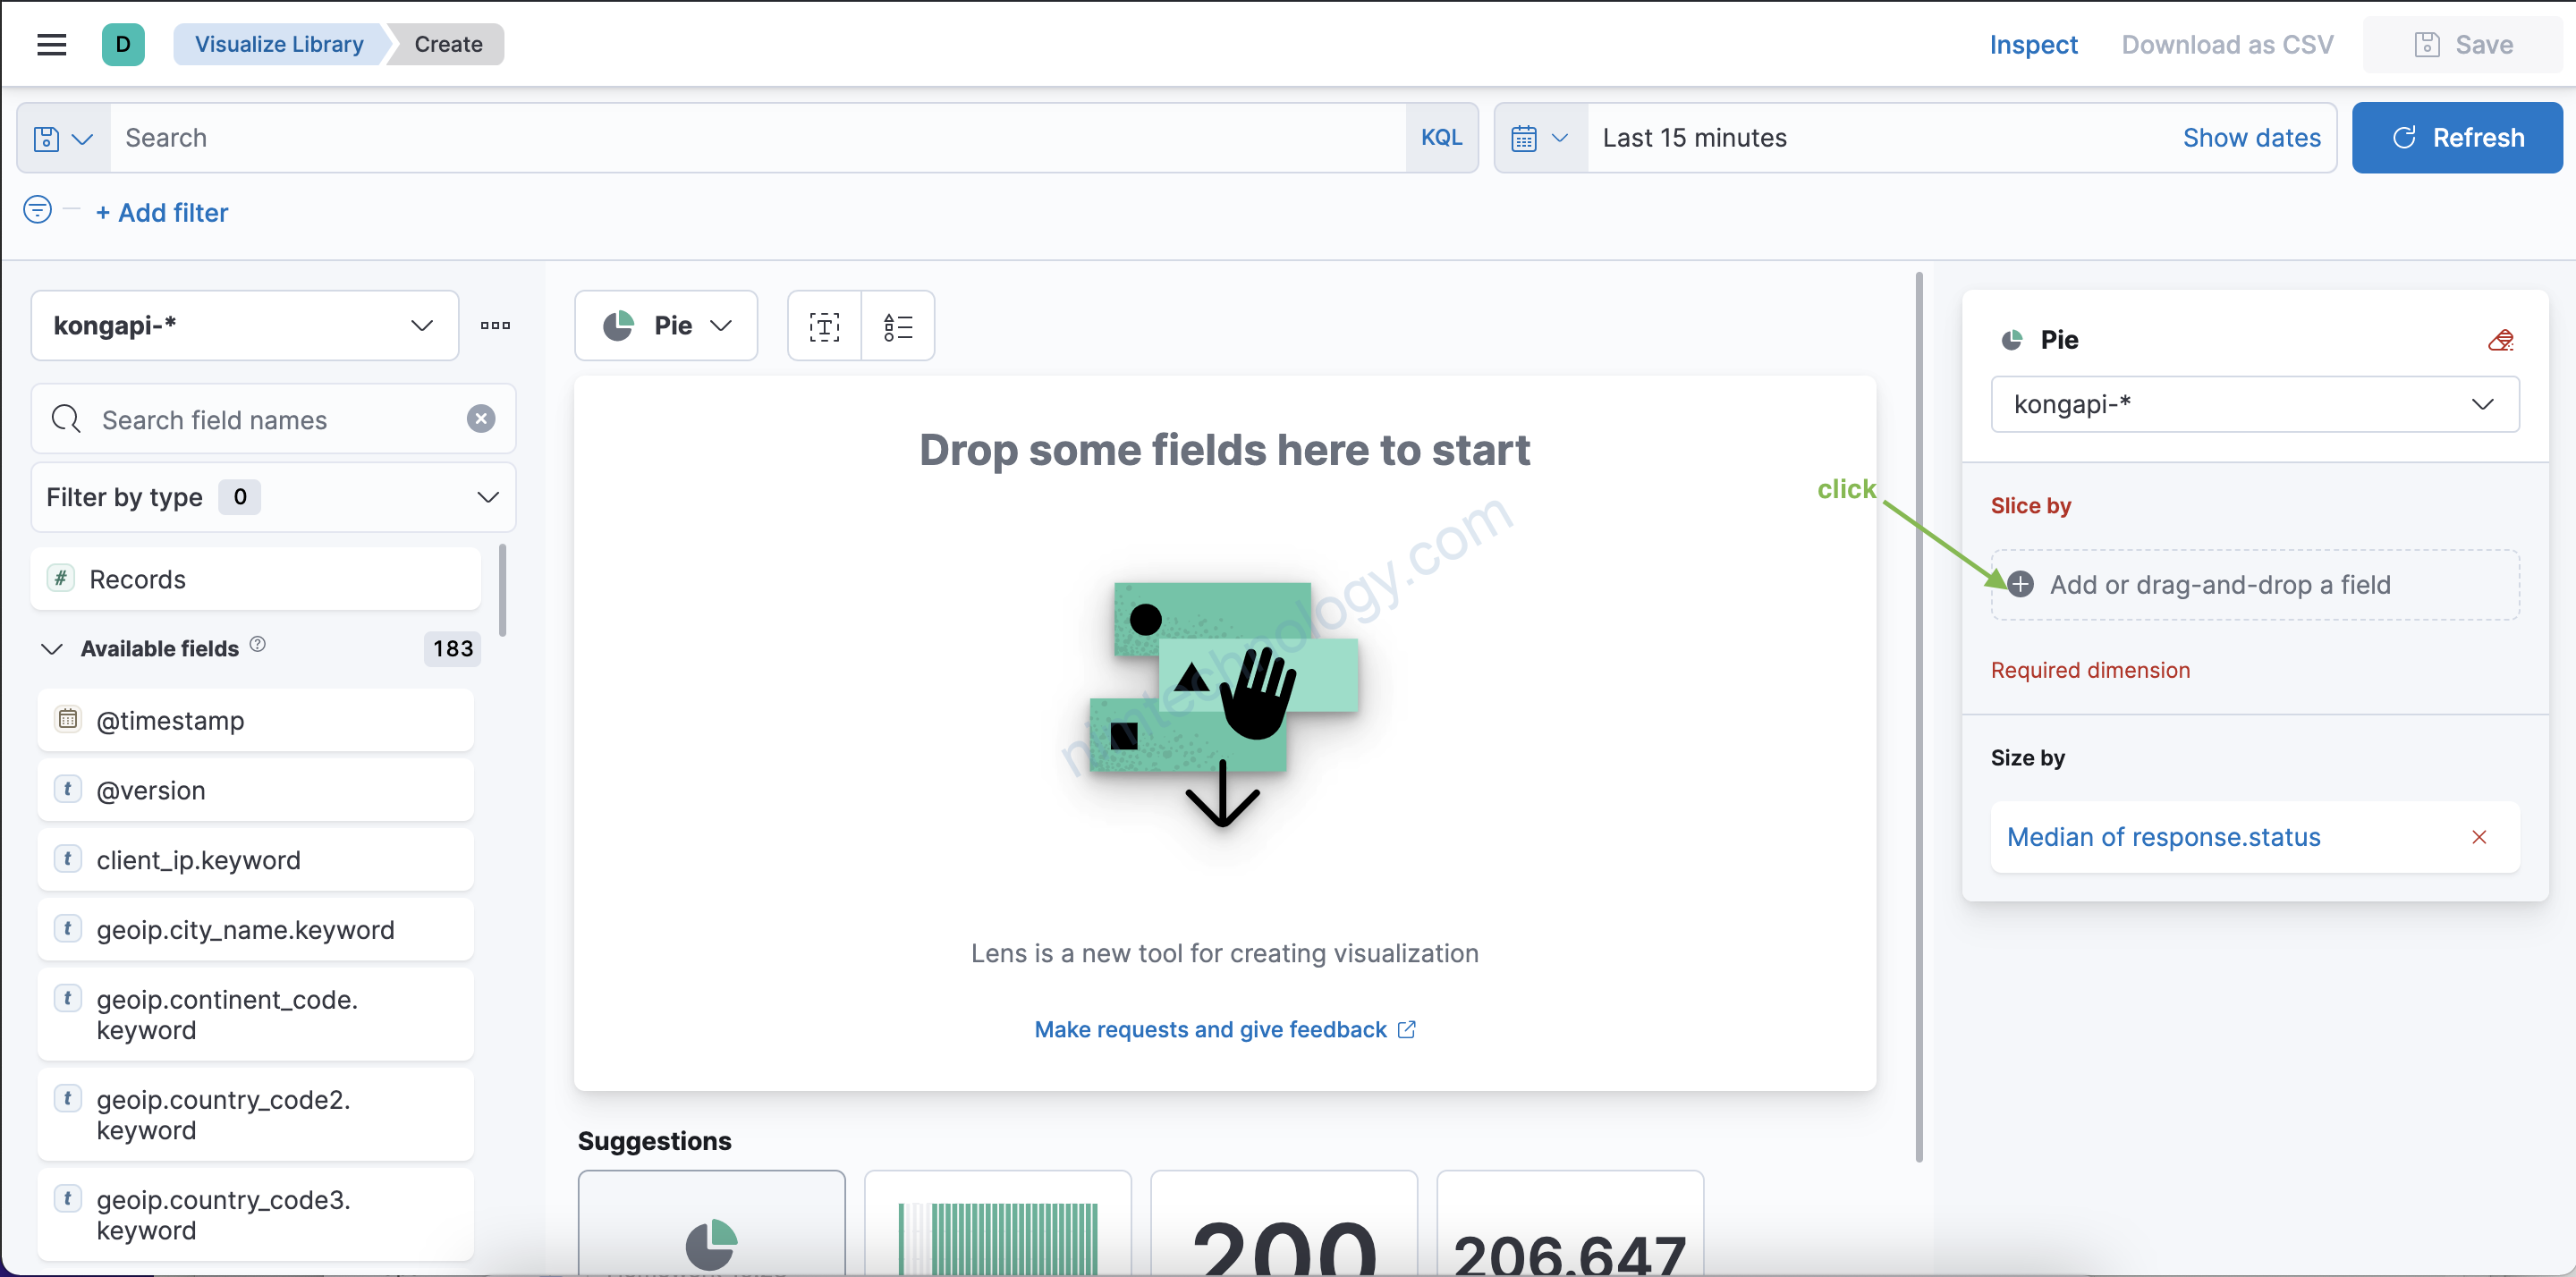
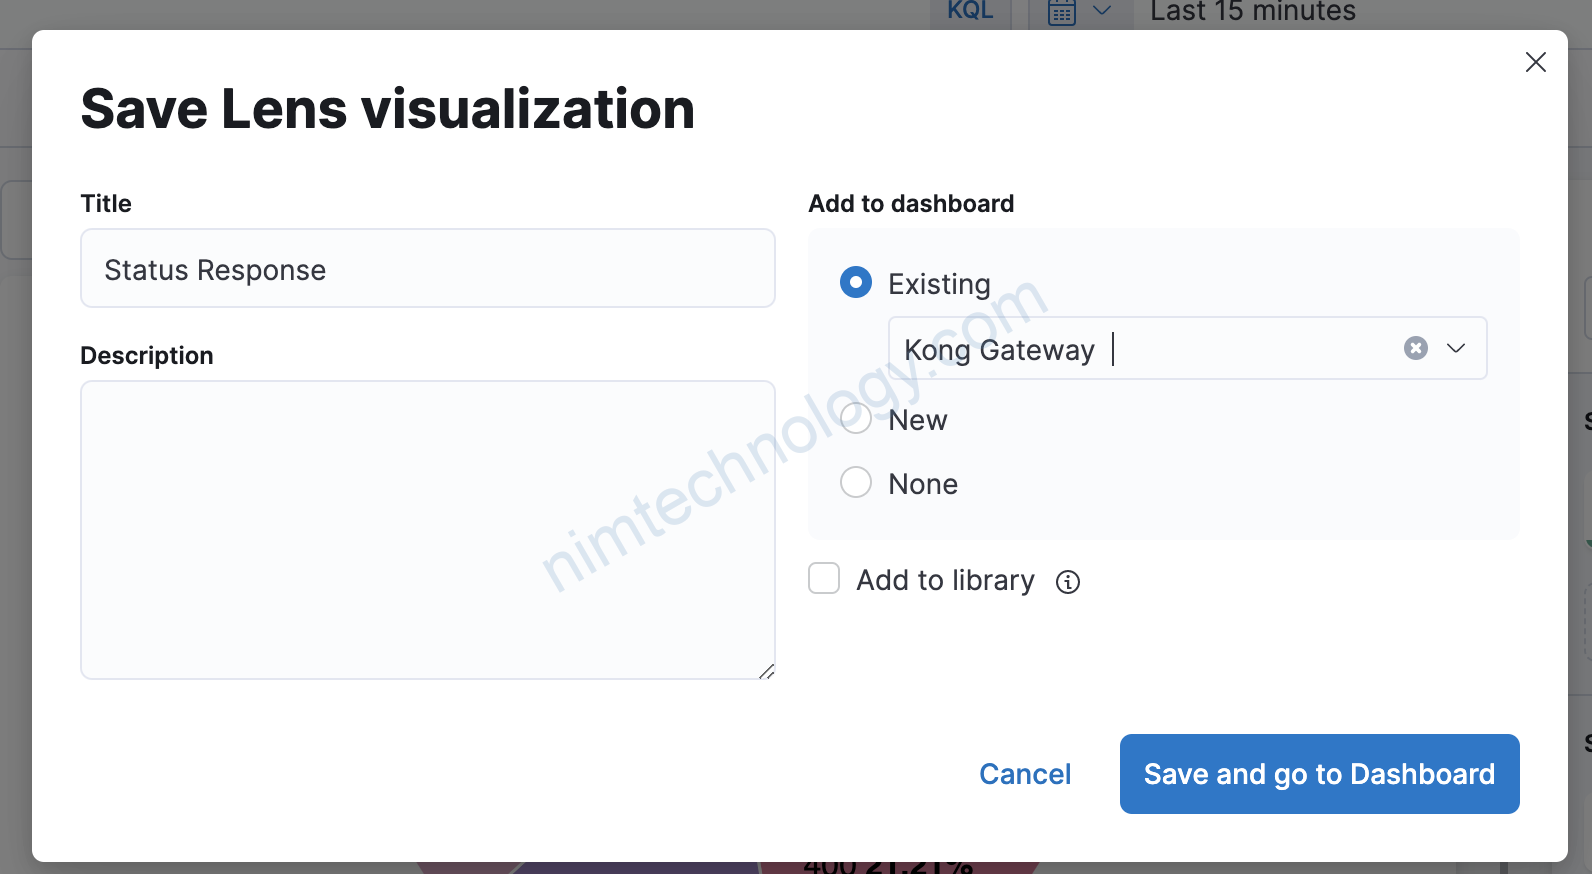
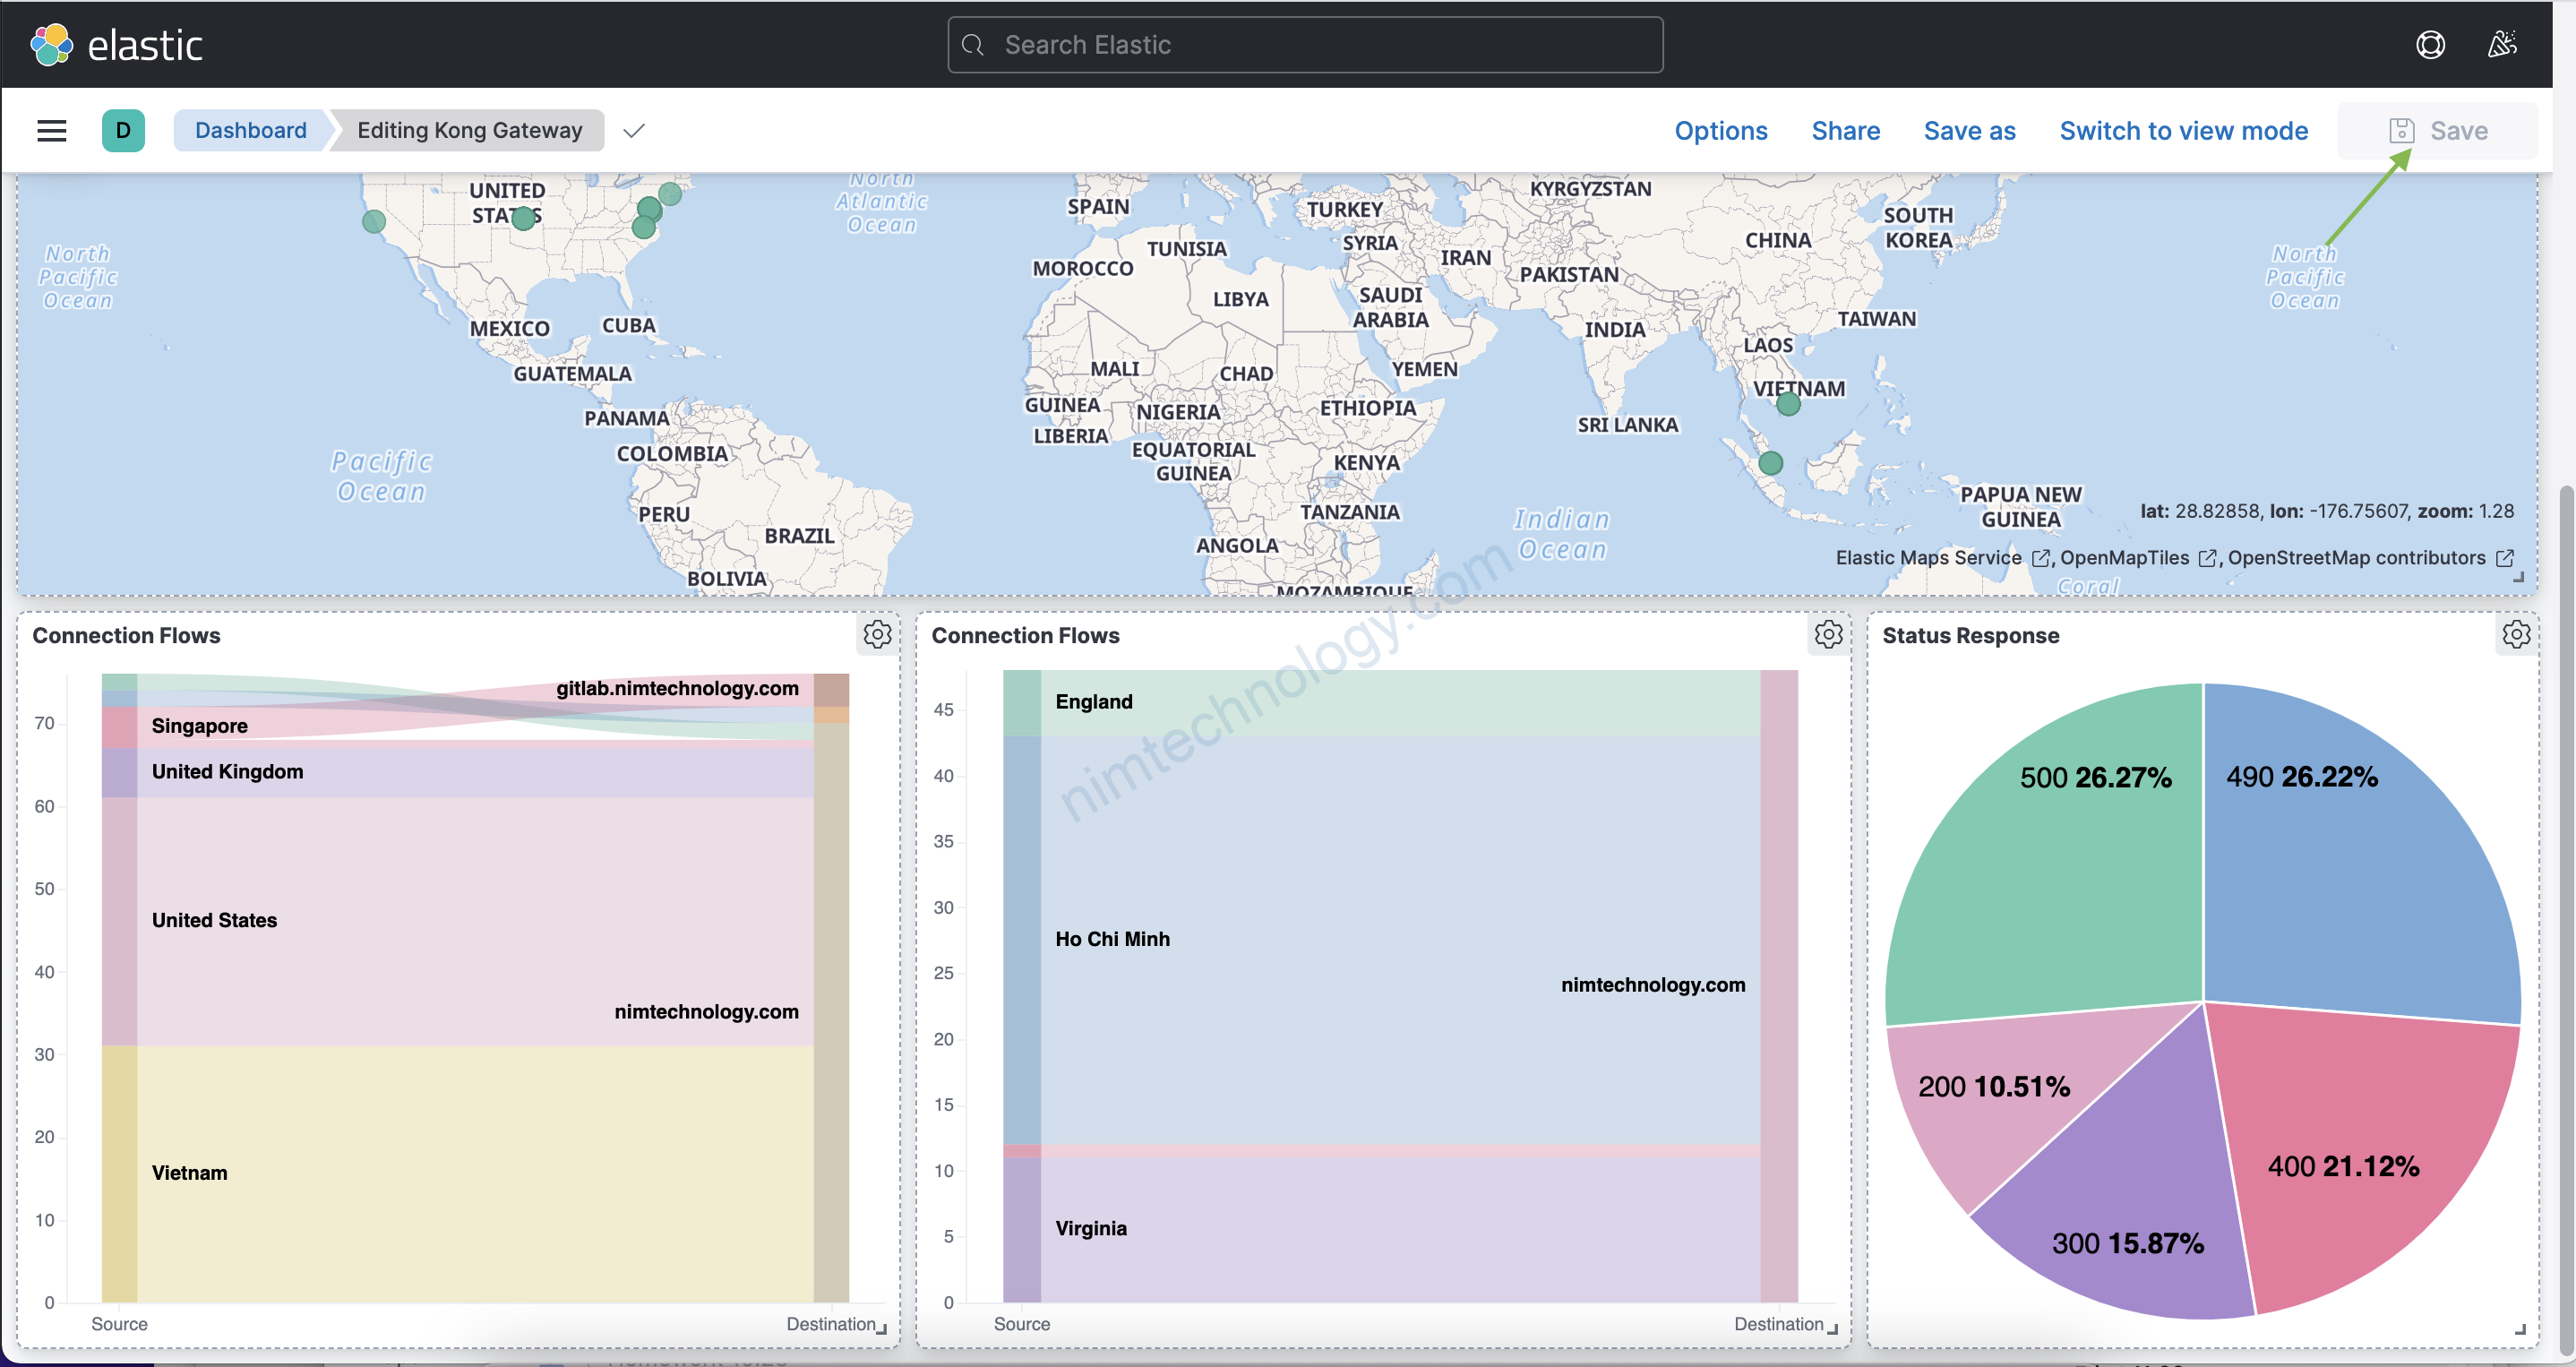
Ngon lành. How easily we make!!!