Hôm nay thì mình muốn monitor usage của pv
https://github.com/antonputra/tutorials/tree/main/lessons/134

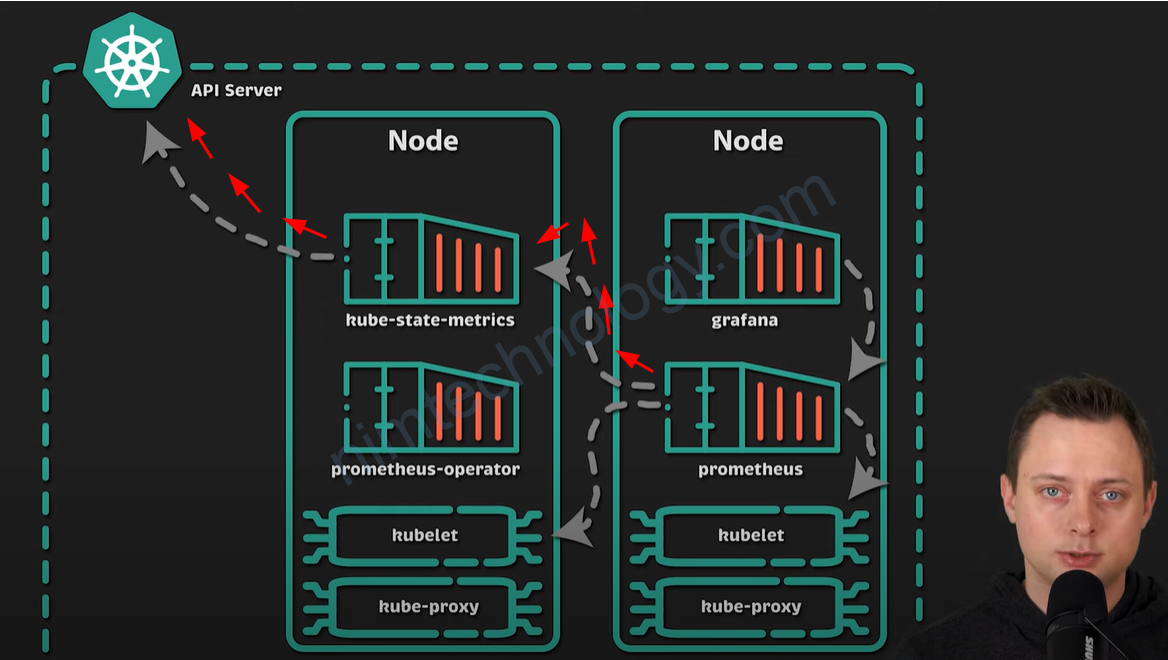
What is the kubelet
Yes, I know about the kubelet in Kubernetes (k8s). The kubelet is the primary “node agent” that runs on each node in a Kubernetes cluster. It can register the node with the apiserver using one of several methods: the hostname, a flag to override the hostname, or specific logic for a cloud provider1. The kubelet works in terms of a PodSpec, which is a YAML or JSON object that describes a pod. The kubelet takes a set of PodSpecs that are provided through various mechanisms (primarily through the apiserver) and ensures that the containers described in those PodSpecs are running and healthy1. Is there anything else you would like to know about the kubelet or Kubernetes? 😊
giờ bạn thực hiện cài kube-state-metrics
helm repo add prometheus-community https://prometheus-community.github.io/helm-charts
helm repo update
helm install [RELEASE_NAME] prometheus-community/kube-state-metrics [flags]
The kubelet collects this information from the volume plugins that have implemented metrics2. As of Kubernetes 1.7, the current volume plugins that have implemented metrics include: emptydir, secrets, gce pd, aws ebs, azure file, flocker, and portworx2. This metric can be used to monitor the disk usage of persistent volumes in a Kubernetes cluster.
PromQL:
Kubelet Volume Stats Capacity
kubelet_volume_stats_capacity_bytes{cluster_name="$cluster"}
Kubelet: Used Bytes of Volumes
kubelet_volume_stats_used_bytes{cluster_name="$cluster"}
Kubelet: Used Percentage of Volumes
kubelet_volume_stats_used_bytes{cluster_name="$cluster"}
/
kubelet_volume_stats_capacity_bytes{cluster_name="$cluster"}